- SHIB trades at 0.0000103 per week with a 2.7% increase as the technical indicators show stability and equal buy-sell volumes.
- The 63.61 at RSI / 9.83M / 15.95M at MACD shows that the buying momentum is not too high and volatile.
- The tight range is supported at $0.0000101 and has a resistance at close to $0.00001034 indicating that the market is consolidating and a shift is likely to occur.
Shiba Inu ( SHIB) has performed consistently throughout the week with a 2.7 per cent growth to trade between $0.0000103. Controlled momentum is still observed in the token since technical indicators reflecting the increasing activity are occurring at the major market levels. Recent statistics indicate the trading structure is evenly balanced with support close to $0.0000101 and resistance close to $0.00001034 indicating that the market is in consolidation and traders are watching it to see whether it is heading anywhere or not.
It is worth noting that the RSI is at 63.61 indicative of better buying conditions than the past sessions. Meanwhile, the MACD indicators indicate inconsistent momentum indicating 9.83 million MACD, 15.95 million signal and 6.12 million histogram, indicating moderate trading strength but steady. These figures coupled together bring about the realization that the token is at the stage of stability in a narrow range.
Technical Readings Reflect Controlled Market Conditions
The trend of the Relative Strength Index (RSI) is higher than the midline, which means that there is continuous buying force but not too volatile. The oscillations of prices are also contained within the range of 40 to 80 in the RSI scale indicating that the trading environment is stable and dynamic. These kinds of readings are usually preceded by directional changes without any confirmation.
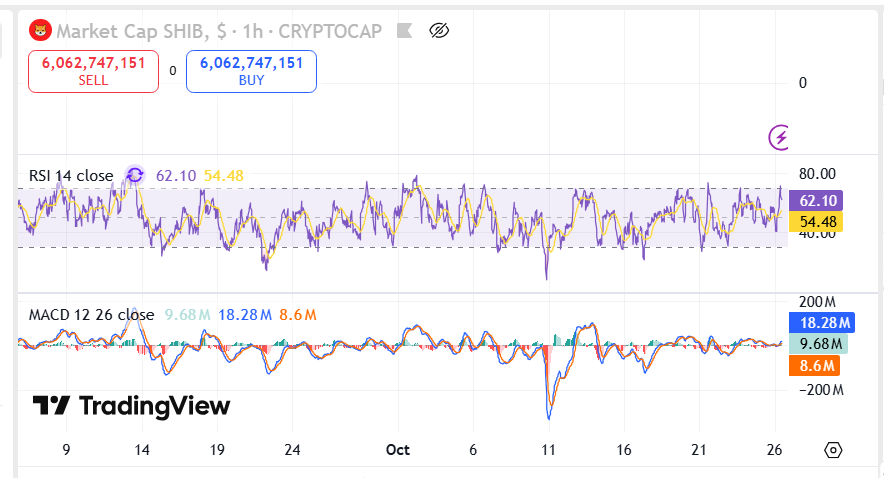 Source: TradingView
Additionally, the MACD histogram indicates short bursts of momentum aligning with minor price upticks. This behavior corresponds with observed liquidity around the support region. As buyers continue to hold above the $0.0000101 mark, market behavior shows resilience despite limited volume spikes.
Trading Volume and Short-Term Range Dynamics
Trading volume maintains a balanced profile, with sellers and buyers appearing evenly matched at roughly 6.07 billion units each. This equilibrium suggests an active yet undecided market. The price action within the 24-hour range, stretching between support and resistance levels, reinforces this steady structure.
However, as the price continues hovering near resistance, traders may observe tighter fluctuations in upcoming sessions. The consistent pattern implies participants are waiting for new catalysts before committing to larger positions. Such developments often determine whether prices sustain upward continuity or revisit established support areas.
Market Implications and Observed Trends
Market behavior reflects a short-term equilibrium rather than directional conviction. Despite rising interest, no breakout has occurred yet above the resistance line. RSI and MACD patterns continue to suggest gradual strengthening but within moderate boundaries.
Furthermore, the uniformity in buy-sell volumes may indicate preparation for increased activity once price consolidates beyond its upper limit. Analysts observing these patterns will likely monitor shifts in volume distribution and RSI levels to assess near-term trajectory consistency.
Overall, the current structure emphasizes equilibrium across the Shiba Inu market, with technical readings underscoring measured stability and controlled trading momentum.