Bitget App
Trade smarter
Buy cryptoMarketsTradeFuturesEarnWeb3SquareMore
Trade
Spot
Buy and sell crypto with ease
Margin
Amplify your capital and maximize fund efficiency
Onchain
Going Onchain, without going Onchain!
Convert & block trade
Convert crypto with one click and zero fees
Explore
Launchhub
Gain the edge early and start winning
Copy
Copy elite trader with one click
Bots
Simple, fast, and reliable AI trading bot
Trade
USDT-M Futures
Futures settled in USDT
USDC-M Futures
Futures settled in USDC
Coin-M Futures
Futures settled in cryptocurrencies
Explore
Futures guide
A beginner-to-advanced journey in futures trading
Futures promotions
Generous rewards await
Overview
A variety of products to grow your assets
Simple Earn
Deposit and withdraw anytime to earn flexible returns with zero risk
On-chain Earn
Earn profits daily without risking principal
Structured Earn
Robust financial innovation to navigate market swings
VIP and Wealth Management
Premium services for smart wealth management
Loans
Flexible borrowing with high fund security
Aptos (APT) Pulls Back to Retest Key Breakout — Will It Bounce Back?

Aptos (APT) Pulls Back to Retest Key Breakout — Will It Bounce Back?

CoinsProbeCoinsProbe2025/10/09 10:39
By:Nilesh Hembade

Date: Thu, Oct 09, 2025 | 05:04 AM GMT

The cryptocurrency market is showing a brief pause in volatility after an impressive rally that pushed Bitcoin (BTC) to a new all-time high of $126,000, before easing to around $122,000. Meanwhile, Ethereum (ETH) is holding steady near $4,450, signaling a period of consolidation across major assets.

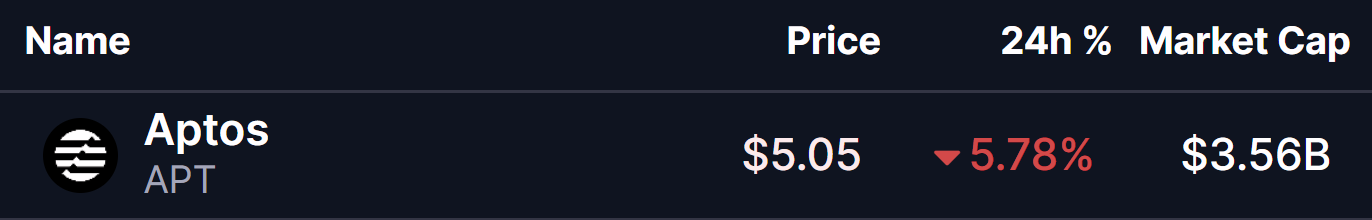
Amid this calm, Aptos (APT) sees 5% daily decline, but what’s happening beneath the surface tells a more interesting story — the token is retesting a major breakout zone, which could soon determine its next major direction.

Aptos (APT) Pulls Back to Retest Key Breakout — Will It Bounce Back? image 0 Source: Coinmarketcap

Retesting the Descending Triangle

For several weeks, APT traded inside a Descending Triangle, a pattern often seen as bearish since it tends to break to the downside. However, APT surprised traders by doing the opposite — breaking out upward through the triangle’s descending resistance line.

This bullish reversal began when APT found strong demand around $3.97, triggering accumulation and a swift push higher. The breakout above $5.03 confirmed a shift in market structure, drawing renewed confidence from traders.

Aptos (APT) Pulls Back to Retest Key Breakout — Will It Bounce Back? image 1 
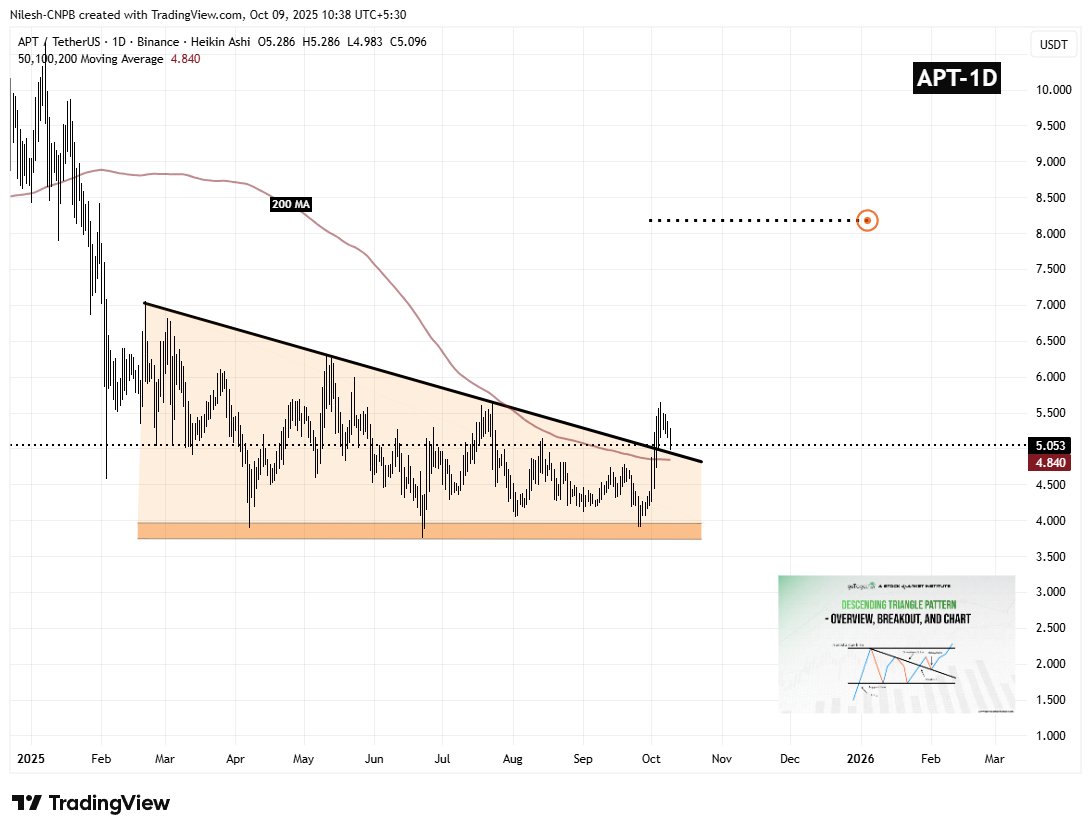
Aptos (APT) Daily Chart/Coinsprobe (Source: Tradingview)

Following the breakout, APT climbed to a local high of $5.648, where some profit-taking caused a short-term pullback. Now, the price is revisiting the breakout zone near $5.0, which aligns with the former resistance trendline — an area that often transforms into support after a successful breakout.

This retest phase is critical; if buyers step in here, it could signal the continuation of the bullish move.

What’s Next for APT?

The current setup looks technically constructive, but the next few sessions will be key. Bulls are now focusing on defending both the breakout level around $4.95 and the 200-day moving average (MA) near $4.84.

If APT manages to hold these supports and regain upward momentum, the next target for buyers would be to reclaim the recent local high at $5.648. A confirmed breakout above that level could potentially open the door to the next resistance zone near $8.18 — representing a possible 62% upside from current prices.

On the other hand, if APT fails to hold the $4.95 area or slips below the 200-day MA, the bullish breakout could be invalidated, leading to a deeper consolidation phase before any further upward move.

0

Disclaimer: The content of this article solely reflects the author's opinion and does not represent the platform in any capacity. This article is not intended to serve as a reference for making investment decisions.

PoolX: Earn new token airdrops
Lock your assets and earn 10%+ APR
Lock now!

You may also like

IOSG: Understanding Stablecoin Public Chains in One Article

Public blockchains centered on stablecoins have already achieved the necessary scale and stability. To become everyday currencies, they still need: a consumer-grade user experience, programmable compliance, and transactions with imperceptible fees.

Chaincatcher2025/10/09 17:41
IOSG: Understanding Stablecoin Public Chains in One Article

Trading stocks is better than trading crypto? A global wave of "virtual asset reserves" emerges, with the DAT strategy of listed companies becoming a new investment trend

Enterprises are increasing their investments in bitcoin and ethereum, with DAT strategies setting a new paradigm in the capital market.

Chaincatcher2025/10/09 17:39
Trading stocks is better than trading crypto? A global wave of "virtual asset reserves" emerges, with the DAT strategy of listed companies becoming a new investment trend

Tether’s Next Chapter: From Offshore Issuance to Ambitions for Global Compliance Infrastructure

Can Tether evolve from an offshore issuer to a multi-chain, compliant infrastructure provider without compromising its core advantages in liquidity and distribution?

Chaincatcher2025/10/09 17:39
Tether’s Next Chapter: From Offshore Issuance to Ambitions for Global Compliance Infrastructure

What will be the peak of Ethereum?

Based on multiple historical and on-chain indicators, the article's author Michael Nadeau conducts a scenario analysis of the potential peak price of Ethereum in the current bull market, aiming to provide a quantitative reference for Tom Lee's "supercycle" hypothesis. By tracking the 200-week moving average, price-to-realized price ratio, MVRV Z-score, Ethereum-to-Bitcoin market cap ratio, and its ratio to the Nasdaq Index, the article presents a range of specific potential price targets, mainly concentrated in the $7,000 to $13,500 range.

Chaincatcher2025/10/09 17:39
What will be the peak of Ethereum?