Ethereum's Critical Support Level and Bearish Implications After Trendline Break: A Technical Analysis and Risk Management Guide for Crypto Investors
- Ethereum hovers near critical $4,300 support in August 2025, with technical indicators showing conflicting bearish and bullish signals. - RSI indicates overbought conditions (70.93), while MACD (322.11) reflects institutional accumulation and long-term optimism. - Institutional confidence grows as BitMine and BlackRock increase holdings, but NVT ratio warns of potential overvaluation. - A breakdown below $4,300 risks 10% correction to $3,950, while successful defense could target $4,700 with proper risk
Ethereum (ETH) has entered a pivotal phase in August 2025, with its price action tightly clustered around the critical $4,300 support level. This level, historically significant as both a psychological and technical barrier, now faces intense scrutiny as traders weigh the risks of a breakdown versus a potential rebound [2]. The recent trendline break—a key technical signal—has intensified bearish sentiment, raising questions about the asset’s near-term trajectory.
Technical Analysis: A Tug-of-War Between Bulls and Bears
The Relative Strength Index (RSI) currently sits at 70.93, signaling overbought conditions and hinting at short-term profit-taking [3]. Meanwhile, the Moving Average Convergence Divergence (MACD) remains bullish at 322.11, reflecting institutional accumulation and lingering long-term optimism [3]. This divergence underscores a tug-of-war between immediate selling pressure and deeper conviction in Ethereum’s fundamentals.
A breakdown below $4,300 could trigger a 10% correction, with the next key support at $4,200. If this level fails, the price could extend lower to $3,950 or beyond [5]. Conversely, a successful defense above $4,200 might rekindle bullish momentum, targeting $4,400, $4,550, and eventually $4,700 [5]. The Network Value to Transactions (NVT) ratio, however, warns of overvaluation, having spiked to historically high levels [3]. This metric suggests that Ethereum’s price may be outpacing its on-chain utility, a red flag for risk-averse investors.
Historical backtesting of Ethereum’s support-level rebounds from 2022 to 2025 reveals a statistically significant positive drift. Specifically, 60 valid support events show that holding for 13–20 trading days after a rebound yields an average 9% excess return compared to the benchmark (+1.6%), with a win rate of 63–66% from day 13 onward. This suggests that a successful defense of $4,300 could provide a favorable risk-reward profile for investors who time their entries appropriately.
Institutional Confidence vs. Market Volatility
Despite the bearish risks, institutional confidence remains robust. BitMine Immersion Technologies and BlackRock have increased Ethereum holdings, while whale activity signals long-term conviction [2]. These inflows counterbalance September’s historical weakness in crypto markets, a period often marked by seasonal outflows [2]. However, the broader market context is mixed: while adoption in stablecoins, DeFi, and real-world asset tokenization drives institutional interest, volatility remains a persistent threat [2].
Risk Management Strategies for Investors
For crypto investors, the current environment demands a disciplined approach to risk management. Key strategies include:
1. Stop-Loss Orders: Placing stop-losses below $4,200 to mitigate losses in a breakdown scenario.
2. Position Sizing: Allocating smaller positions to speculative targets like $4,700, given the NVT ratio’s overvaluation warning [3].
3. Diversification: Balancing Ethereum exposure with other assets to hedge against sector-specific risks.
4. Monitoring On-Chain Metrics: Tracking NVT and whale activity to gauge market sentiment shifts [3].
A successful defense of $4,300 could align with Crypto Rover’s prediction of a $5,000 breakout, but this outcome hinges on institutional buyers stepping in to stabilize the price [1]. Investors should remain cautious, as a breakdown could test the resilience of Ethereum’s ecosystem amid broader market uncertainty.
Conclusion
Ethereum’s critical support level at $4,300 represents a make-or-break moment for bulls. While technical indicators and institutional inflows offer a glimmer of hope, the risks of a 10% correction loom large. By combining technical analysis with prudent risk management, investors can navigate this volatile phase while positioning themselves to capitalize on potential rebounds.
Source:
[2] Ethereum's Critical Support Breakdown: Is a 10% Correction Incoming?
[3] Ethereum's Critical $4300 Support: A Make-or-Break Moment in August 2025
Disclaimer: The content of this article solely reflects the author's opinion and does not represent the platform in any capacity. This article is not intended to serve as a reference for making investment decisions.
You may also like
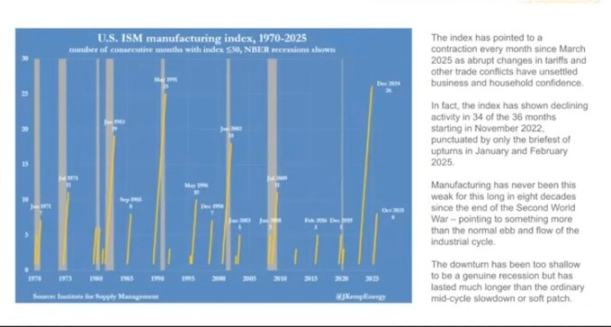
As economic cracks deepen, bitcoin may become the next liquidity "release valve"
The US economy is showing a divided state, with financial markets booming while the real economy is declining. The manufacturing PMI continues to contract, yet the stock market is rising due to concentrated profits in technology and financial companies, resulting in balance sheet inflation. Monetary policy struggles to benefit the real economy, and fiscal policy faces difficulties. The market structure leads to low capital efficiency, widening the gap between rich and poor and increasing social discontent. Cryptocurrency is seen as a relief valve, offering open financial opportunities. The economic cycle oscillates between policy adjustments and market reactions, lacking substantial recovery. Summary generated by Mars AI. The accuracy and completeness of this summary are still being iteratively updated by the Mars AI model.

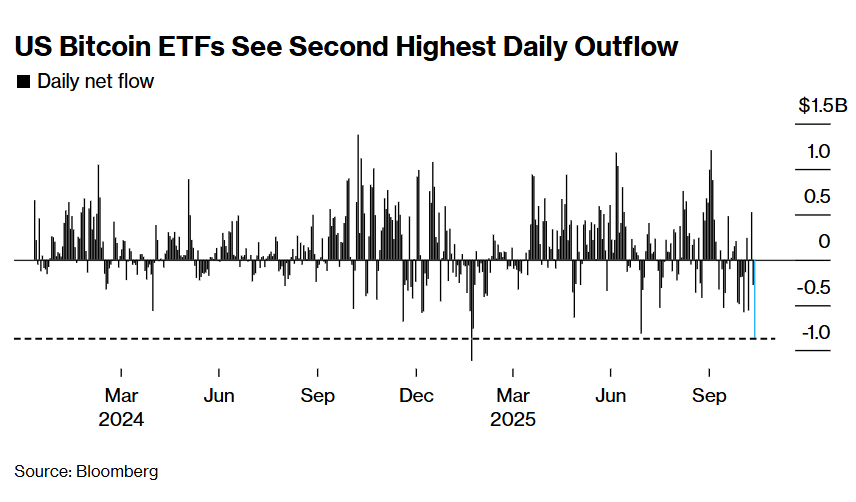
The wave of cryptocurrency liquidations continues! US Bitcoin ETF sees second highest single-day outflow in history
Due to the reassessment of Federal Reserve rate cut expectations and the fading rebound of the U.S. stock market, the crypto market continues to experience liquidations, with significant ETF capital outflows and options traders increasing bets on volatility. Institutions warn that technical support for bitcoin above $90,000 is weak.

When traditional financial markets fail, will the crypto industry become a "pressure relief valve" for liquidity?
As long as the system continues to recycle debt into asset bubbles, we will not see a true recovery—only a slow stagnation masked by rising nominal figures.

A Quiet End to 2025 Could Prime Crypto for a 2026 Breakout, Analysts Say
