Breakdown Or Bear Trap? BNB Loses Trendline But Flashes Strong Rebound Signals
By: Newsbtc
BNB has slipped below its long-standing bullish trendline, raising fresh concerns about a deeper pullback. However, the selloff is unfolding right into a key support zone, where multiple technical signals hint that buyers may be preparing for a counter-move. With breakdown risk clashing against early rebound signs, BNB now sits at a pivotal moment that could define the next major move.
Bullish Trendline Break Signals A Change In BNB Market Character
According to crypto analyst Marcus Corvinus, BNB has just experienced a significant structural shift by losing its long-held bullish trendline. This technical break is a critical development that is rapidly changing the market mood from optimism to caution, as a primary support trendline has been invalidated.

The analyst noted that while the price had been respecting this upward trend for a considerable period, this decisive break indicates that buyers are finally losing control. Momentum is visibly cooling off, providing sellers with the necessary opening to press and take command of the short-term price action.
var rnd = window.rnd || Math.floor(Math.random()*10e6); var pid607465 = window.pid607465 || rnd; var plc607465 = window.plc607465 || 0; var abkw = window.abkw || ''; var absrc = 'https://servedbyadbutler.com/adserve/;ID=172179;size=0x0;setID=607465;type=js;sw='+screen.width+';sh='+screen.height+';spr='+window.devicePixelRatio+';kw='+abkw+';pid='+pid607465+';place='+(plc607465++)+';rnd='+rnd+';click=CLICK_MACRO_PLACEHOLDER'; document.write(' ');
if (!window.AdButler){(function(){var s = document.createElement("script"); s.async = true; s.type = "text/javascript";s.src = "https://servedbyadbutler.com/app.js";var n = document.getElementsByTagName("script")[0]; n.parentNode.insertBefore(s, n);}());} var AdButler = AdButler || {}; AdButler.ads = AdButler.ads || []; var abkw = window.abkw || ""; var plc366606 = window.plc366606 || 0; (function(){ var divs = document.querySelectorAll(".plc366606:not([id])"); var div = divs[divs.length-1]; div.id = "placement_366606_"+plc366606; AdButler.ads.push({handler: function(opt){ AdButler.register(172179, 366606, [728,90], "placement_366606_"+opt.place, opt); }, opt: { place: plc366606++, keywords: abkw, domain: "servedbyadbutler.com", click:"CLICK_MACRO_PLACEHOLDER" }}); })();
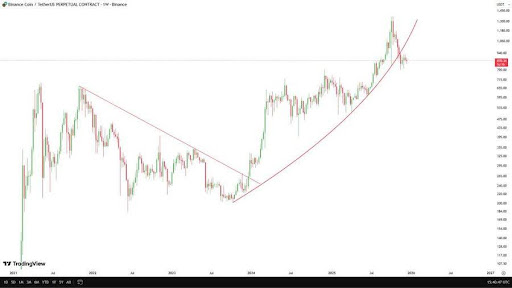 BNB loses key upward trendline | Source: Chart from Marcus Corvinus on X
 Corvinus warned that if the price fails to reclaim the broken trendline, the path will likely open for a much deeper move to the downside. He emphasized that this current behavior appears to be a fundamental shift in market structure rather than just a typical small pullback, suggesting a more prolonged period of weakness.
Thus, the market has now entered a caution zone, with the analyst noting that bears are knocking on the door of lower support levels. The next major reaction from the market will be the deciding factor in whether BNB can recover its uptrend or embark on a new, sustained bearish trajectory.
Confluence Emerges At Key Support Zone
In a recent update shared on X, analyst Batman revealed that BNB is currently carving out a highly attractive long setup. The asset is exhibiting a rare alignment of multiple technical indicators, suggesting that the current price level may serve as a powerful launchpad for the next leg up.
var rnd = window.rnd || Math.floor(Math.random()*10e6); var pid607472 = window.pid607472 || rnd; var plc607472 = window.plc607472 || 0; var abkw = window.abkw || ''; var absrc = 'https://servedbyadbutler.com/adserve/;ID=172179;size=0x0;setID=607472;type=js;sw='+screen.width+';sh='+screen.height+';spr='+window.devicePixelRatio+';kw='+abkw+';pid='+pid607472+';place='+(plc607472++)+';rnd='+rnd+';click=CLICK_MACRO_PLACEHOLDER'; document.write(' ');
if (!window.AdButler){(function(){var s = document.createElement("script"); s.async = true; s.type = "text/javascript";s.src = "https://servedbyadbutler.com/app.js";var n = document.getElementsByTagName("script")[0]; n.parentNode.insertBefore(s, n);}());} var AdButler = AdButler || {}; AdButler.ads = AdButler.ads || []; var abkw = window.abkw || ""; var plc452518 = window.plc452518 || 0; (function(){ var divs = document.querySelectorAll(".plc452518:not([id])"); var div = divs[divs.length-1]; div.id = "placement_452518_"+plc452518; AdButler.ads.push({handler: function(opt){ AdButler.register(172179, 452518, [728,90], "placement_452518_"+opt.place, opt); }, opt: { place: plc452518++, keywords: abkw, domain: "servedbyadbutler.com", click:"CLICK_MACRO_PLACEHOLDER" }}); })();

Binance Coin (BNB) Extends Pullback as Meme-Coin Rug Pulls Sting BNB Chain
This setup is rooted in a confluence of support levels. Specifically, BNB is resting within a strong bullish Fair Value Gap (FVG). This high-interest zone has seen a positive reaction from the market, as the price tapped the 0.618 Fibonacci retracement level.
To further bolster the bullish conviction, the momentum oscillators have aligned with the price action. Batman pointed out that the Stochastic indicator has officially formed a bullish divergence followed by a golden cross. Significantly, this combination signals that selling exhaustion has been reached and that buyers may be regaining control, thereby paving the way for a potential sustained price recovery.
 BNB trading at $835 on the 1D chart | Source: BNBUSDT on Tradingview.com
 Featured image from Adobe Stock, chart from Tradingview.com
var rnd = window.rnd || Math.floor(Math.random()*10e6); var pid607473 = window.pid607473 || rnd; var plc607473 = window.plc607473 || 0; var abkw = window.abkw || ''; var absrc = 'https://servedbyadbutler.com/adserve/;ID=172179;size=0x0;setID=607473;type=js;sw='+screen.width+';sh='+screen.height+';spr='+window.devicePixelRatio+';kw='+abkw+';pid='+pid607473+';place='+(plc607473++)+';rnd='+rnd+';click=CLICK_MACRO_PLACEHOLDER'; document.write(' ');
if (!window.AdButler){(function(){var s = document.createElement("script"); s.async = true; s.type = "text/javascript";s.src = 'https://servedbyadbutler.com/app.js';var n = document.getElementsByTagName("script")[0]; n.parentNode.insertBefore(s, n);}());} var AdButler = AdButler || {}; AdButler.ads = AdButler.ads || []; var abkw = window.abkw || ''; var plc452519 = window.plc452519 || 0; (function(){ var divs = document.querySelectorAll(".plc452519:not([id])"); var div = divs[divs.length-1]; div.id = "placement_452519_"+plc452519; AdButler.ads.push({handler: function(opt){ AdButler.register(172179, 452519, [728,90], 'placement_452519_'+opt.place, opt); }, opt: { place: plc452519++, keywords: abkw, domain: 'servedbyadbutler.com', click:'CLICK_MACRO_PLACEHOLDER' }}); })();
Disclaimer: The content of this article solely reflects the author's opinion and does not represent the platform in any capacity. This article is not intended to serve as a reference for making investment decisions.
Lock now!
You may also like
Crypto prices
MoreBecome a trader now?A welcome pack worth 6200 USDT for new users!
Sign up now