XRP Enters Historical Window That Has Previously Led To Triple-Digit Rallies
By: Newsbtc
XRP’s weekly chart has entered a technical zone that has repeatedly acted as a turning point in recent years. A recent analysis shared on the social media platform X highlights a recurring relationship between XRP’s price behavior and its 50-week simple moving average, a long-term trend indicator closely watched by traders.
Instead of focusing on XRP’s short-term volatility, which has been bearish, the analysis zeroes in on how extended periods below this moving average have coincided with the end of downside phases and the beginning of rally expansions.
The 50-Week SMA And Why It Matters For XRP Cycles
XRP’s price action on the weekly candlestick chart, which was posted on the social media platform X by Steph, reveals a repeating cycle around the 50-week simple moving average (SMA).
var rnd = window.rnd || Math.floor(Math.random()*10e6); var pid607465 = window.pid607465 || rnd; var plc607465 = window.plc607465 || 0; var abkw = window.abkw || ''; var absrc = 'https://servedbyadbutler.com/adserve/;ID=172179;size=0x0;setID=607465;type=js;sw='+screen.width+';sh='+screen.height+';spr='+window.devicePixelRatio+';kw='+abkw+';pid='+pid607465+';place='+(plc607465++)+';rnd='+rnd+';click=CLICK_MACRO_PLACEHOLDER'; document.write(' ');
if (!window.AdButler){(function(){var s = document.createElement("script"); s.async = true; s.type = "text/javascript";s.src = "https://servedbyadbutler.com/app.js";var n = document.getElementsByTagName("script")[0]; n.parentNode.insertBefore(s, n);}());} var AdButler = AdButler || {}; AdButler.ads = AdButler.ads || []; var abkw = window.abkw || ""; var plc366606 = window.plc366606 || 0; (function(){ var divs = document.querySelectorAll(".plc366606:not([id])"); var div = divs[divs.length-1]; div.id = "placement_366606_"+plc366606; AdButler.ads.push({handler: function(opt){ AdButler.register(172179, 366606, [728,90], "placement_366606_"+opt.place, opt); }, opt: { place: plc366606++, keywords: abkw, domain: "servedbyadbutler.com", click:"CLICK_MACRO_PLACEHOLDER" }}); })();

This analysis is interesting because the 50-week simple moving average functions as a structural divider between bearish compression and bullish continuation on higher timeframes. In XRP’s case, previous cycles show that brief dips below this level have not been as significant as sustained stretches beneath it.
The XRP price chart below tracks how long XRP stayed below the 50-week SMA before a change in momentum. In the first instance in 2017, XRP spent roughly 10 weekly candles, equivalent to about 70 days, under the moving average before staging a sharp upside move.
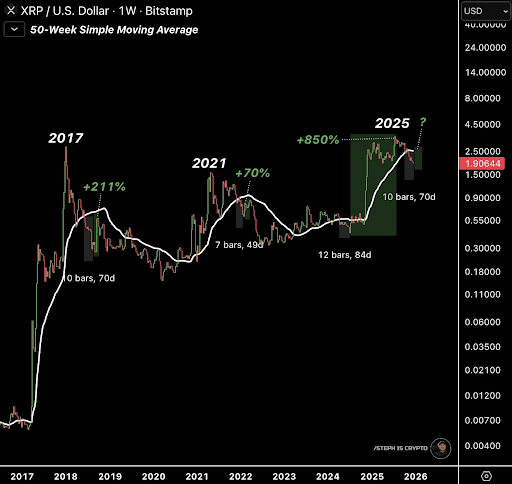 Source: Chart from Steph on X
 A similar pattern appeared in the 2021 cycle, where the duration was shorter, with 49 days, but still acted as an inflection point on the weekly chart. However, the most aggressive move highlighted on the chart came in the 2024 period, where XRP traded below the 50-week SMA for about 84 days before posting a much larger rebound of about +850%.
var rnd = window.rnd || Math.floor(Math.random()*10e6); var pid607472 = window.pid607472 || rnd; var plc607472 = window.plc607472 || 0; var abkw = window.abkw || ''; var absrc = 'https://servedbyadbutler.com/adserve/;ID=172179;size=0x0;setID=607472;type=js;sw='+screen.width+';sh='+screen.height+';spr='+window.devicePixelRatio+';kw='+abkw+';pid='+pid607472+';place='+(plc607472++)+';rnd='+rnd+';click=CLICK_MACRO_PLACEHOLDER'; document.write(' ');
if (!window.AdButler){(function(){var s = document.createElement("script"); s.async = true; s.type = "text/javascript";s.src = "https://servedbyadbutler.com/app.js";var n = document.getElementsByTagName("script")[0]; n.parentNode.insertBefore(s, n);}());} var AdButler = AdButler || {}; AdButler.ads = AdButler.ads || []; var abkw = window.abkw || ""; var plc452518 = window.plc452518 || 0; (function(){ var divs = document.querySelectorAll(".plc452518:not([id])"); var div = divs[divs.length-1]; div.id = "placement_452518_"+plc452518; AdButler.ads.push({handler: function(opt){ AdButler.register(172179, 452518, [728,90], "placement_452518_"+opt.place, opt); }, opt: { place: plc452518++, keywords: abkw, domain: "servedbyadbutler.com", click:"CLICK_MACRO_PLACEHOLDER" }}); })();
XRP Sitting Inside The Same Window Once Again
According to the analysis, XRP is currently approaching about seventy days below the 50-week SMA, placing it squarely within the same historical window observed in prior cycles. Particularly, Steph noted that XRP has now spent roughly 70 days below the 50-week SMA again, and this places an outlook on what to look for in the next price action.

Crypto Analyst Predicts How Low The XRP Price Will Go Before Bouncing
Resulting price action in the past has seen XRP rallying anywhere from 70% in 2021 to 850% in 2024. If XRP resolves to the upside again from the current structure, history suggests the initial signal would be a decisive weekly reclaim of the 50-week SMA, followed by continuation rather than an immediate rejection.
 XRP trading at $1.84 on the 1D chart | Source: XRPUSDT on Tradingview.com
 Featured image from Pngtree, chart from Tradingview.com
var rnd = window.rnd || Math.floor(Math.random()*10e6); var pid607473 = window.pid607473 || rnd; var plc607473 = window.plc607473 || 0; var abkw = window.abkw || ''; var absrc = 'https://servedbyadbutler.com/adserve/;ID=172179;size=0x0;setID=607473;type=js;sw='+screen.width+';sh='+screen.height+';spr='+window.devicePixelRatio+';kw='+abkw+';pid='+pid607473+';place='+(plc607473++)+';rnd='+rnd+';click=CLICK_MACRO_PLACEHOLDER'; document.write(' ');
if (!window.AdButler){(function(){var s = document.createElement("script"); s.async = true; s.type = "text/javascript";s.src = 'https://servedbyadbutler.com/app.js';var n = document.getElementsByTagName("script")[0]; n.parentNode.insertBefore(s, n);}());} var AdButler = AdButler || {}; AdButler.ads = AdButler.ads || []; var abkw = window.abkw || ''; var plc452519 = window.plc452519 || 0; (function(){ var divs = document.querySelectorAll(".plc452519:not([id])"); var div = divs[divs.length-1]; div.id = "placement_452519_"+plc452519; AdButler.ads.push({handler: function(opt){ AdButler.register(172179, 452519, [728,90], 'placement_452519_'+opt.place, opt); }, opt: { place: plc452519++, keywords: abkw, domain: 'servedbyadbutler.com', click:'CLICK_MACRO_PLACEHOLDER' }}); })();
Disclaimer: The content of this article solely reflects the author's opinion and does not represent the platform in any capacity. This article is not intended to serve as a reference for making investment decisions.
Lock now!
You may also like
Crypto prices
MoreBecome a trader now?A welcome pack worth 6200 USDT for new users!
Sign up now