Bitget App
Trade smarter
Buy cryptoMarketsTradeFuturesEarnWeb3SquareMore
Trade
Spot
Buy and sell crypto with ease
Margin
Amplify your capital and maximize fund efficiency
Onchain
Going Onchain, without going Onchain!
Convert
Zero fees, no slippage
Explore
Launchhub
Gain the edge early and start winning
Copy
Copy elite trader with one click
Bots
Simple, fast, and reliable AI trading bot
Trade
USDT-M Futures
Futures settled in USDT
USDC-M Futures
Futures settled in USDC
Coin-M Futures
Futures settled in cryptocurrencies
Explore
Futures guide
A beginner-to-advanced journey in futures trading
Futures promotions
Generous rewards await
Overview
A variety of products to grow your assets
Simple Earn
Deposit and withdraw anytime to earn flexible returns with zero risk
On-chain Earn
Earn profits daily without risking principal
Structured Earn
Robust financial innovation to navigate market swings
VIP and Wealth Management
Premium services for smart wealth management
Loans
Flexible borrowing with high fund security
United States Dollar price

United States Dollar priceUSD

Not listed
$0.{4}1688USD
0.00%1D
The United States Dollar (USD) price in United States Dollar is $0.{4}1688 USD as of 02:18 (UTC) today.
Data is sourced from third-party providers. This page and the information provided do not endorse any specific cryptocurrency. Want to trade listed coins?  Click here
Sign up
United States Dollar price USD live chart (USD/USD)
Last updated as of 2025-10-09 02:18:18(UTC+0)

United States Dollar market Info

Price performance (24h)
24h
24h low $024h high $0
All-time high:
--
Price change (24h):
Price change (7D):
--
Price change (1Y):
--
Market ranking:
--
Market cap:
$168,788.5
Fully diluted market cap:
$168,788.5
Volume (24h):
--
Circulating supply:
10.00B USD
Max supply:
10.00B USD
Total supply:
10.00B USD
Circulation rate:
99%
Contracts:
63qr9x...RbzvRrC(Solana)
Links:
Buy crypto

Live United States Dollar price today in USD

The live United States Dollar price today is $0.{4}1688 USD, with a current market cap of $168,788.5. The United States Dollar price is down by 0.00% in the last 24 hours, and the 24-hour trading volume is $0.00. The USD/USD (United States Dollar to USD) conversion rate is updated in real time.
How much is 1 United States Dollar worth in United States Dollar?
As of now, the United States Dollar (USD) price in United States Dollar is valued at $0.{4}1688 USD. You can buy 1USD for $0.{4}1688 now, you can buy 592,456.51 USD for $10 now. In the last 24 hours, the highest USD to USD price is -- USD, and the lowest USD to USD price is -- USD.
AI analysis
Today's hot spots in the crypto market

Der Kryptomarkt erlebt am 7. Oktober 2025 einen regelrechten Aufschwung, der von Bitcoin-Höchstständen, starker Altcoin-Performance und einer sich entwickelnden Regulierungslandschaft geprägt ist. Insgesamt zeigt sich eine optimistische Marktstimmung, genährt durch institutionelles Interesse und strategische Entwicklungen in verschiedenen Segmenten des digitalen Vermögensmarktes.

Bitcoin überwindet Allzeithochs und befeuert den 'Uptober'

Bitcoin (BTC) hat in den letzten Tagen eine beeindruckende Rallye hingelegt und am 7. Oktober 2025 erstmals die Marke von 126.000 US-Dollar überschritten, nachdem es kurzzeitig über 125.000 US-Dollar notierte und intraday um 3% stieg. [11, 22, 28] Diese Entwicklung befeuert die Stimmung im Markt, der traditionell den Oktober als "Uptober" bezeichnet, eine Zeit, in der Bitcoin historisch starke monatliche Zuwächse verzeichnet hat. [24] Die Kryptowährung wurde durch das spekulative Interesse von Optionshändlern angeheizt, die auf einen weiteren Anstieg in Richtung 140.000 US-Dollar wetten. [11] Analysten sehen das Potenzial für Bitcoin, im Oktober die Marke von 130.000 US-Dollar zu erreichen, wobei die Preisspanne für den Monat zwischen 114.000 und 127.500 US-Dollar prognostiziert wird. [31, 24] Makroökonomische Faktoren, wie die schwachen US-Arbeitsmarktdaten, haben die Hoffnung auf eine Zinssenkung geschürt, was tendenziell risikoreiche Anlagen wie Bitcoin begünstigt. [24] Die US-Regierungsstilllegung trug ebenfalls dazu bei, dass Investoren alternative Anlagen suchten, wobei Bitcoin als sicherer Hafen galt und einen Aufwärtstrend erlebte. [30]

Ethereum zieht institutionelles Interesse und Wal-Aktivitäten an

Auch Ethereum (ETH) zeigt am heutigen Tag bemerkenswerte Stärke, wobei der Preis die Marke von 4.569 US-Dollar erreicht hat und nur noch 8,5% von seinem Allzeithoch von 4.956 US-Dollar entfernt ist. [9] Wal-Aktivitäten sind signifikant, da On-Chain-Daten über 72 Millionen US-Dollar an kombinierten Zuflüssen auf verschiedenen Handelsplattformen zeigen. [13] Ein Wal zahlte beispielsweise 33 Millionen US-Dollar in USDC ein, um 7.311 ETH zu kaufen, während ein anderer 8.695 ETH im Wert von 39,5 Millionen US-Dollar von Binance abzog, was ein starkes institutionelles Vertrauen in die Widerstandsfähigkeit von Ethereum signalisiert. [13] Grayscale hat kürzlich Staking-ETPs für Ethereum und Solana eingeführt, was die institutionelle Akzeptanz weiter fördert. [19] Darüber hinaus gab BitMine Immersion bekannt, über 2,83 Millionen ETH zu halten, womit das Unternehmen eine der größten Ethereum-Bestände unter börsennotierten Unternehmen vorweist. [20]

Altcoin-Saison in voller Blüte

Der Oktober wird als "Altcoin-Saison" bezeichnet, eine Periode, in der Altcoins Bitcoin in Bezug auf die Preisentwicklung übertreffen. [2, 10] Aktuell sinkt die Bitcoin-Dominanz, was darauf hindeutet, dass Kapital in Altcoins fließt. [2] Indikatoren wie der Altcoin Season Index, der über 75 liegt, signalisieren ebenfalls den Beginn einer potenziellen Altcoin-Saison. [2] Verschiedene Altcoins zeigen bullische Setups und signifikante Gewinne. Solana (SOL) hat wichtige Unterstützungsniveaus zurückerobert und handelt um 231 US-Dollar. [3, 19] SUI nähert sich einem bullischen Ausbruch, während Zcash (ZEC) bereits langfristige Widerstände durchbrochen hat. [3] Auch Cardano (ADA) zeigt neue Stärke und hat einen Ausbruch über die kritische Nachfrageniveau von 0,80 US-Dollar erlebt. [6] Projekte wie Mutuum Finance (MUTM) gewinnen in ihren Presales an Fahrt, und andere Altcoins wie Aster (ASTER) und OKB stehen kurz davor, ihre Allzeithochs zu erreichen. [6, 9] Darüber hinaus verzeichneten Solana, Base und Sui erhebliche Zuwächse im dezentralen Austausch (DEX)-Handelsvolumen. [18]

Globale Regulierungsentwicklungen gestalten den Markt neu

Die Regulierungslandschaft im Kryptobereich entwickelt sich global rasch weiter. Die Europäische Union plant eine bedeutende Verschiebung in der Krypto-Regulierung, indem die Aufsicht von einzelnen Ländern auf eine einzige EU-weite Behörde, die Europäische Wertpapier- und Marktaufsichtsbehörde (ESMA), übertragen werden soll. [4] Die EU-Aufsichtsbehörden haben Verbraucher vor den Risiken und dem begrenzten Schutz bestimmter Krypto-Assets gewarnt, während die MiCA-Verordnung (Markets in Crypto-Assets) im Dezember 2024 vollständig in Kraft trat. [14] In den USA hat die SEC den Weg für Investmentberater zur Verwahrung von Krypto-Assets bei staatlich konzessionierten Treuhandgesellschaften erleichtert und DePIN-Token (Dezentrale Physische Infrastrukturnetzwerke) in einem "No-Action Letter" als nicht-Wertpapiere eingestuft, was als wichtiger Schritt für die Web3-Infrastruktur gilt. [7] Wisconsin erwägt einen Gesetzentwurf, der bestimmte digitale Asset-Aktivitäten von den Lizenzanforderungen für Geldübermittler ausnehmen würde, und Massachusetts prüft einen Vorschlag zur Einrichtung einer Bitcoin-Reserve. [7]

Ausblick auf kommende Ereignisse und Marktstimmung

Die Marktstimmung bleibt volatil, beeinflusst durch bevorstehende wirtschaftliche Ankündigungen. Die Veröffentlichung der FOMC-Sitzungsprotokolle am 8. Oktober und eine Rede von Jerome Powell am 9. Oktober könnten die US-Geldpolitik und somit den Kryptomarkt beeinflussen. [5] Auch Inflationsdaten, wie der CPI am 15. Oktober und der PPI am 16. Oktober, werden mit Spannung erwartet. [5] Neben diesen makroökonomischen Ereignissen finden im Oktober 2025 weltweit mehrere große Bitcoin-Konferenzen statt, darunter "Watch Out, Bitcoin! 2025" in Madrid und "TABConf" in Atlanta, die sich mit Regulierung, institutioneller Adoption und Blockchain-Entwicklung befassen. [23] Binance veranstaltet am 7. Oktober ein "Red Packet Event" mit Krypto-Quizzen und Belohnungen. [12, 21] Die südkoreanische Krypto-Börse Bithumb plant zudem einen Nasdaq-Börsengang vor der zweiten Hälfte des Jahres 2025. [18] Angesichts des anhaltenden institutionellen Interesses und der vielversprechenden technischen Indikatoren bleibt der Kryptomarkt ein Hotspot für Anleger und Entwickler weltweit.

Show more

Do you think the price of United States Dollar will rise or fall today?

Total votes:
Rise
0
Fall
0
Voting data updates every 24 hours. It reflects community predictions on United States Dollar's price trend and should not be considered investment advice.
The following information is included:United States Dollar price prediction, United States Dollar project introduction, development history, and more. Keep reading to gain a deeper understanding of United States Dollar.

United States Dollar price prediction

What will the price of USD be in 2026?

Based on USD's historical price performance prediction model, the price of USD is projected to reach $0.00 in 2026.

What will the price of USD be in 2031?

In 2031, the USD price is expected to change by +23.00%. By the end of 2031, the USD price is projected to reach $0.00, with a cumulative ROI of -100.00%.

About United States Dollar (USD)

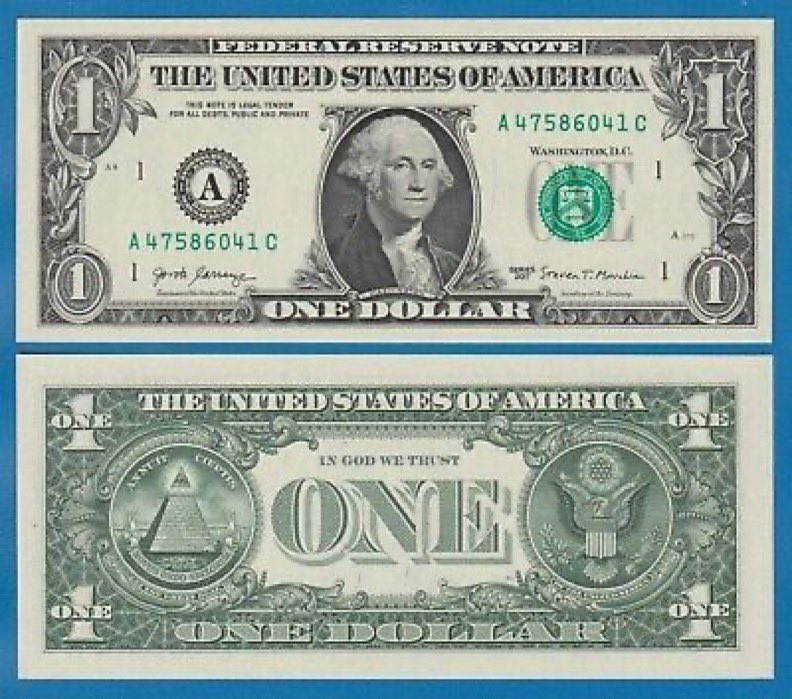
USD (United States Dollar) is a new meme coin that originated with the one-dollar bill meme and a parody account imitating Powell. The visual is the greenback and the portrait of Washington. The core gameplay is to use the fiat currency symbol as a meme. The community has short-term speculation, and the on-chain transactions and market capitalization are relatively small and volatile (even seen fluctuations of thousands of% and hundreds of holders). Some people are shouting "go for the moon" in the lively discussion, while others worry that this is a typical pump-and-dump or a tool for cutting leeks. It has a strong sense of story and is suitable for onlookers and secondary creation, but the speculative risk is significant.
Show more

Bitget Insights

Crypto_navigator
Crypto_navigator
2025/09/28 06:11
Decoding $BLESS: A Deep Dive into Market Structure & K-Line Technicals
​$BLESS entered the market with the compelling narrative of a DePIN play for edge computing, positioning itself as the token powering a network that aggregates idle CPU/GPU from everyday devices to offer decentralized compute. This vision of cheaper, distributed compute for AI and Web3 has garnered significant attention, though early trading has been marked by extreme volatility. Currently, the token is fluctuating in the low-single cents with substantial daily turnover, indicating both speculative interest and robust liquidity. CoinMarketCap and CoinGecko generally align on live price and market statistics, showing prices around $0.03–$0.05, a circulating supply of approximately 1.84 billion, and daily volumes in the tens of millions. ​At its core, $BLESS , developed by TX Labs, aspires to be a global decentralized edge compute layer. Node operators contribute their device cycles to the network and are rewarded accordingly. The tokenomics are designed to foster utility-driven demand, incorporating a buyback and burn mechanism that reportedly funnels a significant portion of application revenues back into token purchases. This deflationary design presents a strong fundamental bullish case, contingent on usage scaling: real compute demand directly translates to revenue, which in turn fuels token burns, leading to scarcity. Numerous ecosystem write-ups and launch reports consistently highlight this revenue allocation strategy and the TIME token mechanism for node rewards. ​Since its listing, $BLESS has experienced dramatic price movements, including an initial surge past $0.10 followed by sharp retracements. After this early speculative frenzy, the price has consolidated into a tighter range. Key support is identified near $0.030–$0.033, while immediate resistance bands are observed around $0.034–$0.0368. A more substantial resistance zone lies between $0.059–$0.065, a level that would signify a return to earlier bullish momentum. The market cap remains in the low-tens of millions, with exact figures varying across trackers. Critically, the Vol / MktCap ratio is high, suggesting that the market is still driven by liquidity and speculative trading rather than gradual, organic accumulation. ​For a detailed K-line (candlestick) analysis, we turn to TradingView listings, which provide live charts and technical summaries for BLESS pairs (USDT/USD/USDC) across multiple timeframes: 15-minute, 4-hour, and daily. On the 15-minute chart, price action reveals repeated probes down to the $0.030–$0.031 zone, consistently met with quick recoveries, characterized by short wicks and rapid bounces. This indicates active short-term buying at support and substantial intraday liquidity at the lower end of the range. Frequent small-body candles with tails, such as spinning tops or pin bars, suggest market indecision alongside defensive buying at the lows. Successful breakout attempts would be confirmed by large green 15-minute bodies accompanied by significant volume spikes. The intraday bias leans neutral-to-bullish as long as the price sustains above $0.030 and continues to form higher lows. ​Shifting to the 4-hour chart for a swing and tactical view, a more constructive higher-low structure is evident. Recent swing lows are incrementally higher, indicating that the price is coiling into a tighter range and establishing a short-term ascending bias. The 21-period Exponential Moving Average (EMA) on the 4-hour chart has flattened and begun a shallow upward slope, often an early indicator that shorter-term momentum is attempting to reverse. TradingView's market pages and on-chart volume display occasional 4-hour candles with volume exceeding 2–3 times the EMA average. These "whale" or liquidity-event candles frequently precede rapid directional moves when confirmed by subsequent candlestick action. A clear bullish activation signal would be a 4-hour close above $0.038 on high volume. The price is currently forming a rectangular coil between approximately $0.030 and $0.038; a decisive 4-hour breakout, either above or below this range, will determine the next swing direction. ​From a daily perspective, which offers a view of the overall trend and market regime, the K-line illustrates a wide early range post-listing, characterized by a spike to its all-time high followed by a deep retracement, now transitioning into consolidation—a classic pattern of post-listing volatility evolving into price compression. The daily moving averages remain dynamic, and until the price secures consistent daily closes above established resistance bands, the overall trend cannot be definitively labeled as bullish. Key daily triggers include a sustained daily close above the $0.045–$0.06 cluster, which would signal renewed regime strength. Conversely, daily closes below $0.030 with increasing volume would likely initiate a deeper corrective phase, potentially pushing the price back towards lower support zones around $0.02. Market participants should treat daily closes as higher-probability confirmations. Actionable candlestick cues include bullish confirmation via a 4-hour or daily bull body engulfing prior consolidation on volume expansion (at least double the recent average), serving as an ideal add zone. A warning sign for a bull trap would be volume-light green candles breaking resistance but failing to close above it, a common occurrence in meme or early tokens, always requiring volume follow-through. Bearish confirmation would be a 4-hour or daily close below $0.030 with increasing volume, signaling an appropriate time to exit or reduce exposure. ​Contextual on-chain and flow signals provide further insights. Reports from whale trackers and market analysts have highlighted large transfers and active deposit patterns into exchanges preceding significant intraday moves. These activities suggest that whales are either positioning themselves or preparing liquidity for larger trades. When combined with the volume surges observed on TradingView charts, these flows can either presage short squeezes or indicate imminent sell pressure if executed as dumps. Traders should actively track exchange inflows through whale trackers like Arkham or Nansen alongside chart volume for comprehensive confirmation. ​In synthesis, this analysis provides actionable insights for various types of traders and holders. Short-term traders will find the 4-hour timeframe most conducive for tactical entries, suggesting buying bounces near $0.030 with tight stop-losses, or awaiting a volume-confirmed 4-hour breakout above $0.038. It is crucial to respect intraday volume signals to avoid potential traps. Swing or position traders are advised to consider layered entries and strategic profit-taking near the $0.05–$0.07 cluster, unless their conviction is rooted in long-term adoption metrics such as mainnet usage, node growth, and verifiable revenue burns. Long-term backers should prioritize monitoring these adoption metrics and the transparency of revenue/burn mechanisms, acknowledging that price volatility may persist regardless of fundamentals until real usage scales and buybacks become demonstrably verifiable. ​In conclusion, $BLESS presents a compelling fusion of a strong narrative—decentralized edge compute—with tokenomics designed for powerful impact if genuine demand materializes. The K-line story on TradingView clearly illustrates a market in a state of coil: higher lows on the 4-hour chart, robust short-term support around $0.030, and distinct volume-driven triggers that will ultimately dictate the next significant move. The current range should be approached as a critical decision box. Vigilance towards volume, decisive 4-hour and daily closes, and on-chain flows will be paramount in distinguishing a genuine breakout from mere speculative hype author:Crypto_navigtor
USDC+0.01%
BLESS+7.76%
CryptoChase
CryptoChase
2025/09/17 22:37
#GBPUSD 🎯 We caught the perfect top on GBP/USD today during the FOMC meeting. Cutting the rates typically causes the $DXY to decrease. In this scenario, right down into a double bottom [Range lows], hitting extreme discount. General rule: "Never trade the 1st move" Using this as a confluence, I took the risk for DXY to go back up shortly after the quick fall. I've already taken a profit and SL2BE, and now I'm letting the rest of the position run.
MOVE-0.90%
QUICK-1.57%
K A L E O |
K A L E O |
2025/09/17 21:02
$SUI / USD chart also looks ready to explode
LOOKS-0.22%
SUI-1.15%
Bpay-News
Bpay-News
2025/09/17 19:39
Plasma Partners with Rain Cards to Launch Cryptocurrency Payment Card, Allowing Spending of Plasma USD₮ at 150 Million Merchants Worldwide

USD/USD price calculator

USD
USD
1 USD = 0.{4}1688 USD. The current price of converting 1 United States Dollar (USD) to USD is 0.{4}1688. Rate is for reference only. Updated just now.
Bitget offers the lowest transaction fees among all major trading platforms. The higher your VIP level, the more favorable the rates.

USD resources

United States Dollar ratings
4.6
100 ratings
Contracts:
63qr9x...RbzvRrC(Solana)
Links:

What can you do with cryptos like United States Dollar (USD)?

Deposit easily and withdraw quicklyBuy to grow, sell to profitTrade spot for arbitrageTrade futures for high risk and high returnEarn passive income with stable interest ratesTransfer assets with your Web3 wallet

How do I buy United States Dollar?

Learn how to get your first United States Dollar in minutes.
See the tutorial

How do I sell United States Dollar?

Learn how to cash out your United States Dollar in minutes.
See the tutorial

What is United States Dollar and how does United States Dollar work?

United States Dollar is a popular cryptocurrency. As a peer-to-peer decentralized currency, anyone can store, send, and receive United States Dollar without the need for centralized authority like banks, financial institutions, or other intermediaries.
See more

Global United States Dollar prices

How much is United States Dollar worth right now in other currencies? Last updated: 2025-10-09 02:18:18(UTC+0)

Buy more

FAQ

What is the current price of United States Dollar?

The live price of United States Dollar is $0 per (USD/USD) with a current market cap of $168,788.5 USD. United States Dollar's value undergoes frequent fluctuations due to the continuous 24/7 activity in the crypto market. United States Dollar's current price in real-time and its historical data is available on Bitget.

What is the 24 hour trading volume of United States Dollar?

Over the last 24 hours, the trading volume of United States Dollar is $0.00.

What is the all-time high of United States Dollar?

The all-time high of United States Dollar is --. This all-time high is highest price for United States Dollar since it was launched.

Can I buy United States Dollar on Bitget?

Yes, United States Dollar is currently available on Bitget’s centralized exchange. For more detailed instructions, check out our helpful How to buy united-states-dollar guide.

Can I get a steady income from investing in United States Dollar?

Of course, Bitget provides a strategic trading platform, with intelligent trading bots to automate your trades and earn profits.

Where can I buy United States Dollar with the lowest fee?

Bitget offers industry-leading trading fees and depth to ensure profitable investments for traders. You can trade on the Bitget exchange.

Hot promotions

Where can I buy crypto?

Buy crypto on the Bitget app
Sign up within minutes to purchase crypto via credit card or bank transfer.
Download Bitget APP on Google PlayDownload Bitget APP on AppStore
Trade on Bitget
Deposit your cryptocurrencies to Bitget and enjoy high liquidity and low trading fees.

Video section — quick verification, quick trading

play cover
How to complete identity verification on Bitget and protect yourself from fraud
1. Log in to your Bitget account.
2. If you're new to Bitget, watch our tutorial on how to create an account.
3. Hover over your profile icon, click on “Unverified”, and hit “Verify”.
4. Choose your issuing country or region and ID type, and follow the instructions.
5. Select “Mobile Verification” or “PC” based on your preference.
6. Enter your details, submit a copy of your ID, and take a selfie.
7. Submit your application, and voila, you've completed identity verification!
Buy United States Dollar for 1 USD
A welcome pack worth 6200 USDT for new Bitget users!
Buy United States Dollar now
Cryptocurrency investments, including buying United States Dollar online via Bitget, are subject to market risk. Bitget provides easy and convenient ways for you to buy United States Dollar, and we try our best to fully inform our users about each cryptocurrency we offer on the exchange. However, we are not responsible for the results that may arise from your United States Dollar purchase. This page and any information included are not an endorsement of any particular cryptocurrency. Any price and other information on this page is collected from the public internet and can not be consider as an offer from Bitget.