
Ethereum Risks Slide To $2,000 If December Closes Below This Level: Analyst

By:Newsbtc
A cryptocurrency analyst has explained where Ethereum could go next based on a long-term Parallel Channel forming in its monthly price chart.
Ethereum Has Been Trading Inside A Parallel Channel For The Last Few Years
In a new post on X, analyst Ali Martinez has talked about a long-term pattern that Ethereum has appeared to have been following for the last few years. The pattern in question is a “Parallel Channel” from technical analysis (TA), which forms whenever an asset’s price trades between two parallel trendlines.

The upper level of a Parallel Channel is likely to facilitate top formations in the asset, while the lower one can act as a support boundary and allow the price to remain above it.
var rnd = window.rnd || Math.floor(Math.random()*10e6); var pid607465 = window.pid607465 || rnd; var plc607465 = window.plc607465 || 0; var abkw = window.abkw || ''; var absrc = 'https://servedbyadbutler.com/adserve/;ID=172179;size=0x0;setID=607465;type=js;sw='+screen.width+';sh='+screen.height+';spr='+window.devicePixelRatio+';kw='+abkw+';pid='+pid607465+';place='+(plc607465++)+';rnd='+rnd+';click=CLICK_MACRO_PLACEHOLDER'; document.write('
');
if (!window.AdButler){(function(){var s = document.createElement("script"); s.async = true; s.type = "text/javascript";s.src = "https://servedbyadbutler.com/app.js";var n = document.getElementsByTagName("script")[0]; n.parentNode.insertBefore(s, n);}());}
var AdButler = AdButler || {}; AdButler.ads = AdButler.ads || []; var abkw = window.abkw || ""; var plc366606 = window.plc366606 || 0; (function(){ var divs = document.querySelectorAll(".plc366606:not([id])"); var div = divs[divs.length-1]; div.id = "placement_366606_"+plc366606; AdButler.ads.push({handler: function(opt){ AdButler.register(172179, 366606, [728,90], "placement_366606_"+opt.place, opt); }, opt: { place: plc366606++, keywords: abkw, domain: "servedbyadbutler.com", click:"CLICK_MACRO_PLACEHOLDER" }}); })();
Parallel Channels can be of a few different types depending on how the lines are oriented with respect to the graph axes. If the channel has some slope, it falls into either the Ascending or Descending categories. Naturally, it’s the former when the lines are angled upward and latter when they are downward.
In the context of the current topic, the simplest type of Parallel Channel is of relevance: a channel that has zero slope. That is, a pattern with lines that are parallel to the time-axis. As an asset trades inside such a channel, it experiences consolidation in an exactly sideways manner.
If one of the levels of the pattern break, a sustained continuation of trend may occur in that direction. This means that a surge above the resistance can be a bullish signal, while a fall under support a bearish one.
var rnd = window.rnd || Math.floor(Math.random()*10e6); var pid607472 = window.pid607472 || rnd; var plc607472 = window.plc607472 || 0; var abkw = window.abkw || ''; var absrc = 'https://servedbyadbutler.com/adserve/;ID=172179;size=0x0;setID=607472;type=js;sw='+screen.width+';sh='+screen.height+';spr='+window.devicePixelRatio+';kw='+abkw+';pid='+pid607472+';place='+(plc607472++)+';rnd='+rnd+';click=CLICK_MACRO_PLACEHOLDER'; document.write('
');
if (!window.AdButler){(function(){var s = document.createElement("script"); s.async = true; s.type = "text/javascript";s.src = "https://servedbyadbutler.com/app.js";var n = document.getElementsByTagName("script")[0]; n.parentNode.insertBefore(s, n);}());}
var AdButler = AdButler || {}; AdButler.ads = AdButler.ads || []; var abkw = window.abkw || ""; var plc452518 = window.plc452518 || 0; (function(){ var divs = document.querySelectorAll(".plc452518:not([id])"); var div = divs[divs.length-1]; div.id = "placement_452518_"+plc452518; AdButler.ads.push({handler: function(opt){ AdButler.register(172179, 452518, [728,90], "placement_452518_"+opt.place, opt); }, opt: { place: plc452518++, keywords: abkw, domain: "servedbyadbutler.com", click:"CLICK_MACRO_PLACEHOLDER" }}); })();
Now, here is the chart shared by Martinez that shows the Parallel Channel that the monthly price of Ethereum has been trading inside for the last few years:
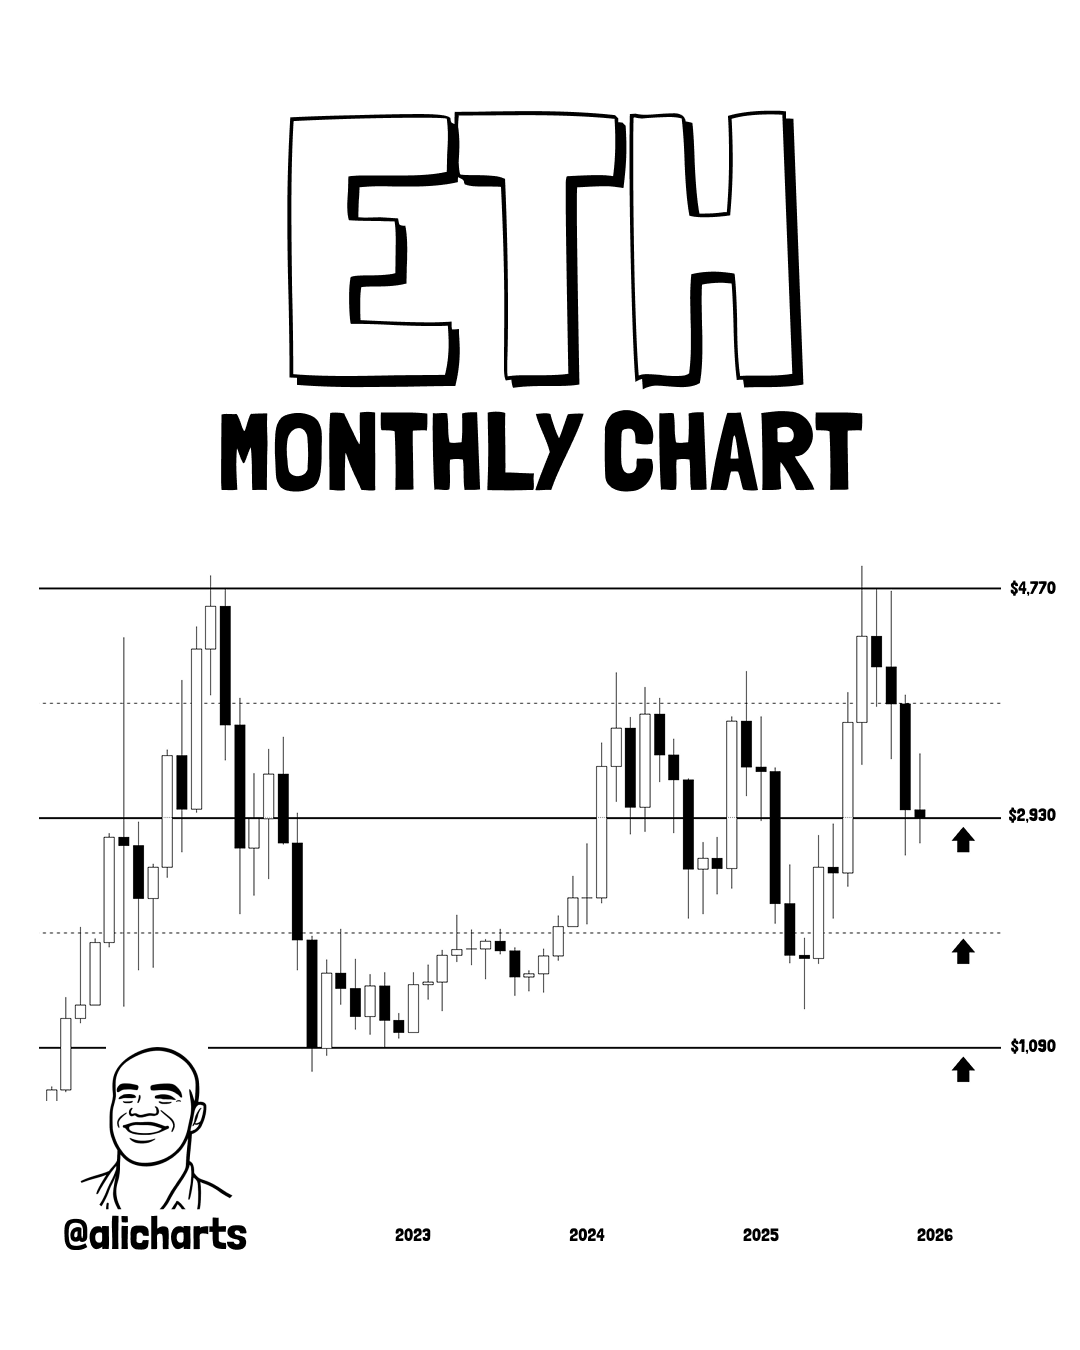 The price of the coin seems have been trading at the midway point of the channel in recent days | Source:
@ali_charts on X
The price of the coin seems have been trading at the midway point of the channel in recent days | Source:
@ali_charts on X
As displayed in the above graph, the recent bearish wave in Ethereum has meant that its 1-month price has retraced to the midway line of the Parallel Channel located at $2,930.
Martinez has noted that if ETH closes December below this level, a decline to lower levels could occur. The next potential support is situated at $2,000, corresponding to the 25% mark of the Parallel Channel. The cryptocurrency found support around this line in the starting months of 2025.
var rnd = window.rnd || Math.floor(Math.random()*10e6); var pid607473 = window.pid607473 || rnd; var plc607473 = window.plc607473 || 0; var abkw = window.abkw || ''; var absrc = 'https://servedbyadbutler.com/adserve/;ID=172179;size=0x0;setID=607473;type=js;sw='+screen.width+';sh='+screen.height+';spr='+window.devicePixelRatio+';kw='+abkw+';pid='+pid607473+';place='+(plc607473++)+';rnd='+rnd+';click=CLICK_MACRO_PLACEHOLDER'; document.write('
');
if (!window.AdButler){(function(){var s = document.createElement("script"); s.async = true; s.type = "text/javascript";s.src = 'https://servedbyadbutler.com/app.js';var n = document.getElementsByTagName("script")[0]; n.parentNode.insertBefore(s, n);}());}
var AdButler = AdButler || {}; AdButler.ads = AdButler.ads || []; var abkw = window.abkw || ''; var plc452519 = window.plc452519 || 0; (function(){ var divs = document.querySelectorAll(".plc452519:not([id])"); var div = divs[divs.length-1]; div.id = "placement_452519_"+plc452519; AdButler.ads.push({handler: function(opt){ AdButler.register(172179, 452519, [728,90], 'placement_452519_'+opt.place, opt); }, opt: { place: plc452519++, keywords: abkw, domain: 'servedbyadbutler.com', click:'CLICK_MACRO_PLACEHOLDER' }}); })();
In the scenario that this level also fails, Ethereum may be looking at a fall to the bottom line of the Parallel Channel at $1,090. The asset last retested it back in 2022 and successfully found support.

Chainlink’s Top Whales Reverse Course, Quietly Scoop Up $263M In LINK
It now remains to be seen how ETH will close out the month and whether one of the next two levels of the pattern will come into play.
ETH Price
At the time of writing, Ethereum is floating around $2,860, down over 15% in the last seven days.
 The trend in the price of the coin over the last five days | Source:
ETHUSDT on TradingView
The trend in the price of the coin over the last five days | Source:
ETHUSDT on TradingView
0
0
Disclaimer: The content of this article solely reflects the author's opinion and does not represent the platform in any capacity. This article is not intended to serve as a reference for making investment decisions.
PoolX: Earn new token airdrops
Lock your assets and earn 10%+ APR
Lock now!
You may also like
Shiba Inu Price Update: SHIB Faces $0.057754 Resistance as Volatility Remains Limited
Cryptonewsland•2025/12/18 16:33
Likely Next Fed Chair Speaks After Today’s US Inflation Report: “Interest Rate Cuts…”
BitcoinSistemi•2025/12/18 16:30
Why the Bank of Japan’s 25 Bps Hike Could Trigger a Crypto Sell-Off
CoinEdition•2025/12/18 16:30
SBI Boost XRP RWA Tokenisatie - Stijgt Ripple Naar $20 In 2026?
Newsbtc•2025/12/18 16:21

Trending news
MoreCrypto prices
MoreBitcoin
BTC
$88,062.78
+2.15%
Ethereum
ETH
$2,934.17
+3.31%
Tether USDt
USDT
$0.9994
-0.05%
BNB
BNB
$845.12
+0.25%
XRP
XRP
$1.91
+1.23%
USDC
USDC
$0.9999
+0.02%
Solana
SOL
$126.45
+0.85%
TRON
TRX
$0.2812
+0.86%
Dogecoin
DOGE
$0.1286
+1.44%
Cardano
ADA
$0.3709
-0.71%
How to buy BTC
Bitget lists BTC – Buy or sell BTC quickly on Bitget!
Trade now
Become a trader now?A welcome pack worth 6200 USDT for new users!
Sign up now