
Dogecoin RSI Hits Levels That Have Triggered ATH Rallies Before

By:Newsbtc
Dogecoin’s weekly price chart is revealing an interesting event of an important momentum indicator hitting a level that has always been a major turning point for the cryptocurrency. After spending the past several weeks falling lower into the $0.13 price region, Dogecoin’s Relative Strength Index on the weekly timeframe has reached levels that have only appeared a handful of times over the asset’s entire trading history. The observation, first highlighted by crypto analyst Cryptollica, revisits how Dogecoin has behaved the last few times this technical condition happened.
A Rare Weekly RSI Signal In Dogecoin’s History
Technical analysis indicates that Dogecoin’s weekly Relative Strength Index has dropped into a narrow zone around the 33 level, a condition that has appeared only four times over roughly eleven years of trading history. Each of those occasions aligned with periods where selling pressure had largely run its course, even though price action itself did not immediately reverse. Instead, these phases were marked by quiet accumulation.

The Dogecoin chart highlights these moments clearly, with pronounced RSI dips into the lower band during 2015, 2020, and 2022. In each case, price followed a similar script: extended basing ranges formed after the RSI reached this level, laying the groundwork for the next sustained advance. Now in late 2025, Dogecoin’s RSI is again exhibiting this same structural behavior, and this places the current price action in a way that might play out bullish.
var rnd = window.rnd || Math.floor(Math.random()*10e6); var pid607465 = window.pid607465 || rnd; var plc607465 = window.plc607465 || 0; var abkw = window.abkw || ''; var absrc = 'https://servedbyadbutler.com/adserve/;ID=172179;size=0x0;setID=607465;type=js;sw='+screen.width+';sh='+screen.height+';spr='+window.devicePixelRatio+';kw='+abkw+';pid='+pid607465+';place='+(plc607465++)+';rnd='+rnd+';click=CLICK_MACRO_PLACEHOLDER'; document.write('
');
if (!window.AdButler){(function(){var s = document.createElement("script"); s.async = true; s.type = "text/javascript";s.src = "https://servedbyadbutler.com/app.js";var n = document.getElementsByTagName("script")[0]; n.parentNode.insertBefore(s, n);}());}
var AdButler = AdButler || {}; AdButler.ads = AdButler.ads || []; var abkw = window.abkw || ""; var plc366606 = window.plc366606 || 0; (function(){ var divs = document.querySelectorAll(".plc366606:not([id])"); var div = divs[divs.length-1]; div.id = "placement_366606_"+plc366606; AdButler.ads.push({handler: function(opt){ AdButler.register(172179, 366606, [728,90], "placement_366606_"+opt.place, opt); }, opt: { place: plc366606++, keywords: abkw, domain: "servedbyadbutler.com", click:"CLICK_MACRO_PLACEHOLDER" }}); })();
Short-term oversold readings are relatively common as reversal indicators, but they often produce false starts. However, since this is on the weekly timeframe, this specific setup tends to emerge only during broader market resets and is much more reliable. During those resets, the RSI stabilized and rebounded from the 30 to 33 zone as price gradually transitioned from consolidation into a new uptrend.
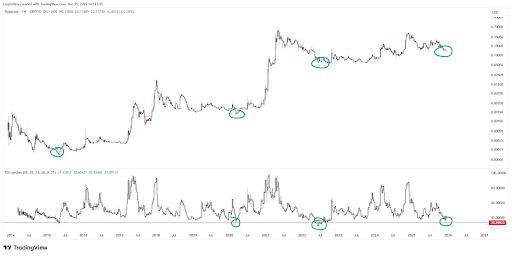
Dogecoin Price Chart. Source: @Cryptollica On X
var rnd = window.rnd || Math.floor(Math.random()*10e6); var pid607472 = window.pid607472 || rnd; var plc607472 = window.plc607472 || 0; var abkw = window.abkw || ''; var absrc = 'https://servedbyadbutler.com/adserve/;ID=172179;size=0x0;setID=607472;type=js;sw='+screen.width+';sh='+screen.height+';spr='+window.devicePixelRatio+';kw='+abkw+';pid='+pid607472+';place='+(plc607472++)+';rnd='+rnd+';click=CLICK_MACRO_PLACEHOLDER'; document.write('
');
if (!window.AdButler){(function(){var s = document.createElement("script"); s.async = true; s.type = "text/javascript";s.src = "https://servedbyadbutler.com/app.js";var n = document.getElementsByTagName("script")[0]; n.parentNode.insertBefore(s, n);}());}
var AdButler = AdButler || {}; AdButler.ads = AdButler.ads || []; var abkw = window.abkw || ""; var plc452518 = window.plc452518 || 0; (function(){ var divs = document.querySelectorAll(".plc452518:not([id])"); var div = divs[divs.length-1]; div.id = "placement_452518_"+plc452518; AdButler.ads.push({handler: function(opt){ AdButler.register(172179, 452518, [728,90], "placement_452518_"+opt.place, opt); }, opt: { place: plc452518++, keywords: abkw, domain: "servedbyadbutler.com", click:"CLICK_MACRO_PLACEHOLDER" }}); })();
What The Current RSI Setup Could Mean Going Forward
As of mid-December 2025, Dogecoin is trading in the low-$0.13 to mid-$0.14 range, having slipped back below $0.14 that had been acting as short-term support in recent weeks. This price area has been volatile, with moves between roughly $0.13 and about $0.15, reflecting an ongoing struggle between buyers and sellers and a lack of decisive bullish momentum. The sellers are winning right now, with Dogecoin trading at $0.13, down by 5% in the past 24 hours and about to lose this price level.

Silk Road Bitcoins Are On The Move Again, Is The BTC Price Ready For Another Dump?
Nonetheless, the weekly RSI that’s currently at the usually significant zone adds additional context. It proposes a scenario where Dogecoin is about to reach a price bottom and buyers regain control in the coming weeks. However, considering that this is a weekly indicator, Dogecoin’s price action might continue to consolidate around this level for the next few weeks before any meaningful bounce takes place.
 DOGE price loses steam | Source:
DOGEUSDT on Tradingview.com
DOGE price loses steam | Source:
DOGEUSDT on Tradingview.com
Featured image created with Dall.E, chart from Tradingview.com
var rnd = window.rnd || Math.floor(Math.random()*10e6); var pid607473 = window.pid607473 || rnd; var plc607473 = window.plc607473 || 0; var abkw = window.abkw || ''; var absrc = 'https://servedbyadbutler.com/adserve/;ID=172179;size=0x0;setID=607473;type=js;sw='+screen.width+';sh='+screen.height+';spr='+window.devicePixelRatio+';kw='+abkw+';pid='+pid607473+';place='+(plc607473++)+';rnd='+rnd+';click=CLICK_MACRO_PLACEHOLDER'; document.write('
');
if (!window.AdButler){(function(){var s = document.createElement("script"); s.async = true; s.type = "text/javascript";s.src = 'https://servedbyadbutler.com/app.js';var n = document.getElementsByTagName("script")[0]; n.parentNode.insertBefore(s, n);}());}
var AdButler = AdButler || {}; AdButler.ads = AdButler.ads || []; var abkw = window.abkw || ''; var plc452519 = window.plc452519 || 0; (function(){ var divs = document.querySelectorAll(".plc452519:not([id])"); var div = divs[divs.length-1]; div.id = "placement_452519_"+plc452519; AdButler.ads.push({handler: function(opt){ AdButler.register(172179, 452519, [728,90], 'placement_452519_'+opt.place, opt); }, opt: { place: plc452519++, keywords: abkw, domain: 'servedbyadbutler.com', click:'CLICK_MACRO_PLACEHOLDER' }}); })();
0
0
Disclaimer: The content of this article solely reflects the author's opinion and does not represent the platform in any capacity. This article is not intended to serve as a reference for making investment decisions.
PoolX: Earn new token airdrops
Lock your assets and earn 10%+ APR
Lock now!
You may also like
Solana Koers Verwachting Vandaag. Herstel Na Langdurige Daling
Newsbtc•2025/12/16 16:21


Canadian peer-to-Peer clothing rental company Rax is expanding to the U.S.
TechCrunch•2025/12/16 16:18
Critical Bitcoin (Btc) Data Affecting The 14 Largest Banks In The Us Has Arrived! “First They Opposed It, Then…”
BitcoinSistemi•2025/12/16 16:15
Trending news
MoreCrypto prices
MoreBitcoin
BTC
$87,870.62
+0.86%
Ethereum
ETH
$2,948.15
-2.14%
Tether USDt
USDT
$0.9998
-0.02%
BNB
BNB
$873.29
+1.80%
XRP
XRP
$1.93
+0.19%
USDC
USDC
$1.0000
+0.01%
Solana
SOL
$128.85
+1.80%
TRON
TRX
$0.2816
+0.29%
Dogecoin
DOGE
$0.1322
+0.89%
Cardano
ADA
$0.3883
+0.49%
How to buy BTC
Bitget lists BTC – Buy or sell BTC quickly on Bitget!
Trade now
Become a trader now?A welcome pack worth 6200 USDT for new users!
Sign up now