Date: Mon, Dec 15, 2025 | 05:10 AM GMT
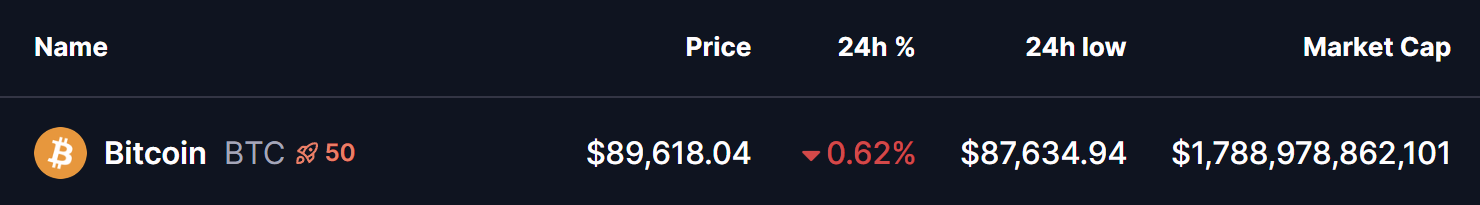
The cryptocurrency market is attempting to stabilize after weekend volatility dragged Bitcoin (BTC) down to a low of $87,634 before buyers stepped in. Over the past 24 hours, BTC has rebounded above the $89,600 mark, signaling early signs of recovery.
Although Bitcoin is still trading slightly in the red, its technical structure is beginning to flash a potentially powerful bullish signal that suggests a larger directional move may be developing beneath the surface.
 Source: Coinmarketcap
Power of 3 Pattern in Play
On the 3-hour chart, Bitcoin appears to be forming a classic “Power of 3” pattern — a setup commonly associated with smart money behavior. This structure unfolds in three distinct phases: accumulation, manipulation, and expansion, often preceding a strong directional breakout once the market traps late participants.
Accumulation Phase
For several sessions, BTC traded within a well-defined range between resistance near $93,603 and support around $89,578. This sideways movement marked the accumulation phase, where price volatility compressed and liquidity built up. During this period, buyers and sellers remained relatively balanced as positions were quietly established while price respected the range boundaries.
Manipulation Phase
The recent wave of market volatility triggered a sharp downside move, briefly pushing BTC below the $89,578 support level. This breakdown sent price to a local low near $87,585, as highlighted on the chart. Such moves are typical in Power of 3 structures and often serve as a stop-hunt, flushing out weak hands before a potential reversal takes place.
Importantly, this dip was short-lived, with buyers quickly absorbing sell pressure near the lows.
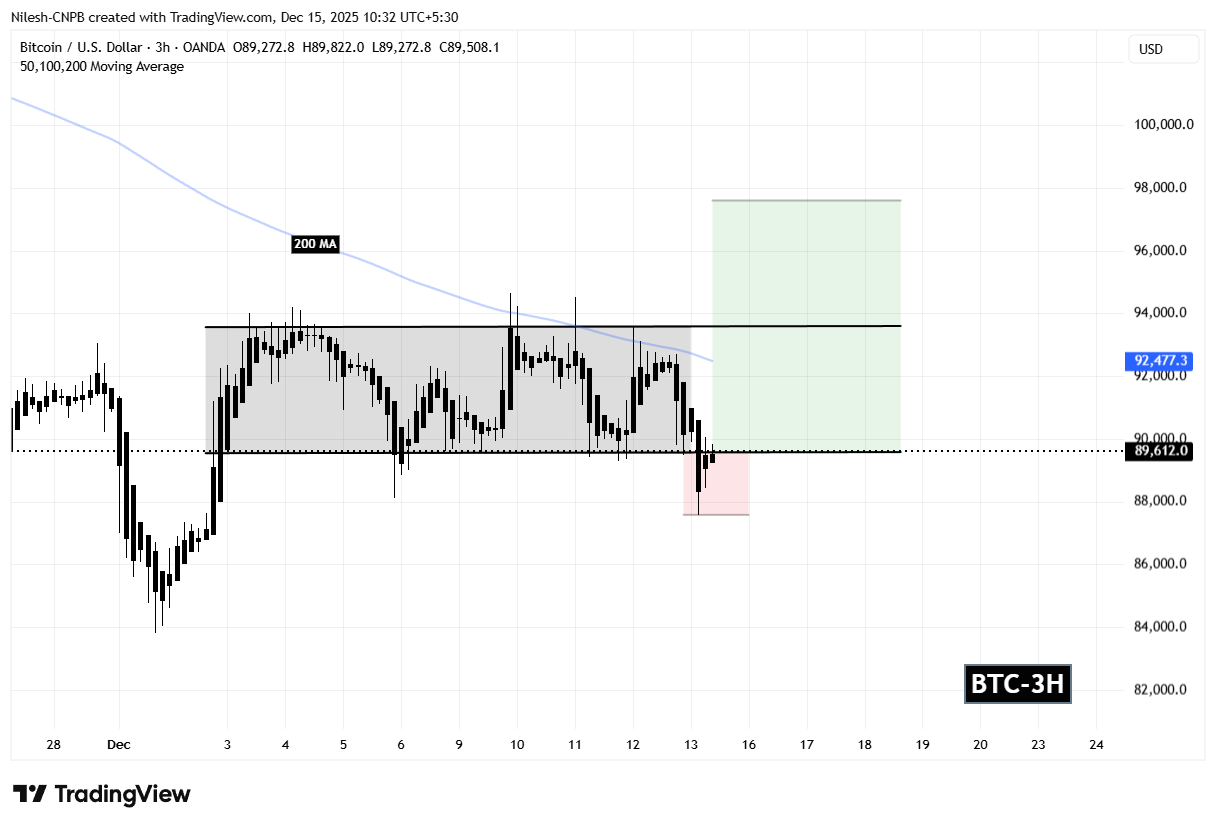 Bitcoin (BTC) 3H Chart/Coinsprobe (Source: Tradingview)
Expansion Phase Incoming?
Following the sweep of liquidity below support, BTC has started to rebound and is now attempting to reclaim the $87,585 zone as a stable base. This recovery attempt suggests that the expansion phase of the pattern may be starting to unfold, as buying interest gradually returns and price begins to stabilize above the manipulation low.
The presence of strong reaction from this zone increases the probability that the downside move was corrective rather than the start of a broader breakdown.
What’s Next for BTC?
If buyers manage to hold price within the highlighted green zone and continue building support, the immediate hurdle lies at the 200-hour moving average, positioned near $92,477. This level has acted as dynamic resistance and remains a key confirmation point for bulls. A sustained close above the 200 MA could strengthen bullish momentum and open the path toward $93,603, the upper boundary of the prior accumulation range.
Should BTC reclaim this resistance zone with conviction, the Power of 3 projection suggests a potential upside target near $97,628, calculated by extending the height of the accumulation range from the breakout level.
On the downside, failure to hold above the reclaimed support area could delay or invalidate the bullish expansion scenario, keeping Bitcoin locked in a broader consolidation phase for longer.
For now, Bitcoin stands at a technically important junction, with the coming sessions likely to determine whether this recovery attempt evolves into a sustained upside move.