Bitcoin Builds Short-Term Strength — $95,000 Now the Level That Matters

Bitcoin is up almost 2% in the past 24 hours and is holding steady above $92,200. The daily chart still looks slow, but the 4-hour chart shows early strength building. Since short-term charts capture shifts faster, the next few sessions may decide whether Bitcoin finally tests $95,000 — a level experts believe is crucial to
Bitcoin is up almost 2% in the past 24 hours and is holding steady above $92,200. The daily chart still looks slow, but the 4-hour chart shows early strength building.
Since short-term charts capture shifts faster, the next few sessions may decide whether Bitcoin finally tests $95,000 — a level experts believe is crucial to the BTC price ascent.
Short-Term Strength Builds, but Not Without Risk
Bitcoin is close to forming a bullish EMA crossover on the 4-hour chart. EMA means exponential moving average. It gives more weight to recent prices, so traders use it to spot early trend changes. A bullish crossover occurs when the faster EMA rises above the slower EMA, indicating increasing buying momentum. Currently, the 50-EMA is on the verge of crossing above the 100-EMA.
The gap between the two EMAs has tightened sharply. If the crossover completes, Bitcoin gets a cleaner path toward $95,700, a key resistance. But Bull Bear Power, which shows who controls each candle, has weakened. If it slips again, the crossover may not complete. That is the main short-term risk here.
 Bullish BTC Chart:
TradingView
Bullish BTC Chart:
TradingView
Want more token insights like this? Sign up for Editor Harsh Notariya’s Daily Crypto Newsletter here.
This is also where outside commentary lines up with the chart. Analysts at the all-in-one crypto ecosystem for business B2BINPAY mentioned something similar in an exclusive bit to BeInCrypto:
“Bitcoin is trading in the $92,000–$93,000 level, yet all the attempts to break $95,000 are in vain. It lacks drivers to do it with confidence.
…If that happens, we may see Bitcoin attempting $96k. If the market manages to consolidate above this area, the next step could be a move toward $100k,” they added.
This supports the idea that $95,000 is the real barrier and that short-term strength must hold for long-term gains, even above $100,000 to surface.
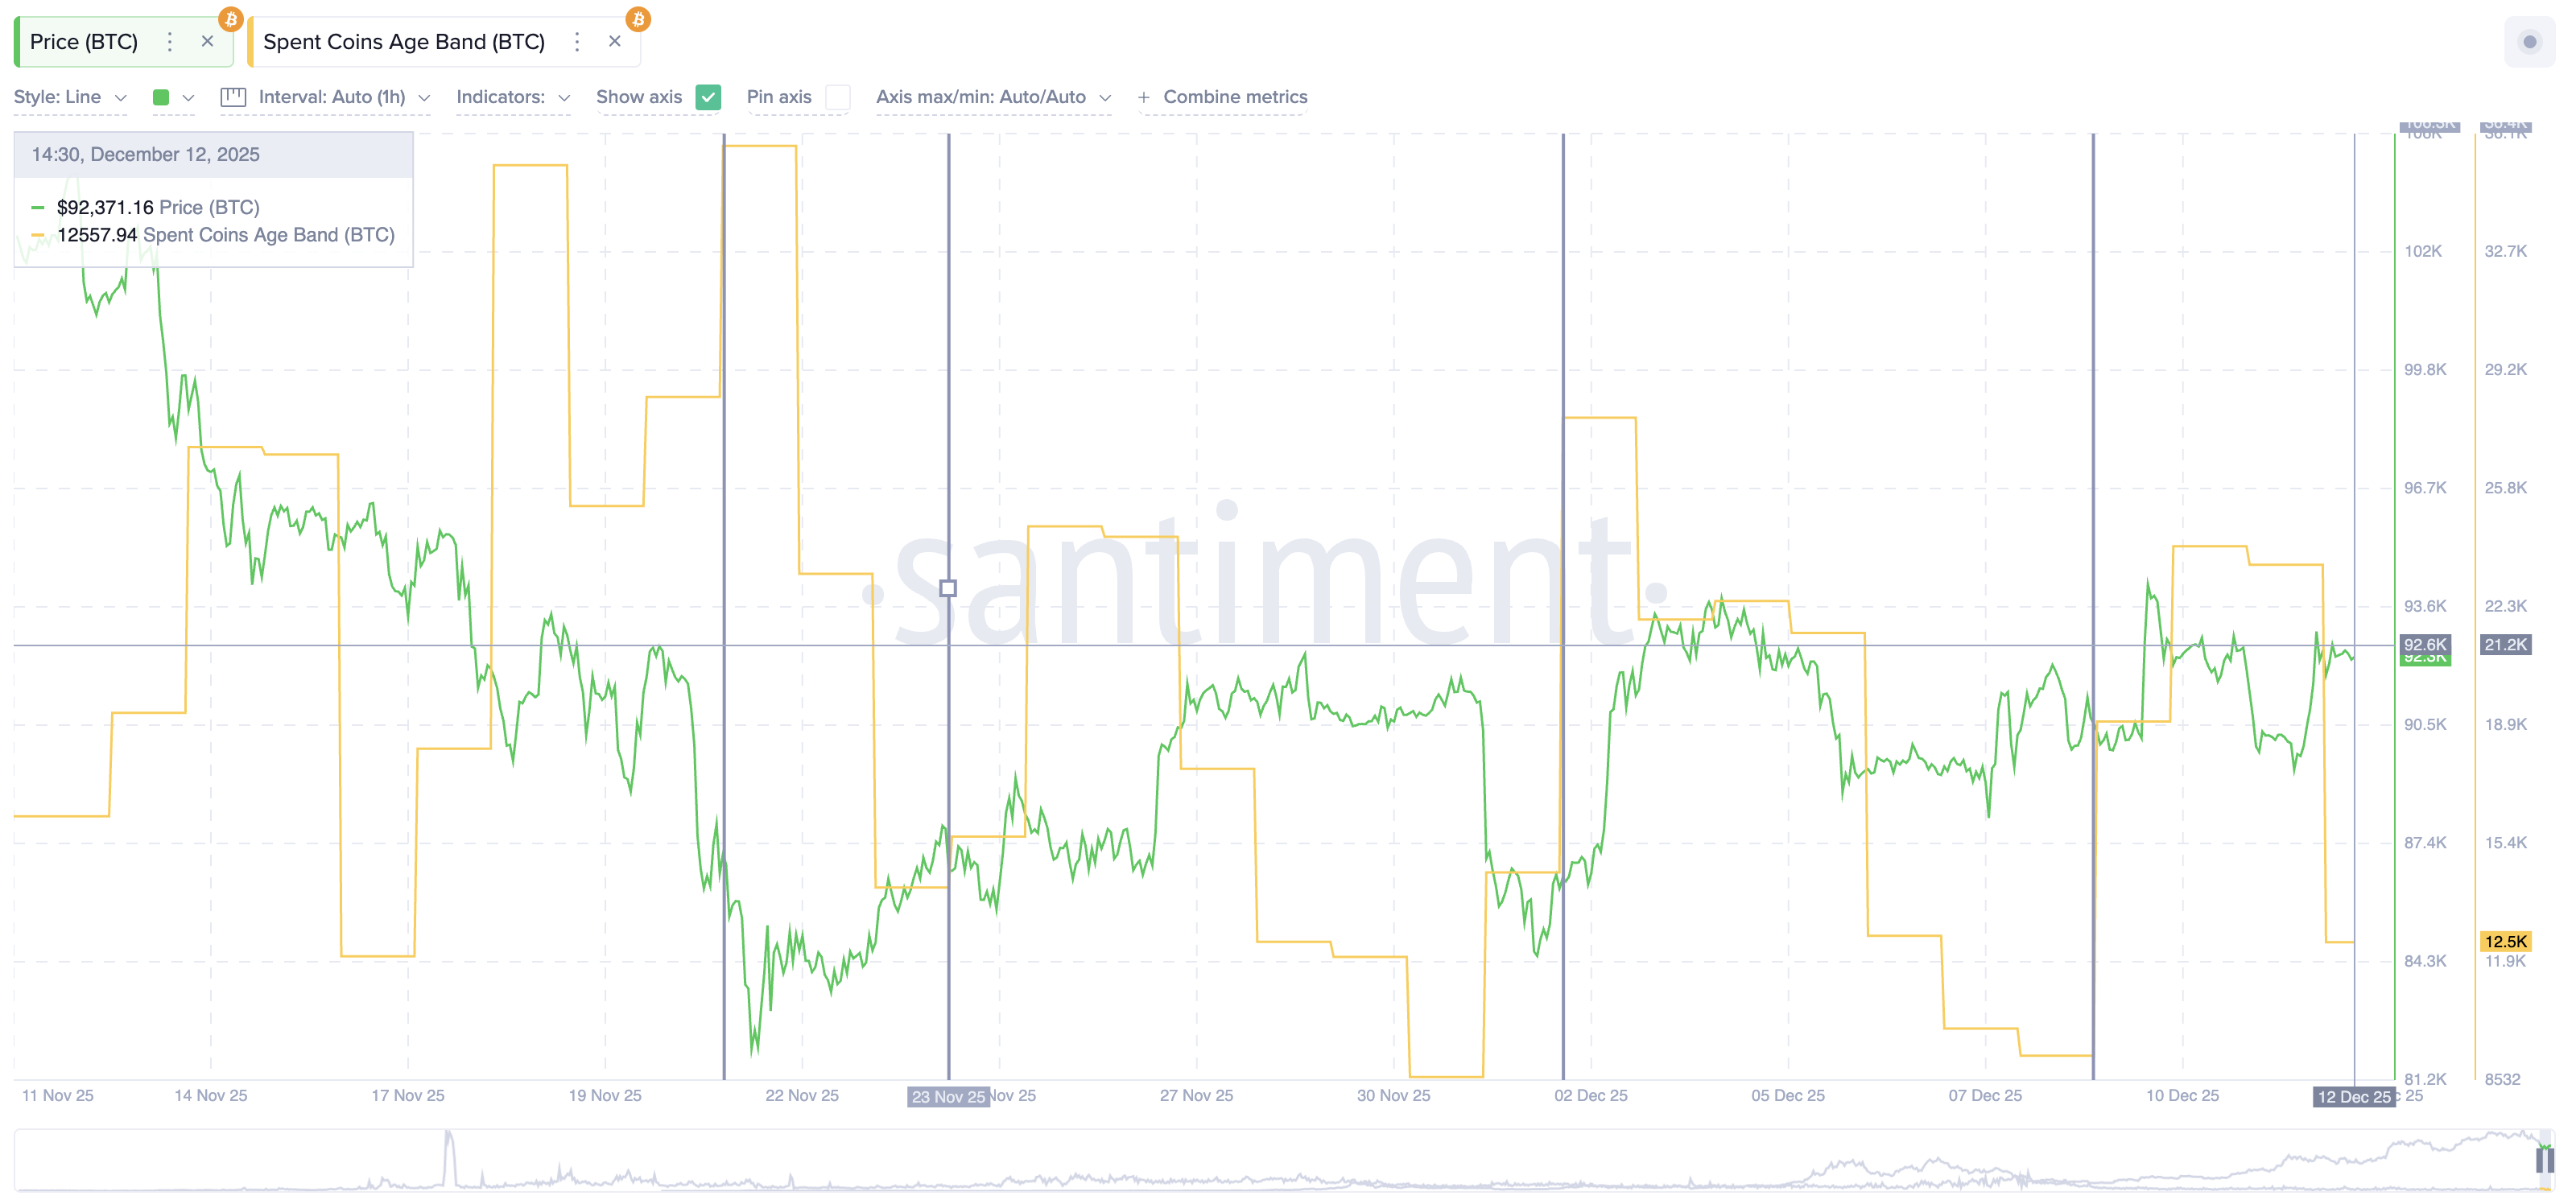
Dormancy Rises, and That Could Be the Trigger
Spent Coins Age Band measures how many coins move across holder groups. When the number drops, older coins stay inactive (higher dormancy). That reduces selling pressure and often aligns with rebounds.
The metric has fallen from 24,100 on December 10 to 12,500 today, almost a 50% drop. Similar drops triggered rallies before.
From December 2 to December 9, spent coins fell from 27,800 to 9,200. Bitcoin then climbed around 5%.
 Spent Coins Dropping Again:
Santiment
Spent Coins Dropping Again:
Santiment
Between November 21 and November 24, spent coins dropped. Bitcoin rose from $85,500 to $92,300, an 8% move, over the next few days.
The current drop is smaller, but the pattern is the same. Dormancy rising (spent coins dropping) at the same time the crossover tries to form can be an important combination on a short-term chart.
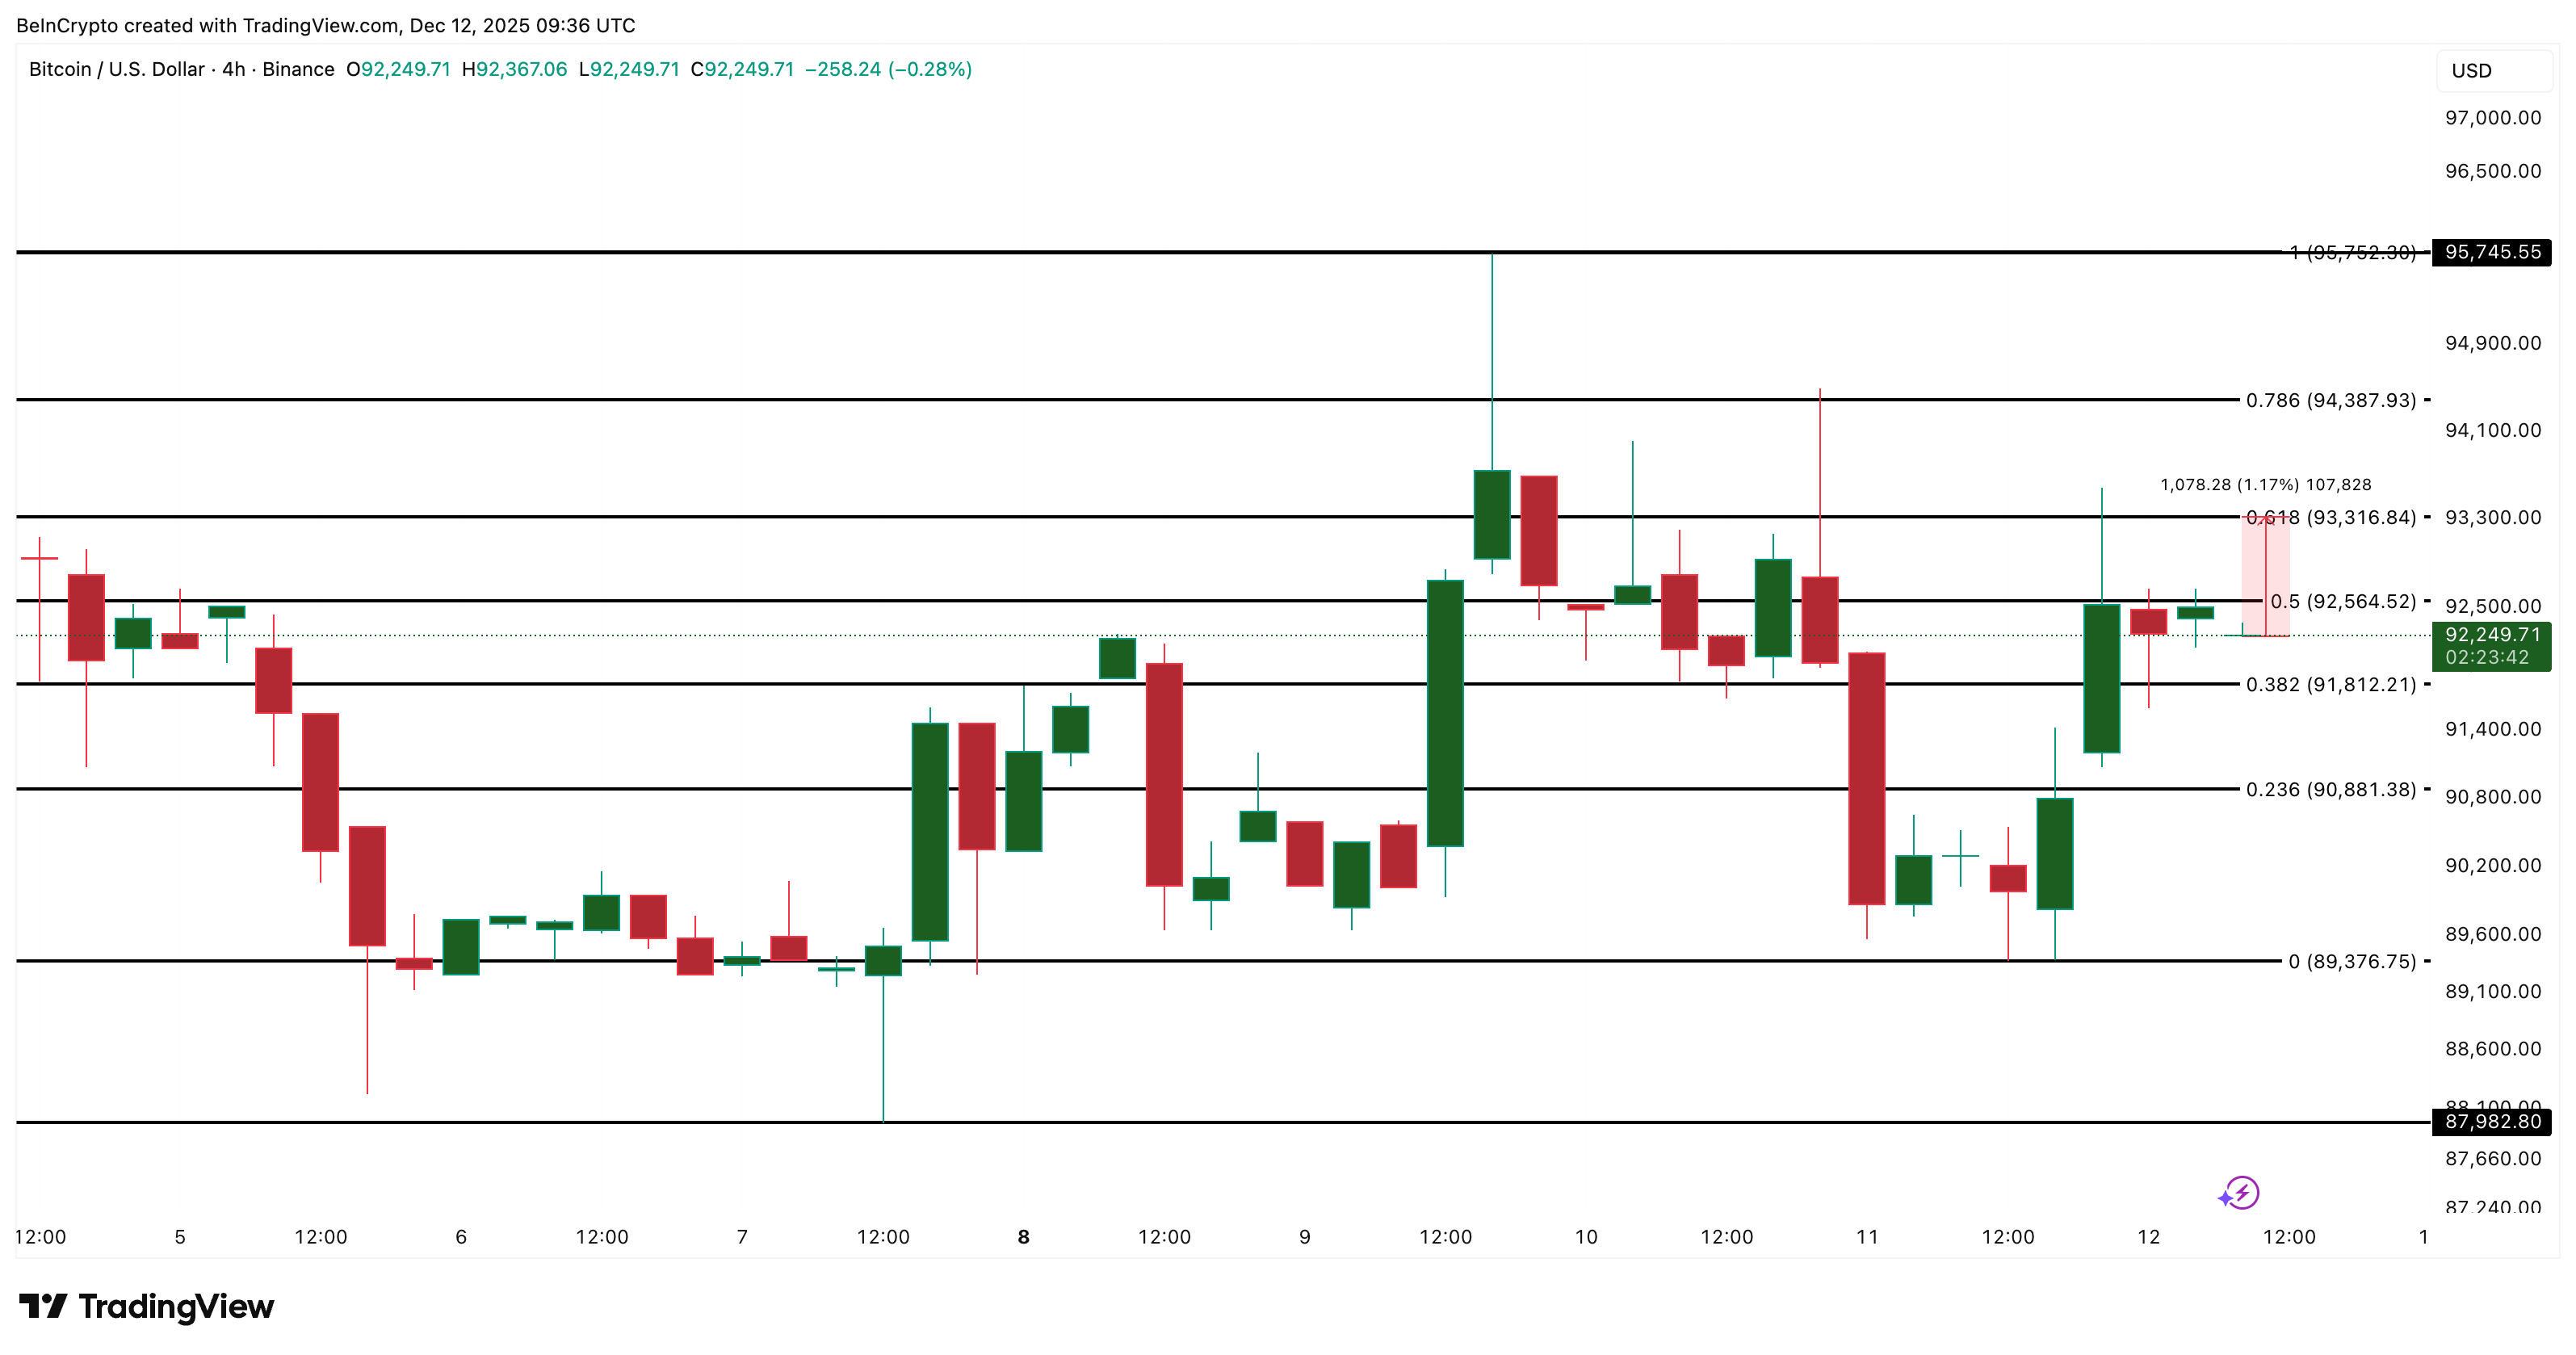
Short-Term Bitcoin Price Levels to Watch This Week
The first hurdle on the short-term Bitcoin price chart is $93,300. Bitcoin has not closed a 4-hour candle above this level since December 9. A clean move over it opens the path to $94,300.
If the EMA crossover completes and momentum stays strong, $95,700 becomes reachable. This is the line that decides whether Bitcoin can aim for the areas analysts mentioned.
 Bitcoin Price Analysis:
TradingView
Bitcoin Price Analysis:
TradingView
Support sits at $90,800. A drop below it brings $89,300 back into view and delays any attempt at $95,000.
Right now, Bitcoin has three aligned elements: a possible EMA crossover, falling spent-coin activity, and price pushing near resistance. If buyers defend support and the metric trends continue, Bitcoin may finally get a chance to test $95,000 ($95,700 to be precise).
Read the article at BeInCryptoDisclaimer: The content of this article solely reflects the author's opinion and does not represent the platform in any capacity. This article is not intended to serve as a reference for making investment decisions.
You may also like
India’s Spinny set to secure $160 million in funding for GoMechanic acquisition, sources report
PENGU Price Forecast: Managing Immediate Market Fluctuations and Exploring Future AI Opportunities
- PENGU token's price fell to $0.01114 in Nov 2025, far below its 2024 peak of $0.068, amid regulatory and macroeconomic risks. - Short-term volatility is amplified by SEC ETF delays, $7.68M short positions, and susceptibility to broader crypto market downturns. - Long-term potential emerges through AI-driven features like dynamic staking and cross-chain interoperability, plus Schleich's physical collectible partnerships. - Pudgy Penguins' hybrid digital-physical model, including Walmart retail presence, d

The Rise of Dynamic Clean Energy Markets
- CleanTrade, CFTC-approved as a Swap Execution Facility (SEF), transformed clean energy markets into institutional-grade assets by standardizing VPPAs, PPAs, and RECs. - The platform addressed fragmented pricing and opaque risks, enabling $16B in transactions within two months and bridging renewable assets with institutional capital. - Institutional investors now use CleanTrade’s tools to hedge fossil fuel volatility and lock in renewable energy prices, mirroring traditional energy strategies. - Global cl

COAI Token Fraud: Insights for Cryptocurrency Investors During Times of Regulatory Ambiguity
- COAI token's 88% collapse in late 2025 exposed systemic risks in AI-driven DeFi ecosystems, with $116.8M investor losses. - Governance flaws included 87.9% token concentration in ten wallets, untested AI stablecoins, and lack of open-source audits. - Panic selling accelerated by AI-generated misinformation and CEO resignation, amid conflicting global crypto regulations. - Lessons emphasize scrutinizing token distribution, demanding transparent audits, and avoiding jurisdictions with regulatory ambiguity.