
Most Bitcoin On-Chain Indicators Signal a New Bear Market Cycle

Bitcoin’s rebound has done little to shift on-chain metrics, which now point to an emerging bearish cycle. The data contradicts recent bullish predictions from Tom Lee and Arthur Hayes, highlighting weakening network activity, liquidity, and momentum.
Bitcoin continues to trade near $92,000 after this week’s rebound, yet a growing cluster of on-chain indicators now suggests the market has already slipped into a bearish cycle.
This stands in sharp contrast to recent predictions from market leaders like Tom Lee and Arthur Hayes, who argue Bitcoin could still close the year significantly higher.
Bullish Predictions Clash With Data
Lee recently softened his earlier $250,000 target and now expects Bitcoin to remain above $100,000 into year-end.
Meanwhile, Arthur Hayes maintains a much more aggressive view, calling the recent dip to the low $80,000s a cycle bottom and forecasting a potential move toward $200,000–$250,000.
However, the current market structure does not align with either scenario.
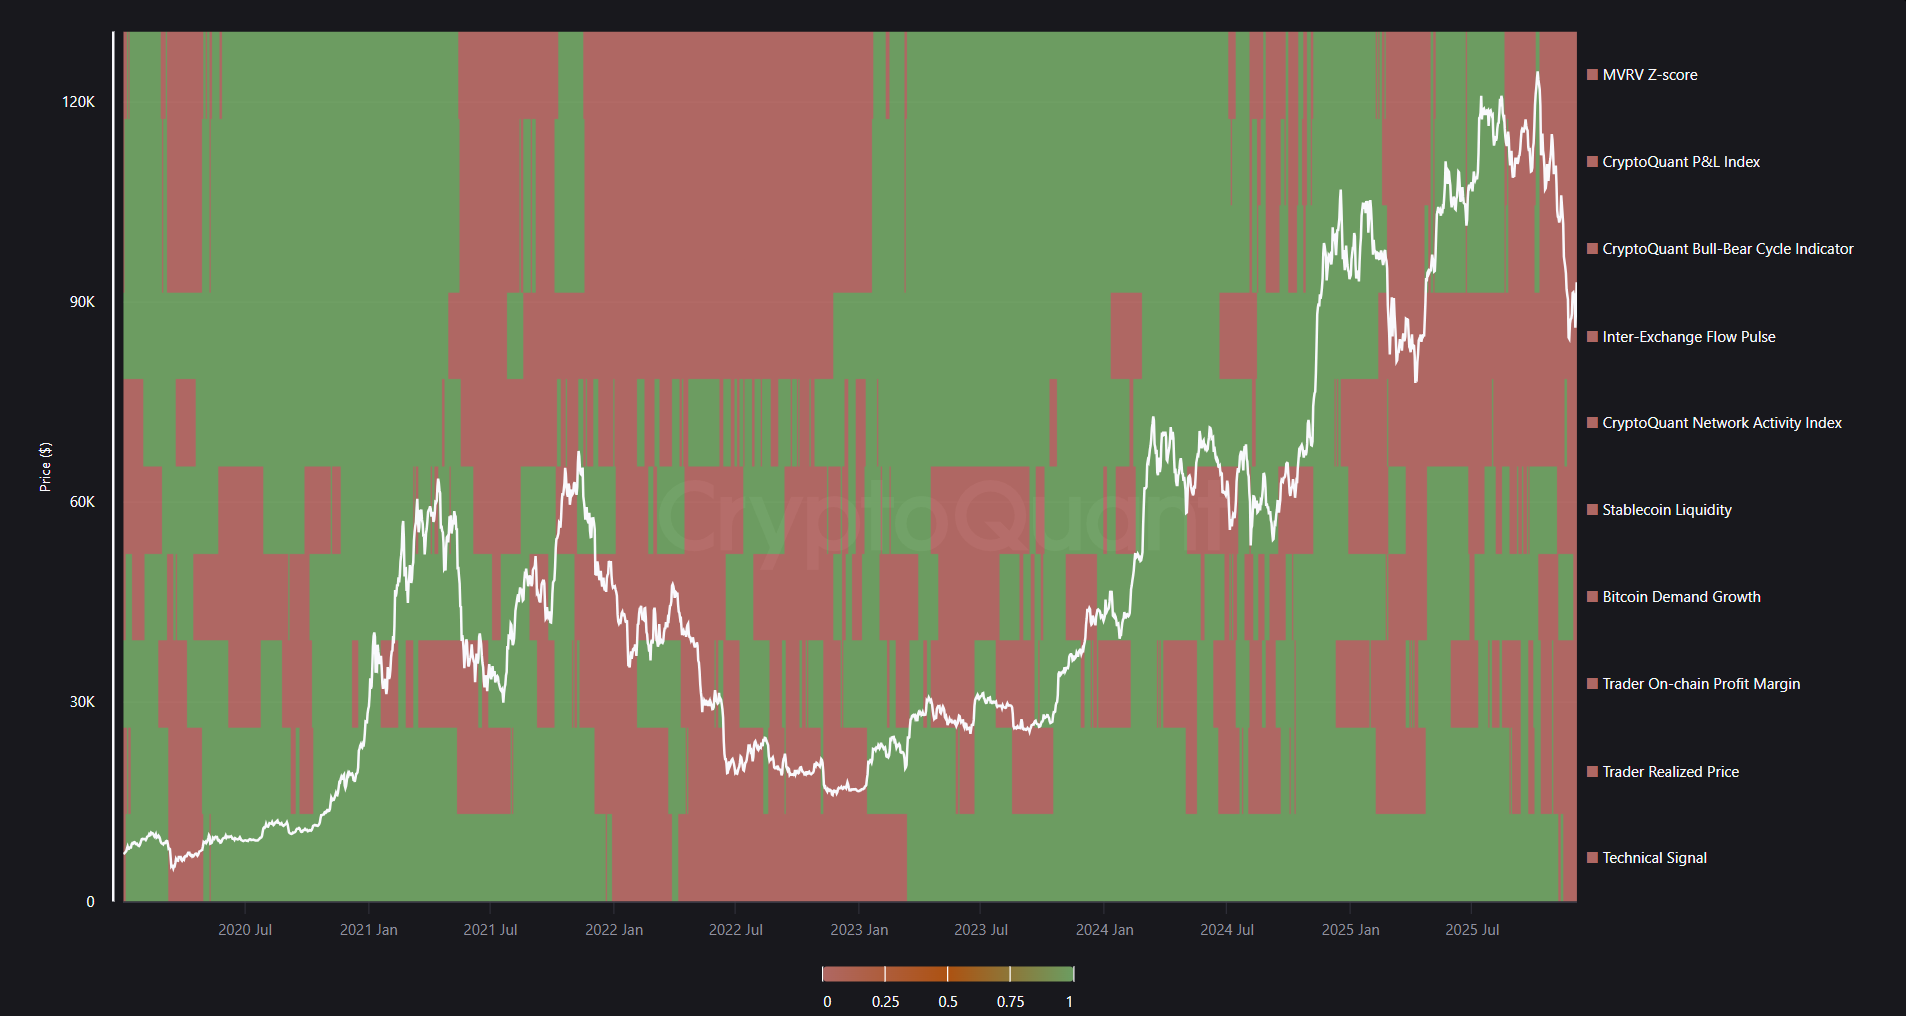
CryptoQuant’s Bull Score Signals composite shows why. During previous bull phases, including late 2023 and early 2025, the model displayed broad green conditions across valuation, demand growth, network activity, and stablecoin liquidity.
Since mid-2025, these components have turned consistently red. MVRV Z-score has flipped into overheated territory, network activity has weakened, and stablecoin buying power has declined.
 Bitcoin Bull Score Signals. Source:
CryptoQuant
Bitcoin Bull Score Signals. Source:
CryptoQuant
The pattern resembles the early stages of the 2022 downturn rather than a continuation of the 2025 rally.
Also, the Bull Score Index, offers a more granular view. Bitcoin spent the first half of 2025 in bullish territory with readings above 60.
By late August, the score began falling sharply, dropping below 40 in October and remaining flat through November despite short-term price volatility.
The latest reading sits in the 20–30 range, deep within bearish conditions. The bounce from last week’s lows has done little to shift the underlying cycle signals.
 Bitcoin Bull Score Index
Another, the Bull Score mapped to price, reinforces this view. The model has transitioned from green “extra bullish” signals earlier this year to persistent red “bearish” and “extra bearish” readings across September, October, and November.
Even the recent recovery toward $92,000 is categorized as a bearish-zone rally, mirroring distribution phases seen in previous cycle tops.
 Bitcoin Bull Score Index – Mapped to Price
Momentum Metrics Strengthen the Bitcoin Bearish Case
Market momentum indicators now echo the same cycle shift. RSI remains neutral around 50, signalling a lack of conviction behind this week’s advance.
Chaikin Money Flow has stayed negative for most of the month, reflecting continued capital outflows even as price recovers.
While MACD recently flipped positive, the histogram already shows weakening amplitude. This indicates the move lacks sustained momentum.

Additional signals deepen the caution. Short-term RSI spikes above 70 in recent days failed to hold, showing sellers remain active during every attempt at a breakout. CMF’s inability to return to positive territory highlights ongoing distribution rather than accumulation.
Meanwhile, MACD’s fragile crossover mirrors conditions seen during past bear market rallies, where momentum improves briefly before rolling over.
Taken together, on-chain, liquidity, and momentum indicators point to a structural shift into a bearish cycle.
If Strategy holds its 650K BTC this cycle (or sells only a little), we would not see another -65% drawdown like in 2022.We are about -25% from ATH now, and even if a bear cycle comes, the downside would likely be smaller and look more like a broad sideways range.Long-term…
— Ki Young Ju (@ki_young_ju) December 3, 2025
While Tom Lee and Arthur Hayes argue that Bitcoin could regain its earlier strength, current market data suggests the opposite.
Unless stablecoin liquidity, network activity, and demand growth rebound decisively, Bitcoin’s recent recovery is more likely a temporary bounce than the beginning of a new upside phase.
Disclaimer: The content of this article solely reflects the author's opinion and does not represent the platform in any capacity. This article is not intended to serve as a reference for making investment decisions.
You may also like
The BTC Collapse: Examining the Triggers and Consequences for 2026
- Bitcoin's 2026 collapse risk stems from leverage, quantum threats, and macroeconomic fragility, mirroring 2008/1929 crises. - Leverage-driven liquidation loops and corporate Bitcoin holdings create self-fulfilling price cascades across crypto and traditional markets. - Quantum computing could break Bitcoin's cryptography, while regulatory uncertainty amplifies systemic risks in its financialized ecosystem. - Historical parallels highlight recurring patterns of speculative excess and leverage, urging robu

The Bitcoin Leverage Liquidation Dilemma: How Investor Actions and Systemic Threats Shape a Financialized Cryptocurrency Market
- October 2025's Bitcoin futures liquidation wiped $19B, exposing systemic risks from leveraged crypto exposure. - Herd mentality and ultra-leveraged products (3x/5x ETFs) amplified volatility, triggering cascading liquidations during price drops. - SEC restricted 2x leverage caps but overlooked stablecoin risks and opaque crypto-lending structures fueling contagion. - Regulators now face balancing innovation with systemic safeguards, including stress-testing crypto-linked institutions and enforcing stable

YFI drops 1.51% over the past 24 hours following Edgewater Wireless’s proposal to extend warrants
- Edgewater Wireless proposes extending 8.33M warrants by 12 months to maintain capital flexibility. - YFI stock fell 1.51% in 24 hours amid the announcement, with 53.58% annual decline as of Dec 5, 2025. - The $0.10 exercise price remains below current $3781 share price, preserving discounted capital-raising potential. - Extension requires TSXV approval but avoids shareholder votes, reflecting common practice in capital-intensive tech sectors.

Bitcoin’s Latest Price Drop and What It Means for Crypto Investors: Addressing Systemic Threats and Regulatory Ambiguity in the Market After 2025
- Bitcoin's 2025 price crash from $126k to $92k exposed systemic risks in leveraged crypto markets, with $9.89B in liquidations triggered by macro shocks and thin liquidity. - Regulatory clarity via 2025 acts (GENIUS/CLARITY) boosted adoption but coexisted with geopolitical tensions and fragmented global standards, creating inconsistent risk environments. - Institutional Bitcoin demand surged through ETFs ($220B inflow in November 2025), contrasting with retail caution post-crash, as leverage risks and reg
