
Market Watcher Predicts Wave 5 to Take XRP to Two Digits, But Insists This is Conservative

Maelius, an experienced market analyst, has predicted a possible XRP surge to a two-digit price, but insists this target remains conservative.
Maelius’ forecast comes when XRP has begun recovering from a recent downtrend that had persisted since October. Notably, after surging to a high of $3.1 in October, XRP price tumbled, slipping 11.89% that month and then collapsing by a more substantial 14.09% in November, as bearish pressure mounted.
However, in December, XRP has displayed greater resilience after an initial downtrend. Since yesterday, the token has soared over 7%, looking to reclaim the $2.2 mark again. Amid the rebound effort, Maelius recently suggested that XRP could push further to a new all-time high around $12, citing its historical performance.
XRP’s Historical Structure
In his latest market commentary, the analyst shared a 1-week chart that supports his bullish disposition. Specifically, the chart indicates that after XRP trades within an extensive accumulation phase featuring an RSI accumulation trend, it typically breaks out and soars to greater levels.
The first time this pattern played out on the weekly chart was in 2015. Notably, after dropping from the $0.0280 peak in December 2014, XRP traded within an accumulation zone between May 2015 and March 2017. During this period, price action remained contained in a range of $0.004 to $0.009.
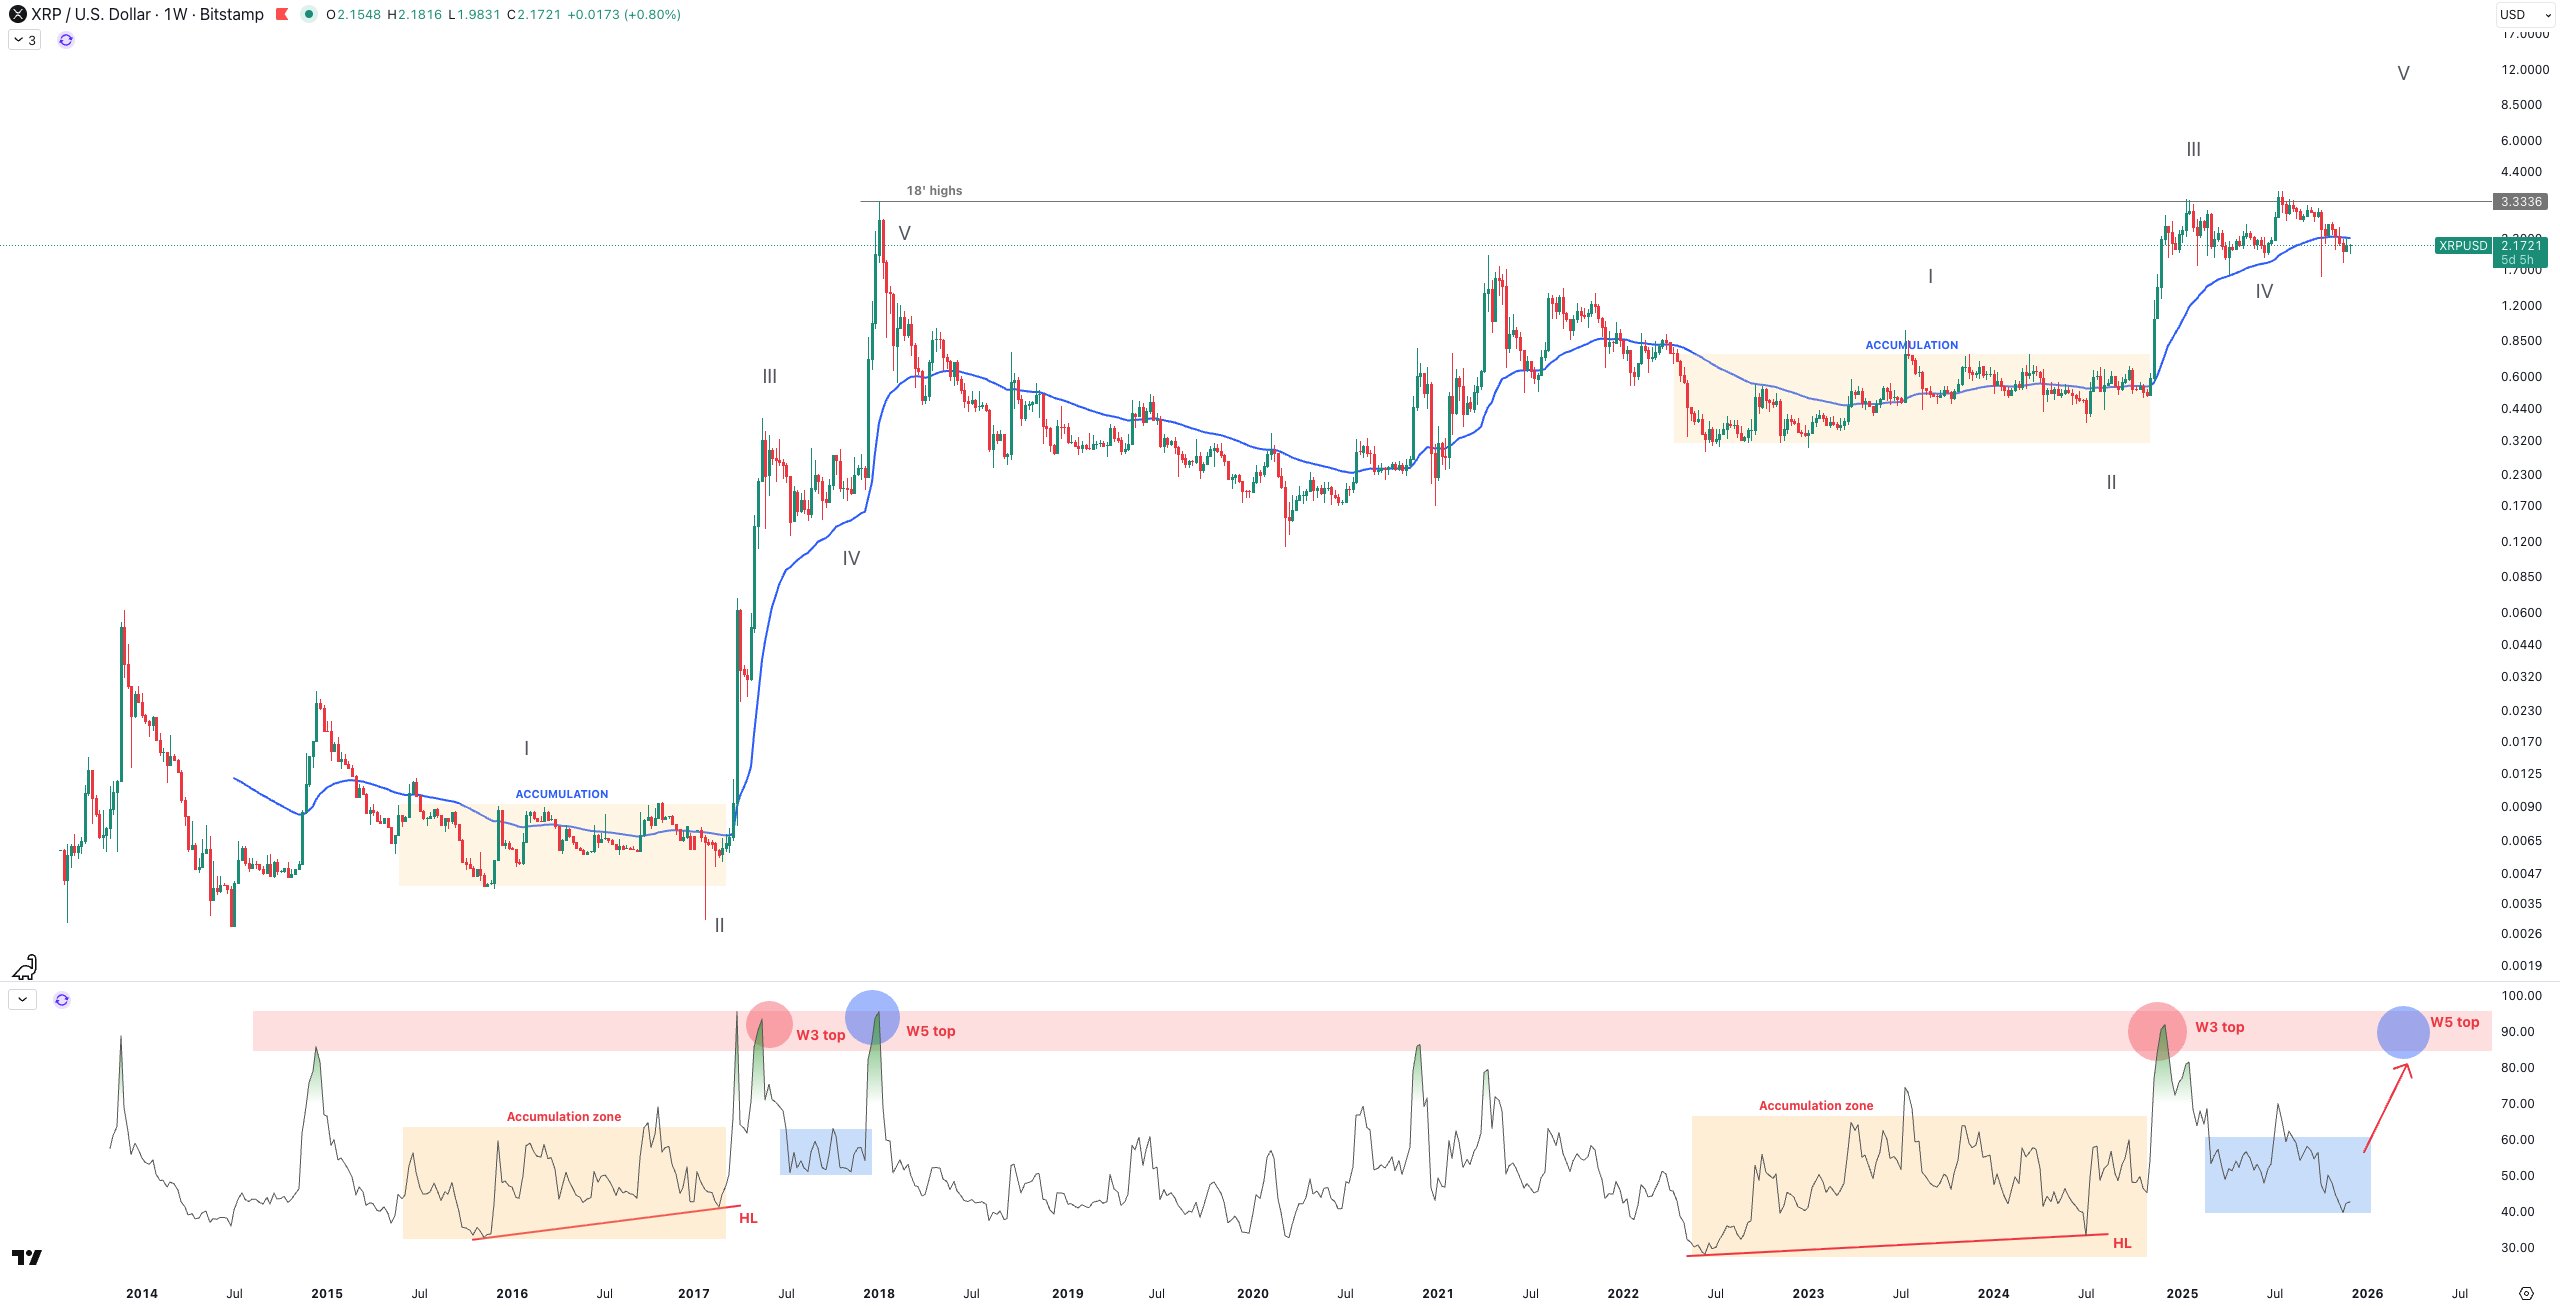
In addition to the price, XRP’s weekly RSI also slipped into an accumulation zone, but encountered higher lows. Meanwhile, within the accumulation, the XRP price finalized two waves of an Elliott Wave pattern.
Interestingly, it broke out in March 2017, surging to an initial peak of $0.3988 by May 2017, which marked Wave 3 of the pattern and aligned with the first top of an RSI rebound. After this, Wave 4 resulted in a correction, before the fifth wave pushed XRP to an unprecedented price of $3.31 by January 2018, aligning with a second top of the RSI rebound.
XRP Witnessing a Similar Pattern
The pattern began playing out again during the 2022 bear market. This time, XRP entered a price accumulation zone as it traded within a range of $0.3 and $0.8 from May 2022 to November 2024.
During this price accumulation phase, the RSI also entered its own accumulation zone but recorded higher lows. Notably, XRP formed another set of two Elliott Waves during this accumulation.
However, it broke above the accumulation zone in November 2024, soaring to a peak of $3.4 in January 2025, which represented the completion of Wave 3. Also, the $3.4 top aligned with the first top of the weekly RSI, as it rebounded with the price.
From here, XRP corrected to complete Wave 4 at a $1.96 price in June 2025. Now, Maelius believes the fifth wave has begun, and XRP could again soar to a higher price. He expects this Wave 5 to push prices to $12, aligning with the second top of the RSI rebound. However, he suggests that this $12 target remains conservative.
With XRP currently trading for $2.18, a rally to $12 would represent a 445% jump, which could be considered conservative, considering XRP surged by more than 1,500% within a month to reach the previous pattern’s second top. Notably, market commentators such as Rob Cunningham have also projected a possible XRP rise to $12.
Disclaimer: The content of this article solely reflects the author's opinion and does not represent the platform in any capacity. This article is not intended to serve as a reference for making investment decisions.
You may also like
PENGU Price Forecast for 2026: Managing Fluctuations and Momentum from Key Catalysts After the 2025 Market Adjustment
- 2025 crypto market correction reshaped altcoin dynamics as Bitcoin/Ethereum declined amid macroeconomic uncertainty and regulatory pressures. - Pudgy Penguins (PENGU) saw sharp volatility post-correction, with technical indicators suggesting potential $0.069 rebound by 2026 if adoption metrics align. - Strategic partnerships with Bitso and cross-chain integrations, plus Kung Fu Panda NFT collaborations, aim to boost PENGU's liquidity and mainstream adoption. - Despite 12% early 2026 price drop, Pudgy Inv
ZEC Value Increases by 4.82% Following Recent Exchange Listing
- Zcash (ZEC) surged 4.82% in 24 hours after Bitget listed it for spot trading on Dec 3, 2025, boosting short-term liquidity and visibility. - Zcash’s zero-knowledge proof technology enables encrypted transactions while maintaining blockchain integrity, distinguishing it as a privacy-focused asset. - Bitget’s UEX model supports multi-chain access, aligning with Zcash’s goal to balance transparency and privacy, though recent 7-day and 1-month declines highlight market volatility risks.
Tether (USDT) Price Fluctuations and Market Response to PENGU Sell Indicators: Assessing Potential Risks and Opportunities within a Divided Stablecoin Landscape
- Tether (USDT) faced 2025 depegging to $0.90, exposing reserve management flaws and triggering S&P's "weak" stability rating. - Algorithmic PENGU USDT's 28.5% price drop and $66.6M team outflows highlighted systemic risks in opaque collateral structures. - Regulatory shifts (GENIUS Act, MiCA) accelerated migration to compliant stablecoins like USDC , now dominating 30% of on-chain transaction volume. - Market fragmentation reveals dual dynamics: algorithmic risks vs. institutional adoption opportunities i
DASH Increases by 2.44% as Significant Insider Selling and Purchase Indicators Emerge
- DASH rose 2.44% in 24 hours to $50.1, showing a 31.63% annual gain despite a 11.79% seven-day drop. - High-ranking insiders sold millions via 10b5-1 plans, including $9. 3M by Stanley Tang and $6.19M by Andy Fang. - Alfred Lin’s $100.2M purchase signaled confidence, contrasting with other sales and suggesting undervaluation. - Market reacted positively short-term, but analysts expect macroeconomic and business fundamentals to support DASH ahead.
