
Even BlackRock can't hold on? BTC ETF sees $3.5 billion outflow in a single month as institutions quietly "deleveraging"

The article analyzes the reasons behind cryptocurrency ETF outflows in November 2025 and their impact on issuers' revenues, comparing the historical performance of BTC and ETH ETFs as well as the current market situation. Summary generated by Mars AI. This summary is produced by the Mars AI model, and the accuracy and completeness of its generated content are still being iteratively updated.
When ETFs Fall into “Deficit”
Historically, November has always been a mixed month for cryptocurrencies. This year is no exception, and it stands in stark contrast to the past two years.
BTC and ETH closed down 17% and 22% respectively this month, whereas in November 2024, they rose by 37% and 47%. While last year’s gains could be attributed to the frenzy brought by Donald Trump’s re-election as US President, in November 2023, they also rose by 9% and 13% respectively.
This year’s crypto crash in November was driven by a broader market collapse over the past two months, fueled by tariff wars and uncertainty in macroeconomic conditions.
This contrast is particularly evident in the exchange-traded fund (ETF) data panels for 2025 and 2024.
In November 2024, Bitcoin spot ETFs attracted about $6.5 billion in net inflows, while Ethereum ETFs added $1 billion. At that time, ETF issuers held over $105 billion worth of Bitcoin and $11 billion worth of ETH wrapped products. Twelve months later, in November 2025, BTC ETFs saw about $3.5 billion in net outflows. Ethereum wrapped products lost about $1.4 billion. For these two flagship wrapped products, there was a negative reversal in monthly demand of about $12 billion.
On paper, ETF issuers do manage more assets today than a year ago. Cumulative net inflows are positive, and total assets have increased, at least slightly. But in recent months, ETF fund flows have turned from “green” (inflows) to “red” (outflows), showing us how much issuers have lost in fee collections.
In this week’s quantitative analysis, I will examine how the three major sponsors (issuers) of BTC and ETH spot ETFs performed when both demand and price for the underlying assets declined.
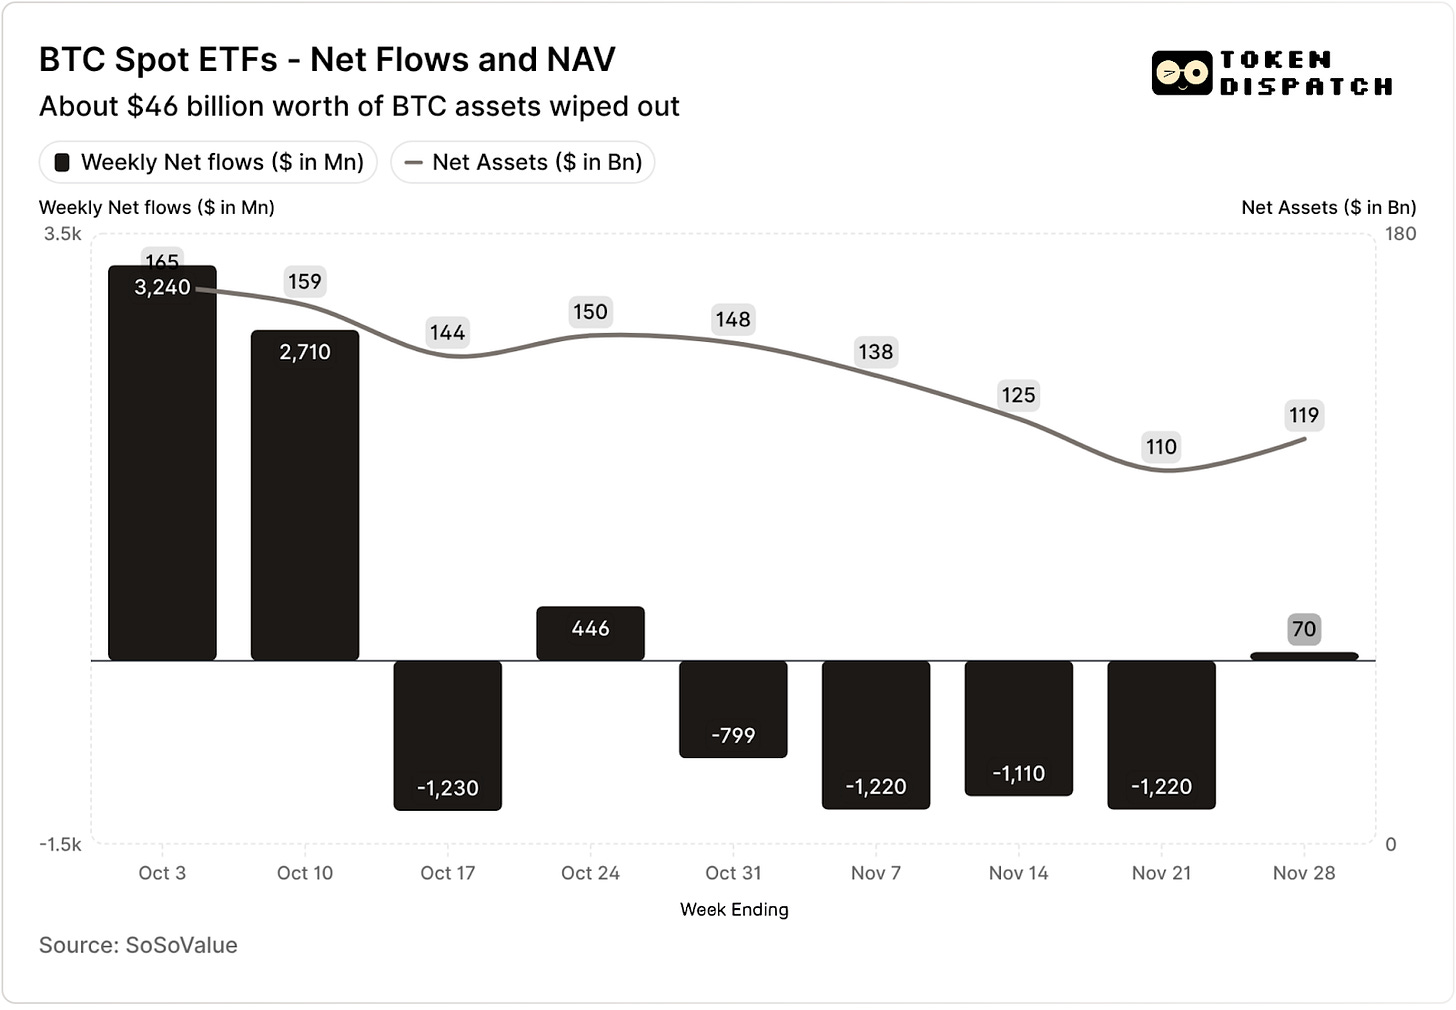
In the first two weeks of October, Bitcoin spot ETFs attracted $3.2 billion and $2.7 billion in funds respectively—these were the highest and fifth highest weekly inflows in 2025.
Before that, BTC ETFs seemed poised to complete the second half of 2025 without any consecutive weeks of outflows.
Then, the worst crypto liquidation event in history occurred. The crypto market is still reeling from the evaporation of $19 billion in assets.
ETH ETFs also attracted $1.8 billion in net inflows during the same period.
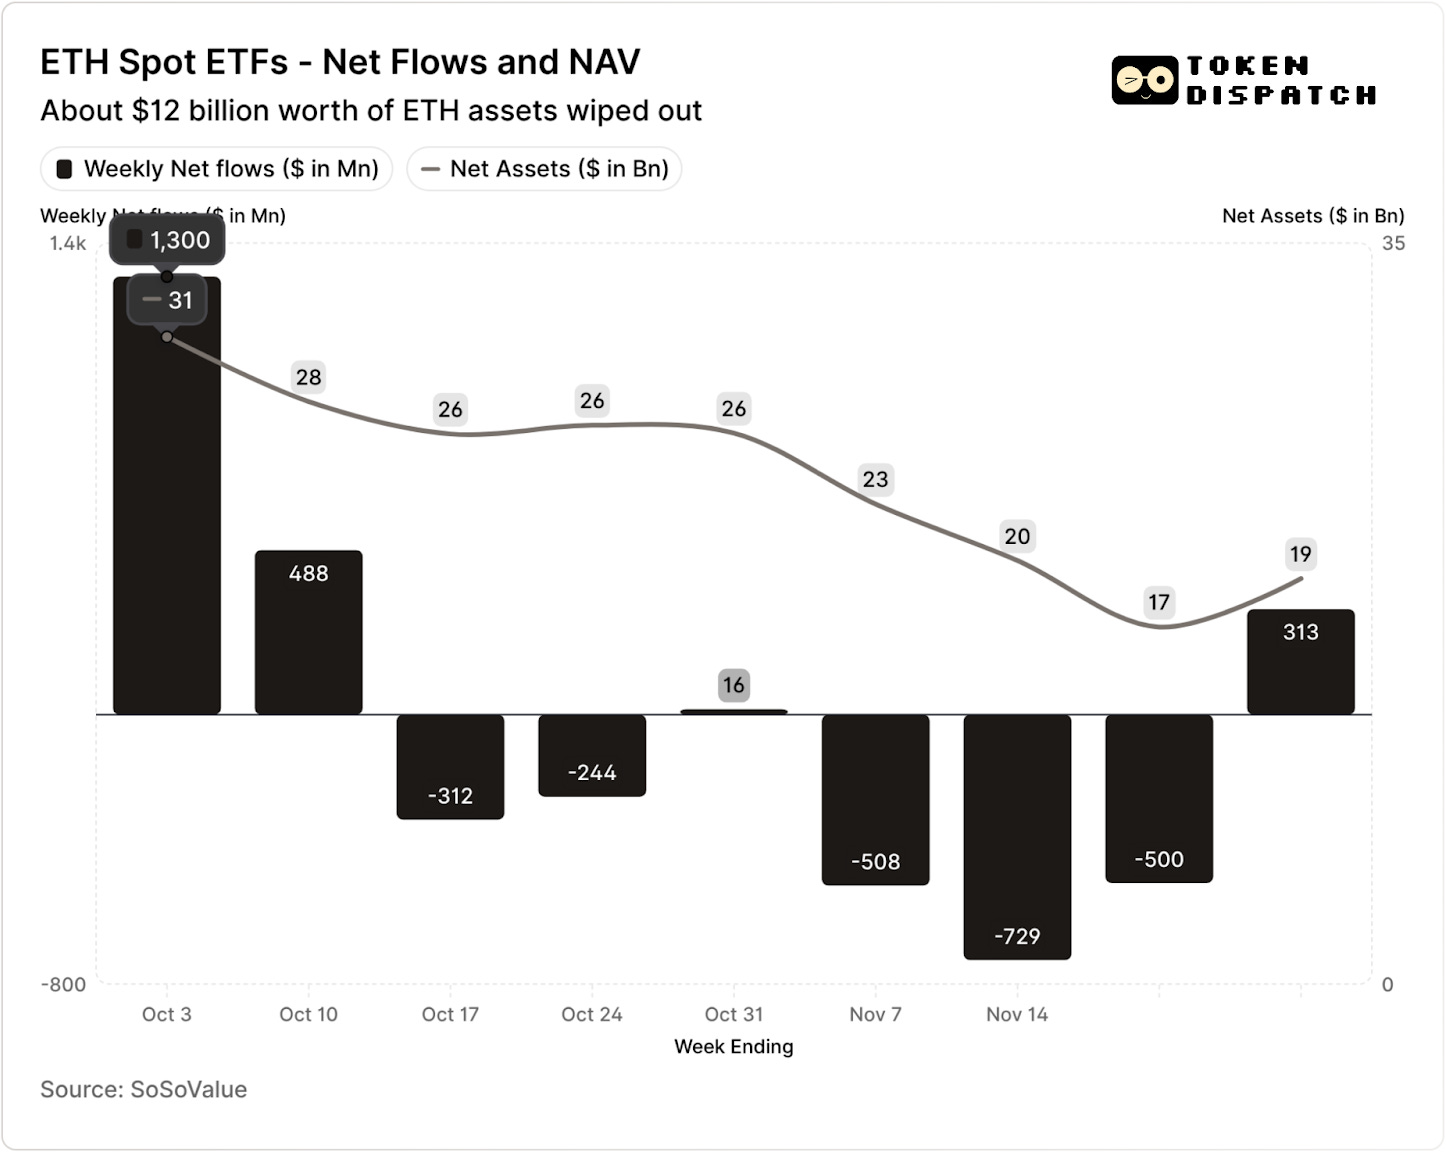
In the seven weeks since the liquidation event, both BTC and ETH ETFs have seen outflows in five weeks, totaling over $5 billion and $2 billion respectively.
As of the week ending November 21, the net asset value (NAV) held by BTC ETF issuers fell from about $164.5 billion to about $110.1 billion. ETH ETF NAV dropped nearly 50%, from about $30.6 billion to about $16.9 billion. Part of this loss came from the price drop of BTC and ETH, while the rest was due to tokens being completely withdrawn from wrapped products. Combined, in less than two months, about one-third of the BTC and ETH ETF portfolio NAV was wiped out.
The decline in fund flows tells us more than just investor sentiment. It also has a direct impact on the income ETF issuers/sponsors earn through fees.
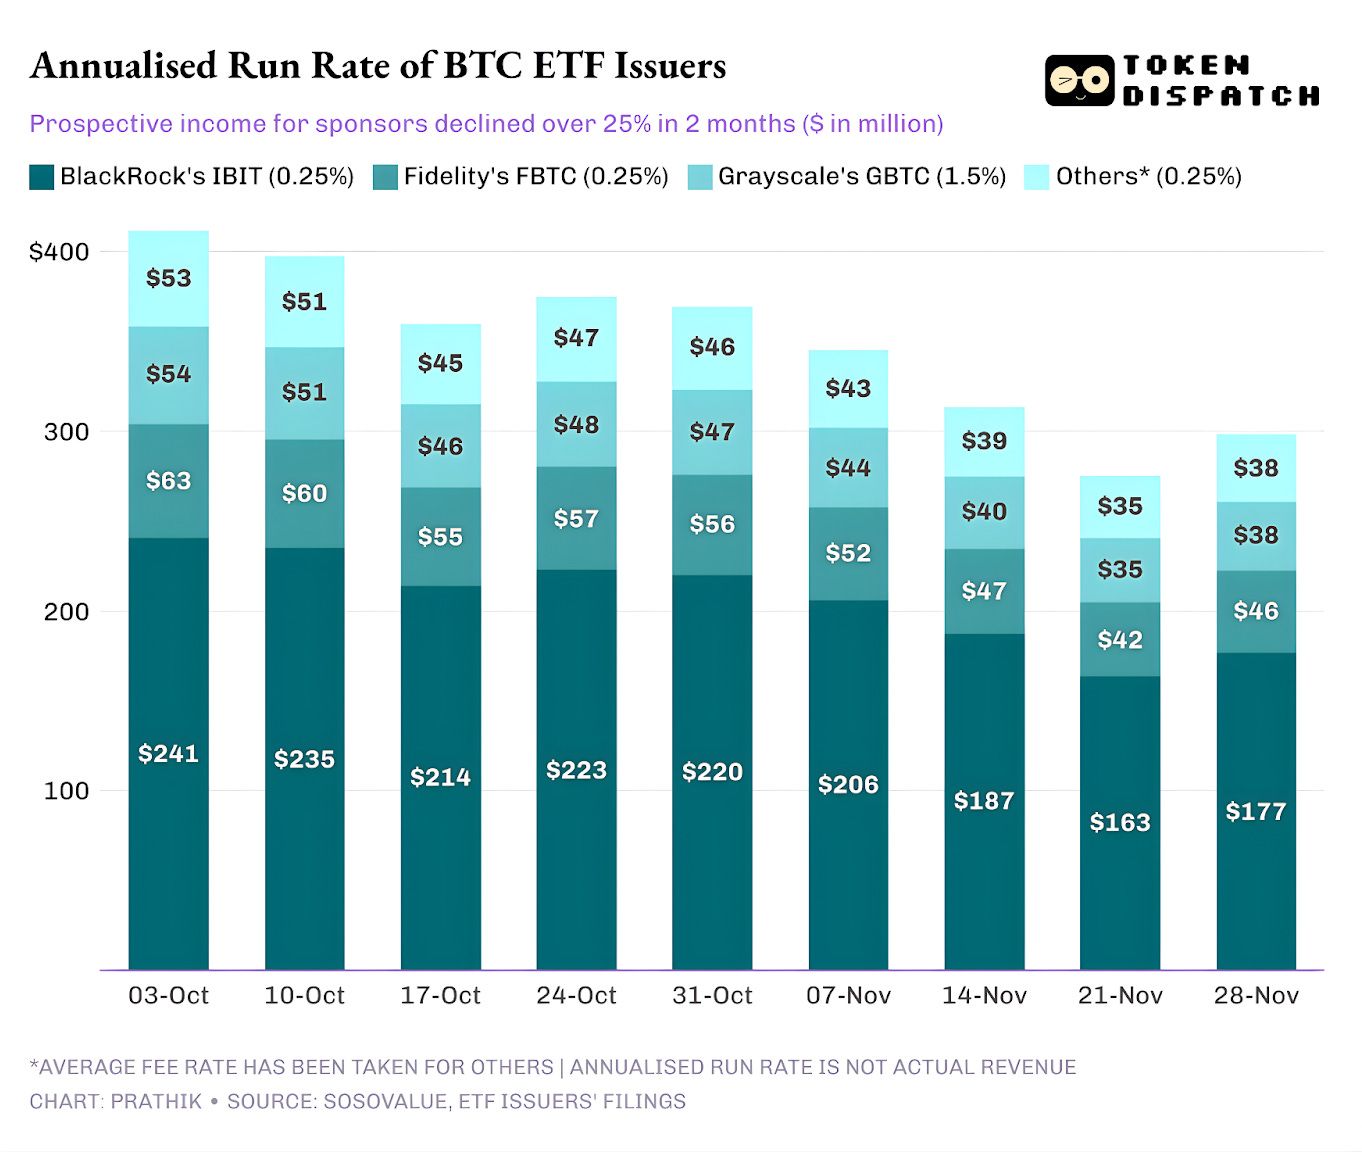
Bitcoin and Ethereum spot ETFs are revenue machines for issuers such as BlackRock, Fidelity, Grayscale, and Bitwise. Each fund charges fees on its held assets, usually expressed as an annual percentage, but accrued daily based on net asset value.
Every day, trusts holding BTC or ETH shares sell part of their holdings to pay for fees and other expenses. For issuers, this means the annualized revenue run rate equals assets under management (AUM) multiplied by the fee rate. For holders, this means tokens are gradually diluted over time.
ETF issuer fees range from 0.15% to 2.50%.
Redemptions or outflows themselves do not directly cause issuers to make or lose money. However, outflows reduce the assets issuers hold at the end of the day, which is the basis for their fees.
On October 3, BTC and ETH ETF issuers collectively held $195 billion in assets. At the above fee levels, this corresponded to a very healthy fee pool. By November 21, the same products held only about $127 billion in assets.
If annualized fee income is calculated based on weekend AUM, expected revenue for BTC ETFs has dropped by more than 25% in the past two months.
ETH ETF issuers were hit even harder, with annualized revenue dropping 35% in the past nine weeks.
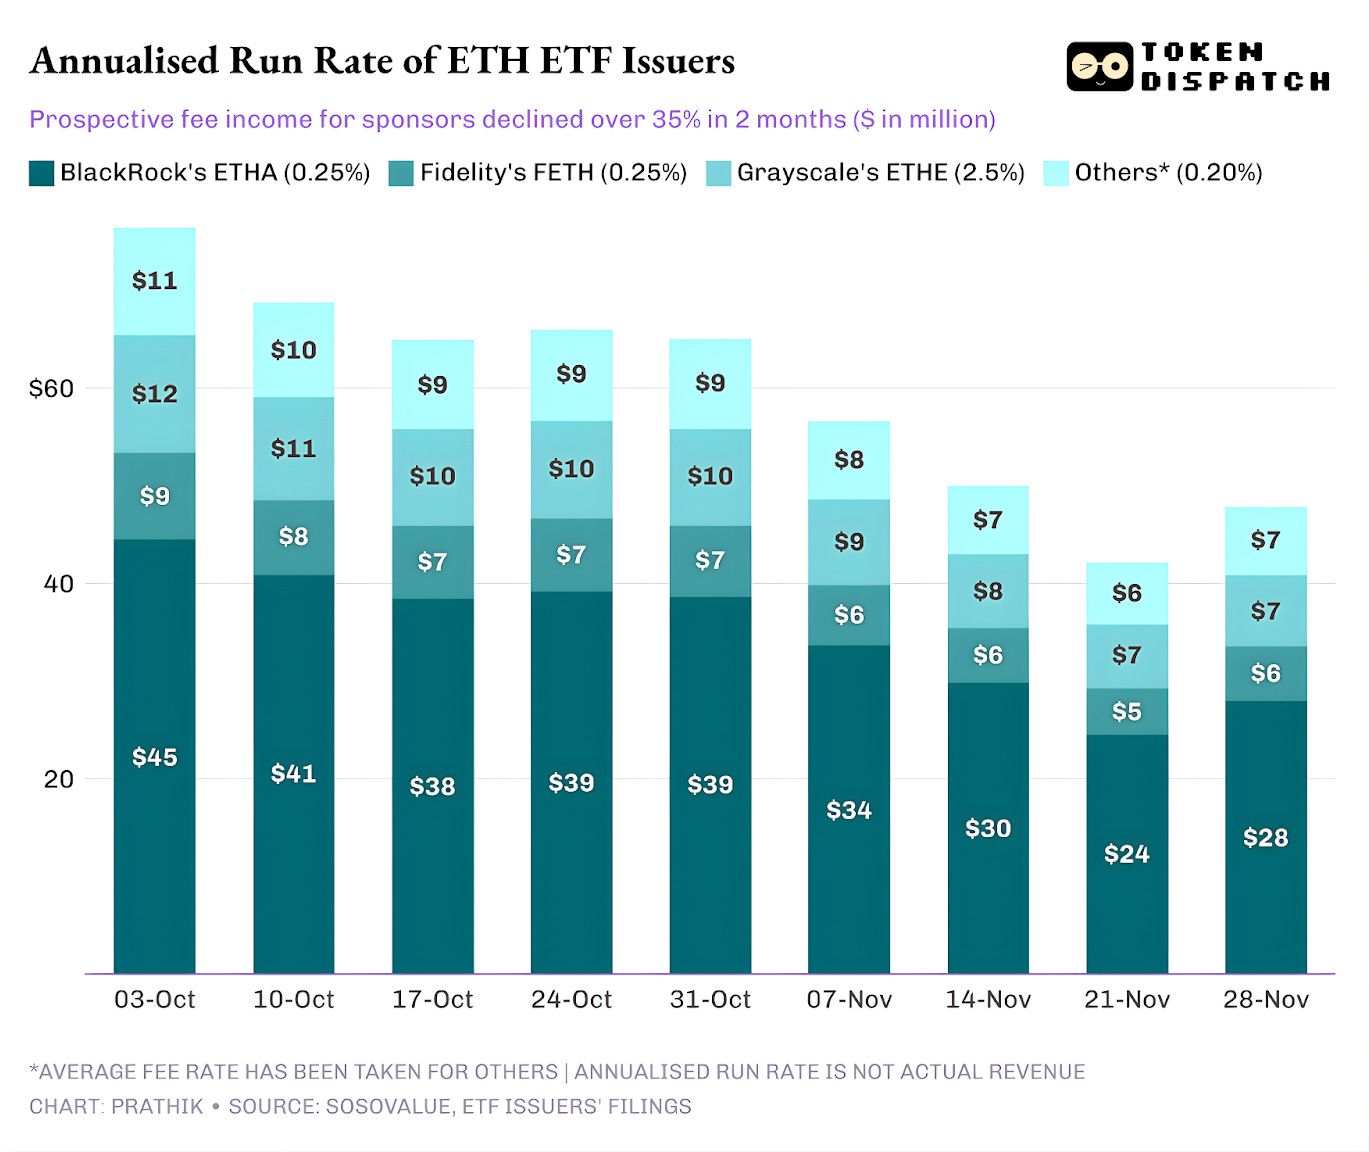
The Bigger the Issuer, the Harder the Fall
When you zoom out to the issuer level, fund flows tell three slightly different stories for each ETF issuer.
For BlackRock, it’s a picture of scale and cyclicality. IBIT and ETHA have become the default tools for investors choosing the ETF route to gain mainstream BTC and ETH exposure. This gives the world’s largest asset manager a huge base to charge its 25 basis point fee, especially when AUM hit record highs in early October. But it also means that when whales want to de-risk in November, IBIT and ETHA are the obvious targets for selling.
This is clear: BlackRock’s annualized fee income from BTC and ETH ETFs fell by 28% and 38% respectively, exceeding the issuer average declines of 25% and 35%.
Fidelity’s experience was similar to BlackRock’s, just on a smaller scale. FBTC and FETH followed the same inflow-outflow rhythm, with October’s enthusiasm giving way to November’s red bars.
Grayscale’s story is more about legacy issues. Once upon a time, GBTC and ETHE were the only scalable way for many US investors to hold BTC and ETH in brokerage accounts. With BlackRock and Fidelity now leading the charts, that monopoly is gone. What makes things worse for Grayscale is the high fee structure of its initial wrapped products. This has led to a long-term trend of outflows over the past two years.
The period from October to November also reflected this investor behavior. In good times, they rotated capital into cheaper wrapped products, and in bad times, they cut risk across the board.
Grayscale’s initial crypto wrapped products charged fees six to ten times higher than low-cost ETFs. While this helped inflate its revenue line, the expense ratio drove investors away and squeezed its fee-earning AUM base. Every dollar left is usually due to frictional costs such as taxes, authorization, or operational hassle, rather than active investor preference. Every dollar that leaves is a fresh reminder: as long as there are clean alternatives, more holders are voting against high-fee wrapped products.
All these ETF charts tell us a few things about the current stage of crypto institutionalization.
The spot ETFs before and after October and November show that the business of managing crypto ETFs is cyclical, just like the markets for the underlying assets. When prices are high and headlines are favorable, more fund flows translate into higher fee income. When macro conditions shift, it all flows out just as quickly.
Large sponsors have built efficient “toll roads” on top of BTC and ETH, but October and November show that these roads are not immune to market cycles. For issuers, the key to the game is to retain assets through the next shock so that every time the macro winds shift, the fee meter doesn’t swing 25-35%.
While issuers cannot stop investors from redeeming during sell-offs, yield-bearing products can cushion some of the downside pressure.
Covered-call ETFs can provide investors with premium income, helping to offset some of the price declines in the underlying assets. Staking-wrapped products could also be an option. However, such products must pass regulatory scrutiny before going live.
Disclaimer: The content of this article solely reflects the author's opinion and does not represent the platform in any capacity. This article is not intended to serve as a reference for making investment decisions.
You may also like
Over $756M In 11 days : XRP ETF Break Records

BTC Lags Behind Global Money Growth

Shiba Inu: Shibarium Privacy Upgrade Targets 2026

Ontology Joins Circle Alliance Program: A Strategic Leap for Blockchain and USDC Integration