HBAR Drops 6% as Market Weakens, Yet 3 Early Rebound Clues Appear

HBAR price is down about 6% in the past 24 hours, underperforming an already weak crypto market. Even with this pressure, the chart is flashing a rare mix of three early rebound clues that most mid-caps are not showing right now. If the broader market steadies, HBAR could be one of the first to move,
HBAR price is down about 6% in the past 24 hours, underperforming an already weak crypto market. Even with this pressure, the chart is flashing a rare mix of three early rebound clues that most mid-caps are not showing right now.
If the broader market steadies, HBAR could be one of the first to move, especially if it protects a key support level discussed later.
Accumulation Signs Build Beneath the Decline
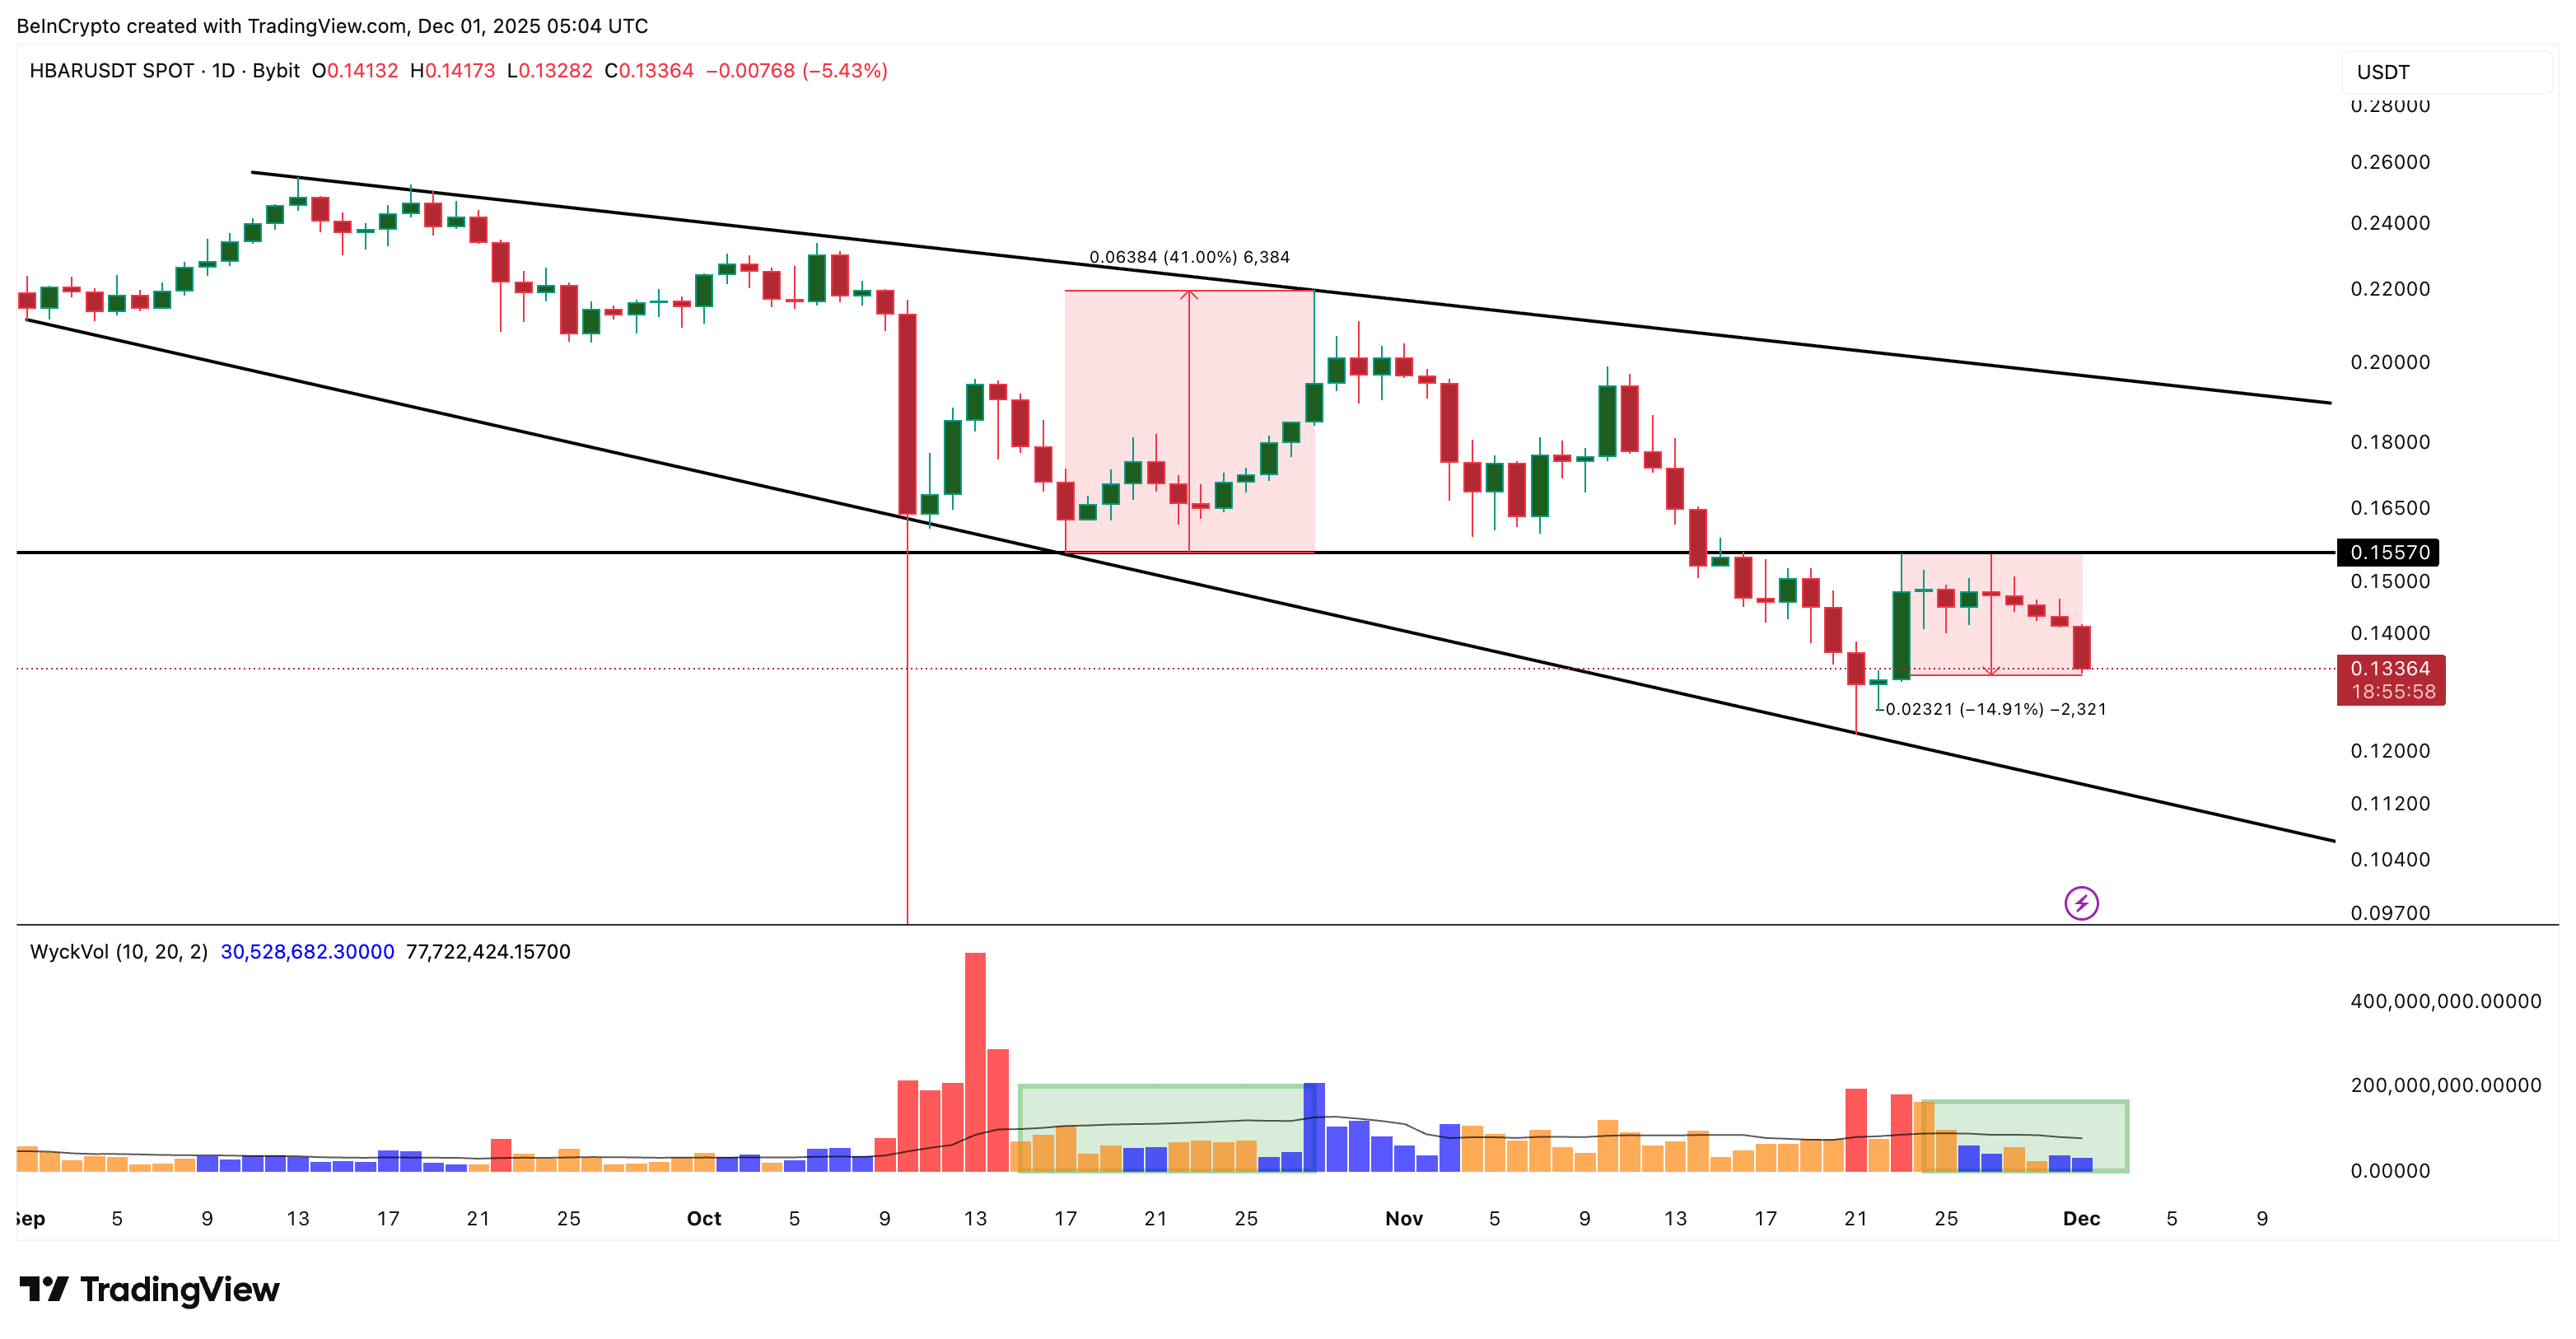
HBAR has moved inside a broad falling wedge since early September. This pattern often turns bullish when sellers lose control near the lower boundary, and that shift first appeared around November 21.
The first clue comes from the changing volume behavior. HBAR’s activity follows a Wyckoff-style color pattern: red shows sellers in control, yellow shows sellers gaining control, blue marks buyers gaining control, and green shows buyers fully in control.
Since HBAR peaked at $0.155 on November 23 and fell nearly 15%, the bars have shifted from heavy red to a blend of yellow and blue. That blend is a classic sign of seller exhaustion and early tug-of-war. The last time this mix showed up — between October 15 and October 28 — HBAR climbed 41% right after.
 Buyer-Seller Indecision Builds:
TradingView
Buyer-Seller Indecision Builds:
TradingView
Want more token insights like this? Sign up for Editor Harsh Notariya’s Daily Crypto Newsletter.
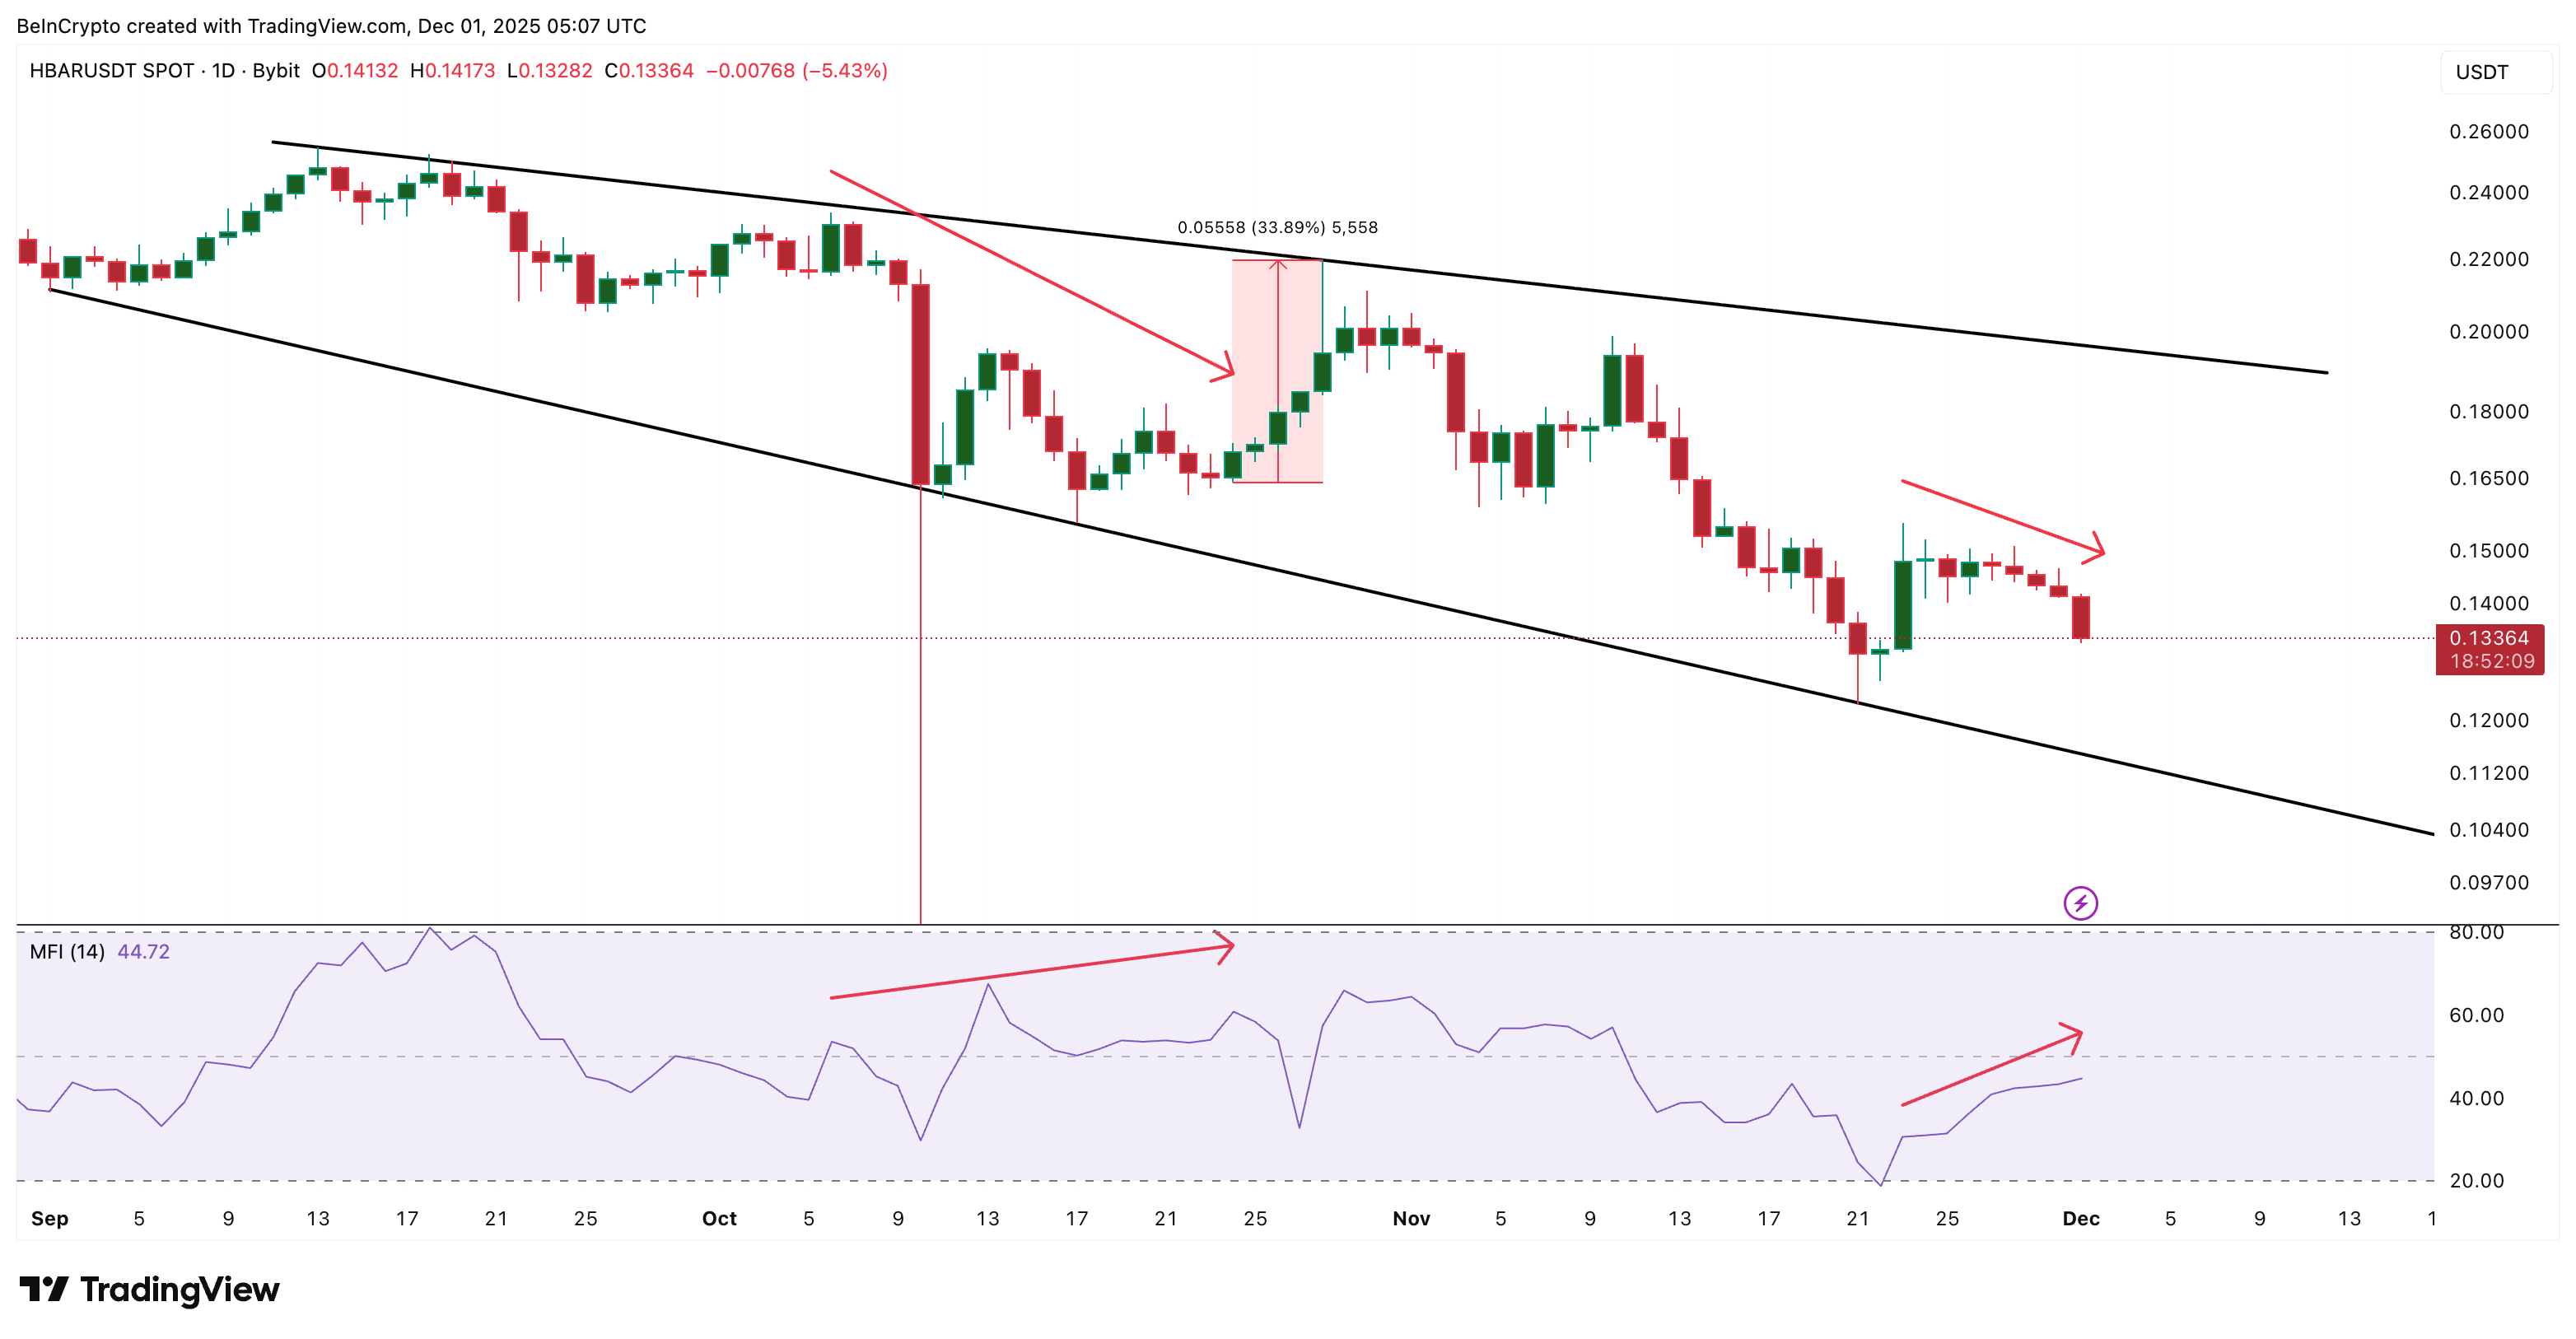
A second clue appears in the MFI (Money Flow Index), which tracks buying and selling pressure using both price and volume. Between November 23 and December 1, the HBAR price kept making lower highs while MFI made higher highs. That divergence shows dips are being quietly bought. A similar divergence formed between October 6 and October 24 and led to a 33% jump once it completed.
 HBAR Dips Are Being Bought:
TradingView
HBAR Dips Are Being Bought:
TradingView
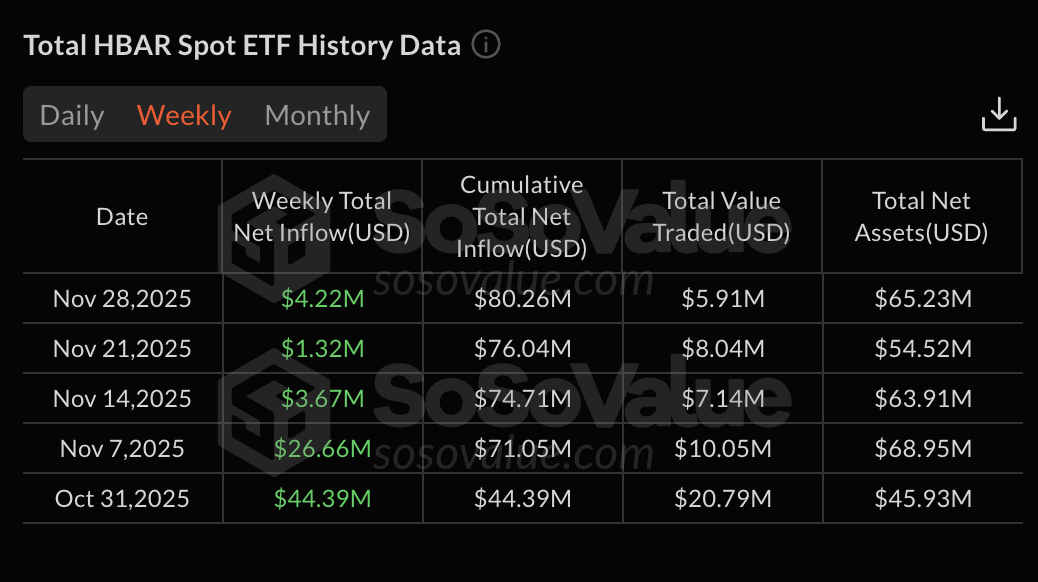
The third clue comes from steady spot ETF demand. The Canary HBAR Spot ETF has posted positive weekly inflows in four of the last five weeks, with more than $80 million in cumulative inflows. Inflows are smaller than late October, but they remain positive even as price falls — meaning broader demand has not vanished.
 HBAR ETF Flow:
SoSo Value
HBAR ETF Flow:
SoSo Value
Together, these three clues — shifting volume control, dip-buying pressure, and ongoing ETF inflows — show early accumulation forming beneath the surface.
Key HBAR Price Levels Decide Whether the Rebound Can Hold
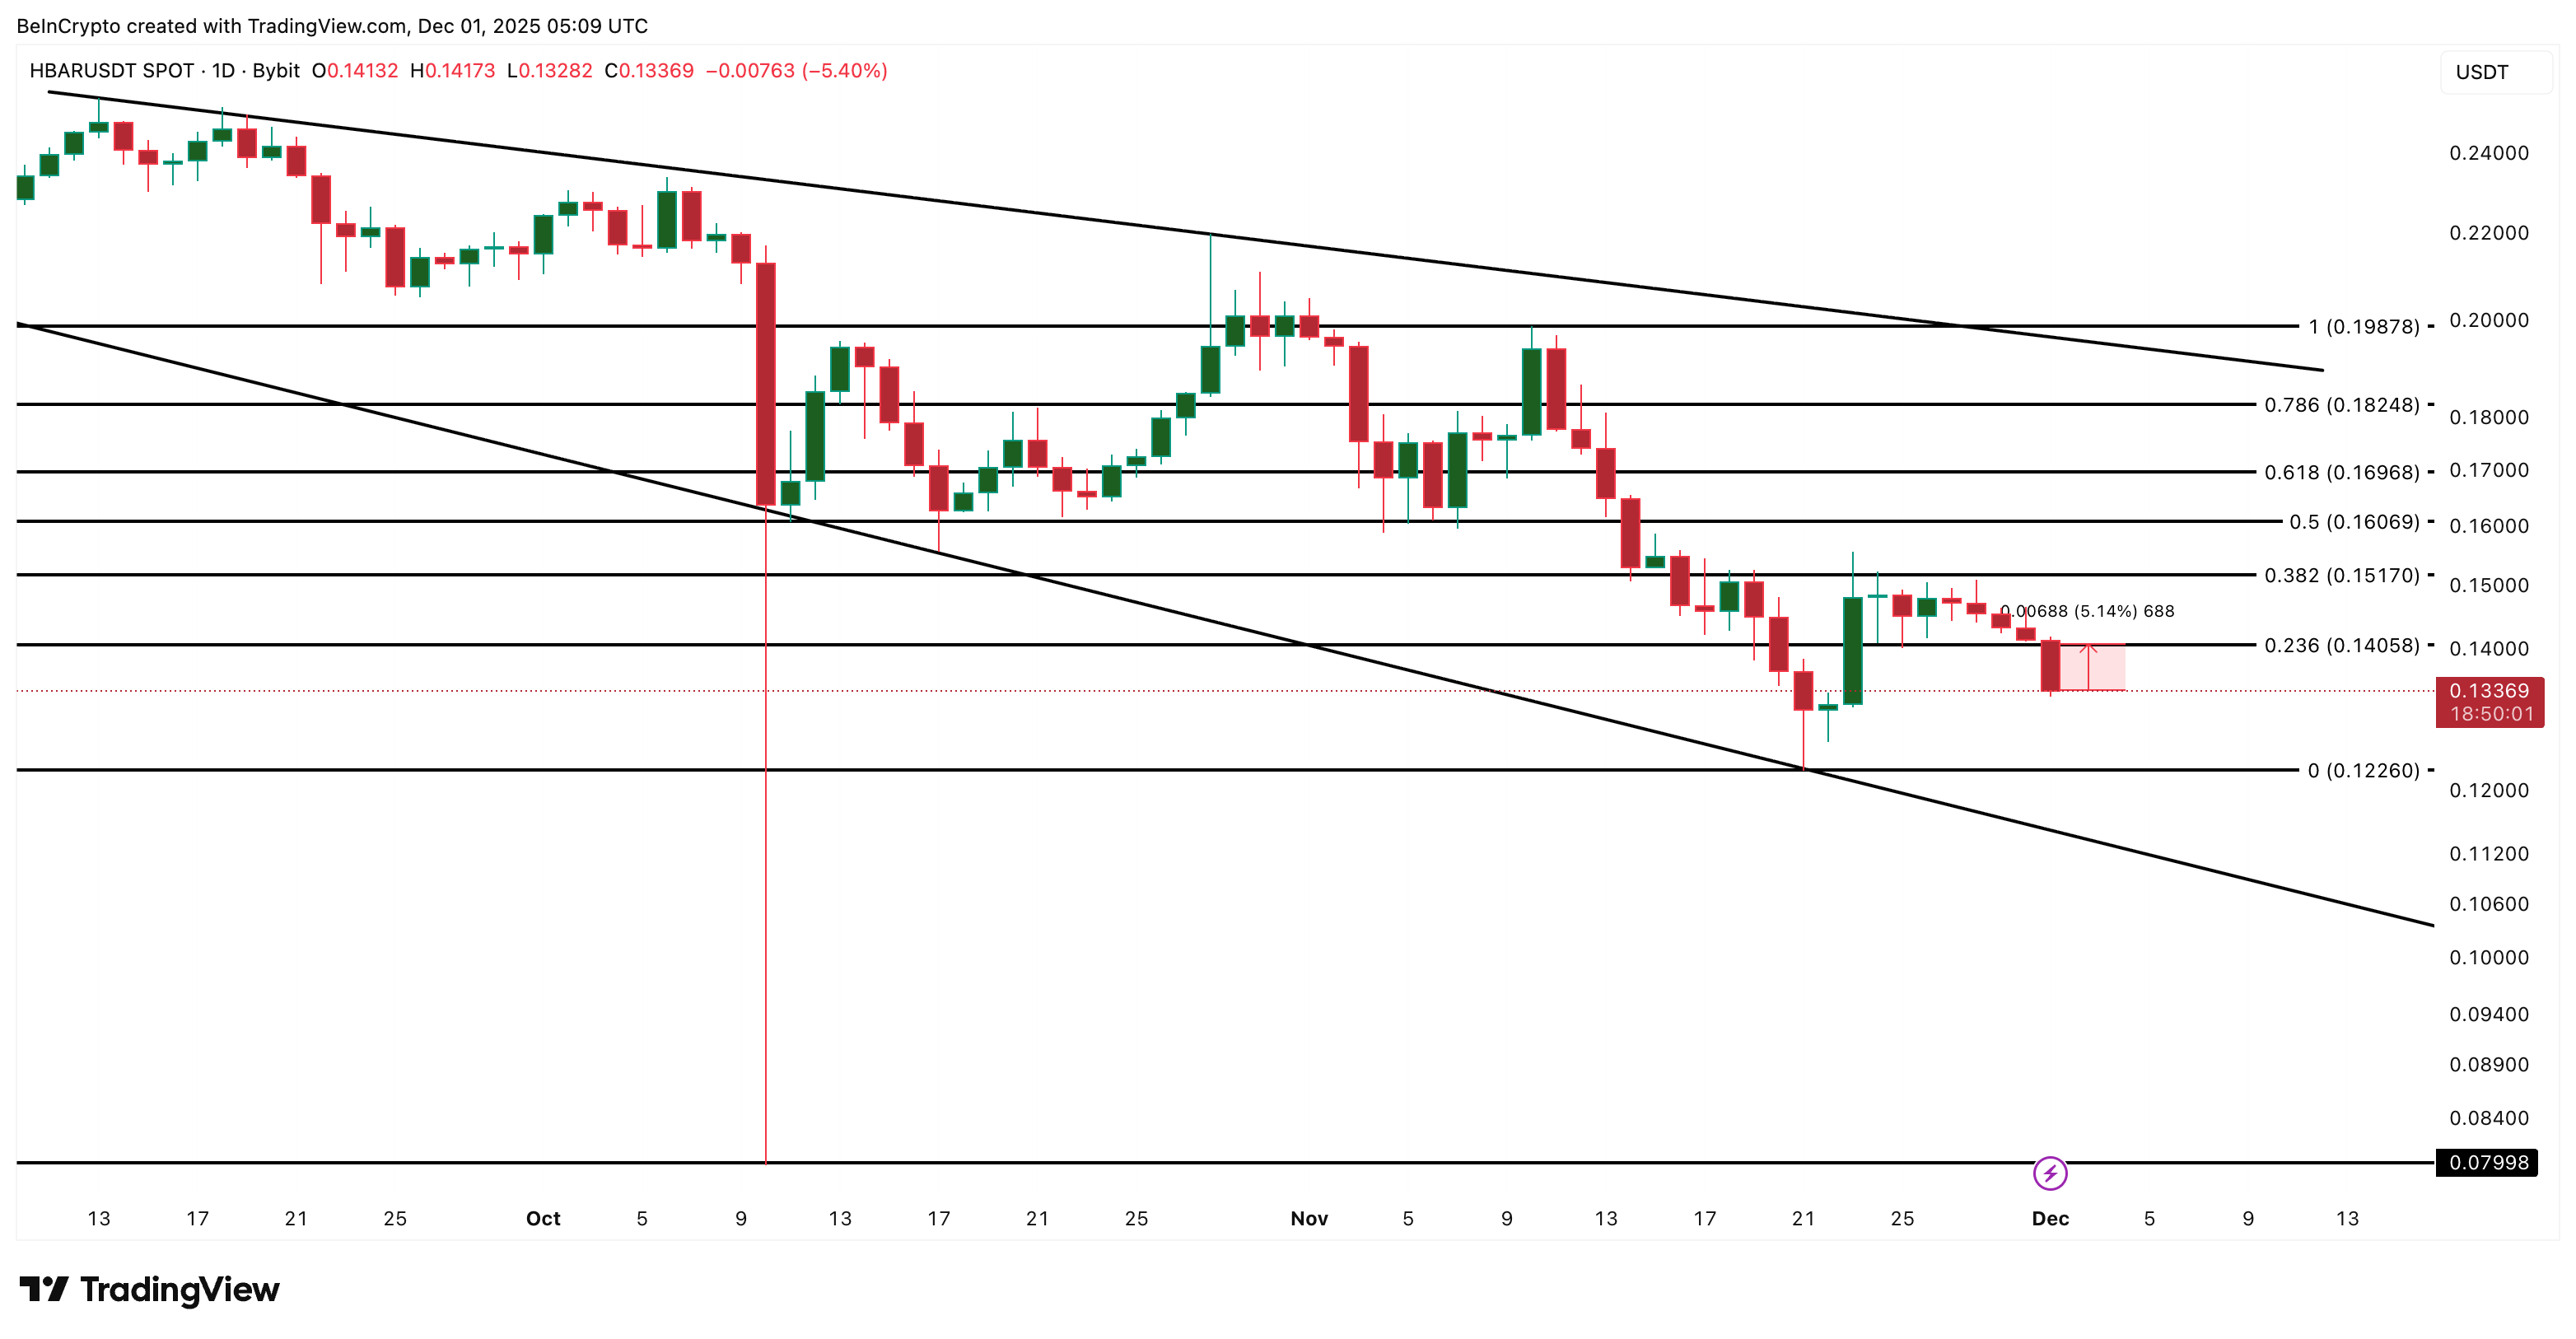
The wedge’s lower boundary near $0.122 is the most important support for HBAR right now. Holding that area keeps the rebound case alive. Losing it exposes the next major zone near $0.079, which would flip the structure from “early accumulation” to a deeper slide.
 HBAR Price Analysis:
TradingView
HBAR Price Analysis:
TradingView
For strength, HBAR needs to reclaim $0.140 first, a 5% rebound from the current level. That would show that buyers are finally overpowering the sell-side pressure. If $0.140 breaks, the next major level sits at $0.155. Clearing $0.155 opens the path toward $0.169 and even $0.182 if the crypto market improves.
Read the article at BeInCryptoDisclaimer: The content of this article solely reflects the author's opinion and does not represent the platform in any capacity. This article is not intended to serve as a reference for making investment decisions.
You may also like
Tron Leads with $931M Stablecoin Inflows
Tron sees $931.7 million in stablecoin inflows in 24 hours, marking the highest among all chains.Why Are Stablecoins Flowing Into Tron?What This Means for Tron and Crypto

Bitcoin Buying Collapse Signals Bear Market Fears
Bitcoin buying by major players has dropped sharply in 2025, raising concerns of a looming bear market.Bear Market Signals Are GrowingWhat This Means for Retail Investors

American Bitcoin Trust Adds 502 BTC to Holdings
American Bitcoin Trust acquires 502 more BTC, increasing total holdings to 4,367 BTC amid growing institutional interest.Growing Confidence in Bitcoin’s FutureWhat This Means for the Market

Bitcoin ETFs See Outflow as Ether Gains $140M Inflows
U.S. spot Bitcoin ETFs ended a five-day inflow streak with a $14.90M outflow, while Ether ETFs gained $140M on December 3.Ether ETFs Shine with Strong InflowsSolana ETFs See Outflows Amid Market Repositioning