Pi Coin Cannot Afford To Hit The Brakes — A 34% Breakdown Gets Triggered If It Slows

Pi Coin has been one of the month’s strongest movers. It is up almost 11%, while Bitcoin and Ethereum are down about 20% and 26%, respectively. Even in the past 24 hours, the Pi Coin price added roughly 2.24%. But this strength also comes with a warning. The chart shows a structure where any slowdown
Pi Coin has been one of the month’s strongest movers. It is up almost 11%, while Bitcoin and Ethereum are down about 20% and 26%, respectively. Even in the past 24 hours, the Pi Coin price added roughly 2.24%.
But this strength also comes with a warning. The chart shows a structure where any slowdown could trigger a 34% downside break if one key level fails. That sets the stage for a simple question: Is Pi Coin still safe as long as it keeps running, or are the signs pointing the other way?
Rising Price, Hidden Trap In The Pattern
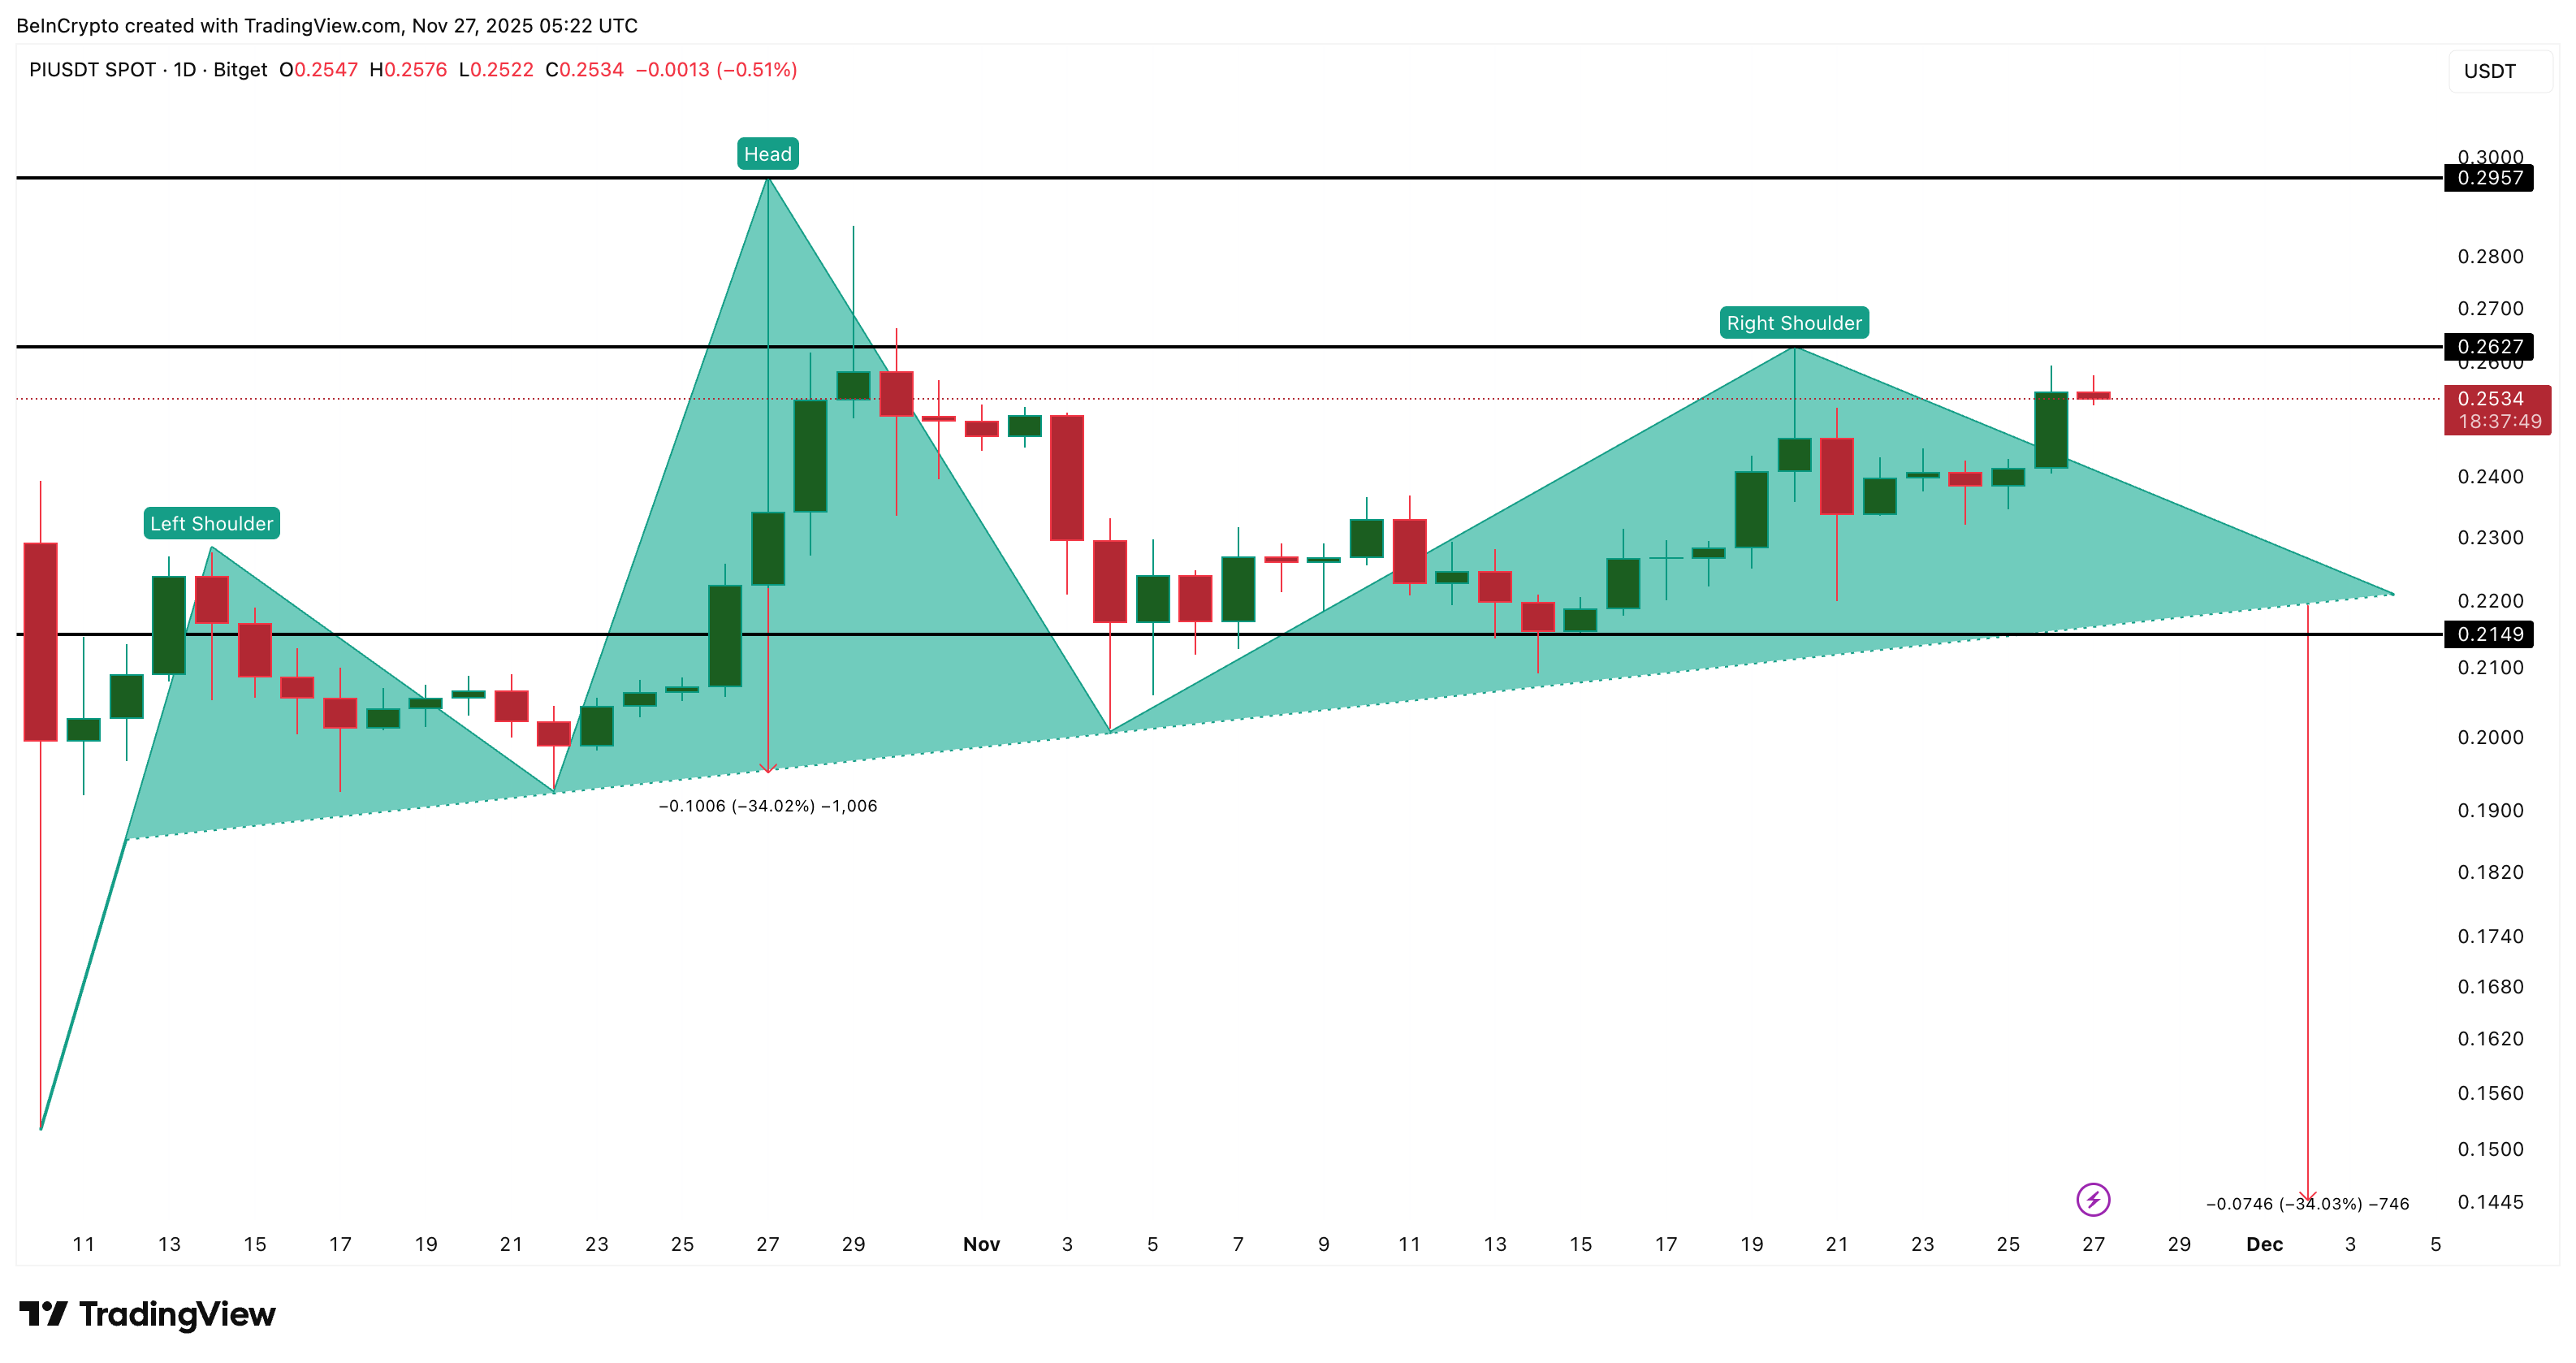
Pi Coin is forming a clear head-and-shoulders pattern, a structure that often appears before breakdowns. The neckline of this pattern sits near $0.21. If the PI price closes below that area, the distance from the “head” to the neckline projects a possible 34% decline.
 PI Forms A Bearish Pattern:
TradingView
PI Forms A Bearish Pattern:
TradingView
Want more token insights like this? Sign up for Editor Harsh Notariya’s Daily Crypto Newsletter here.
To save itself from the risk, PI needs to beat the head formation by going above $0.29. That would mean a steeper price rise.
Momentum adds weight to that risk.
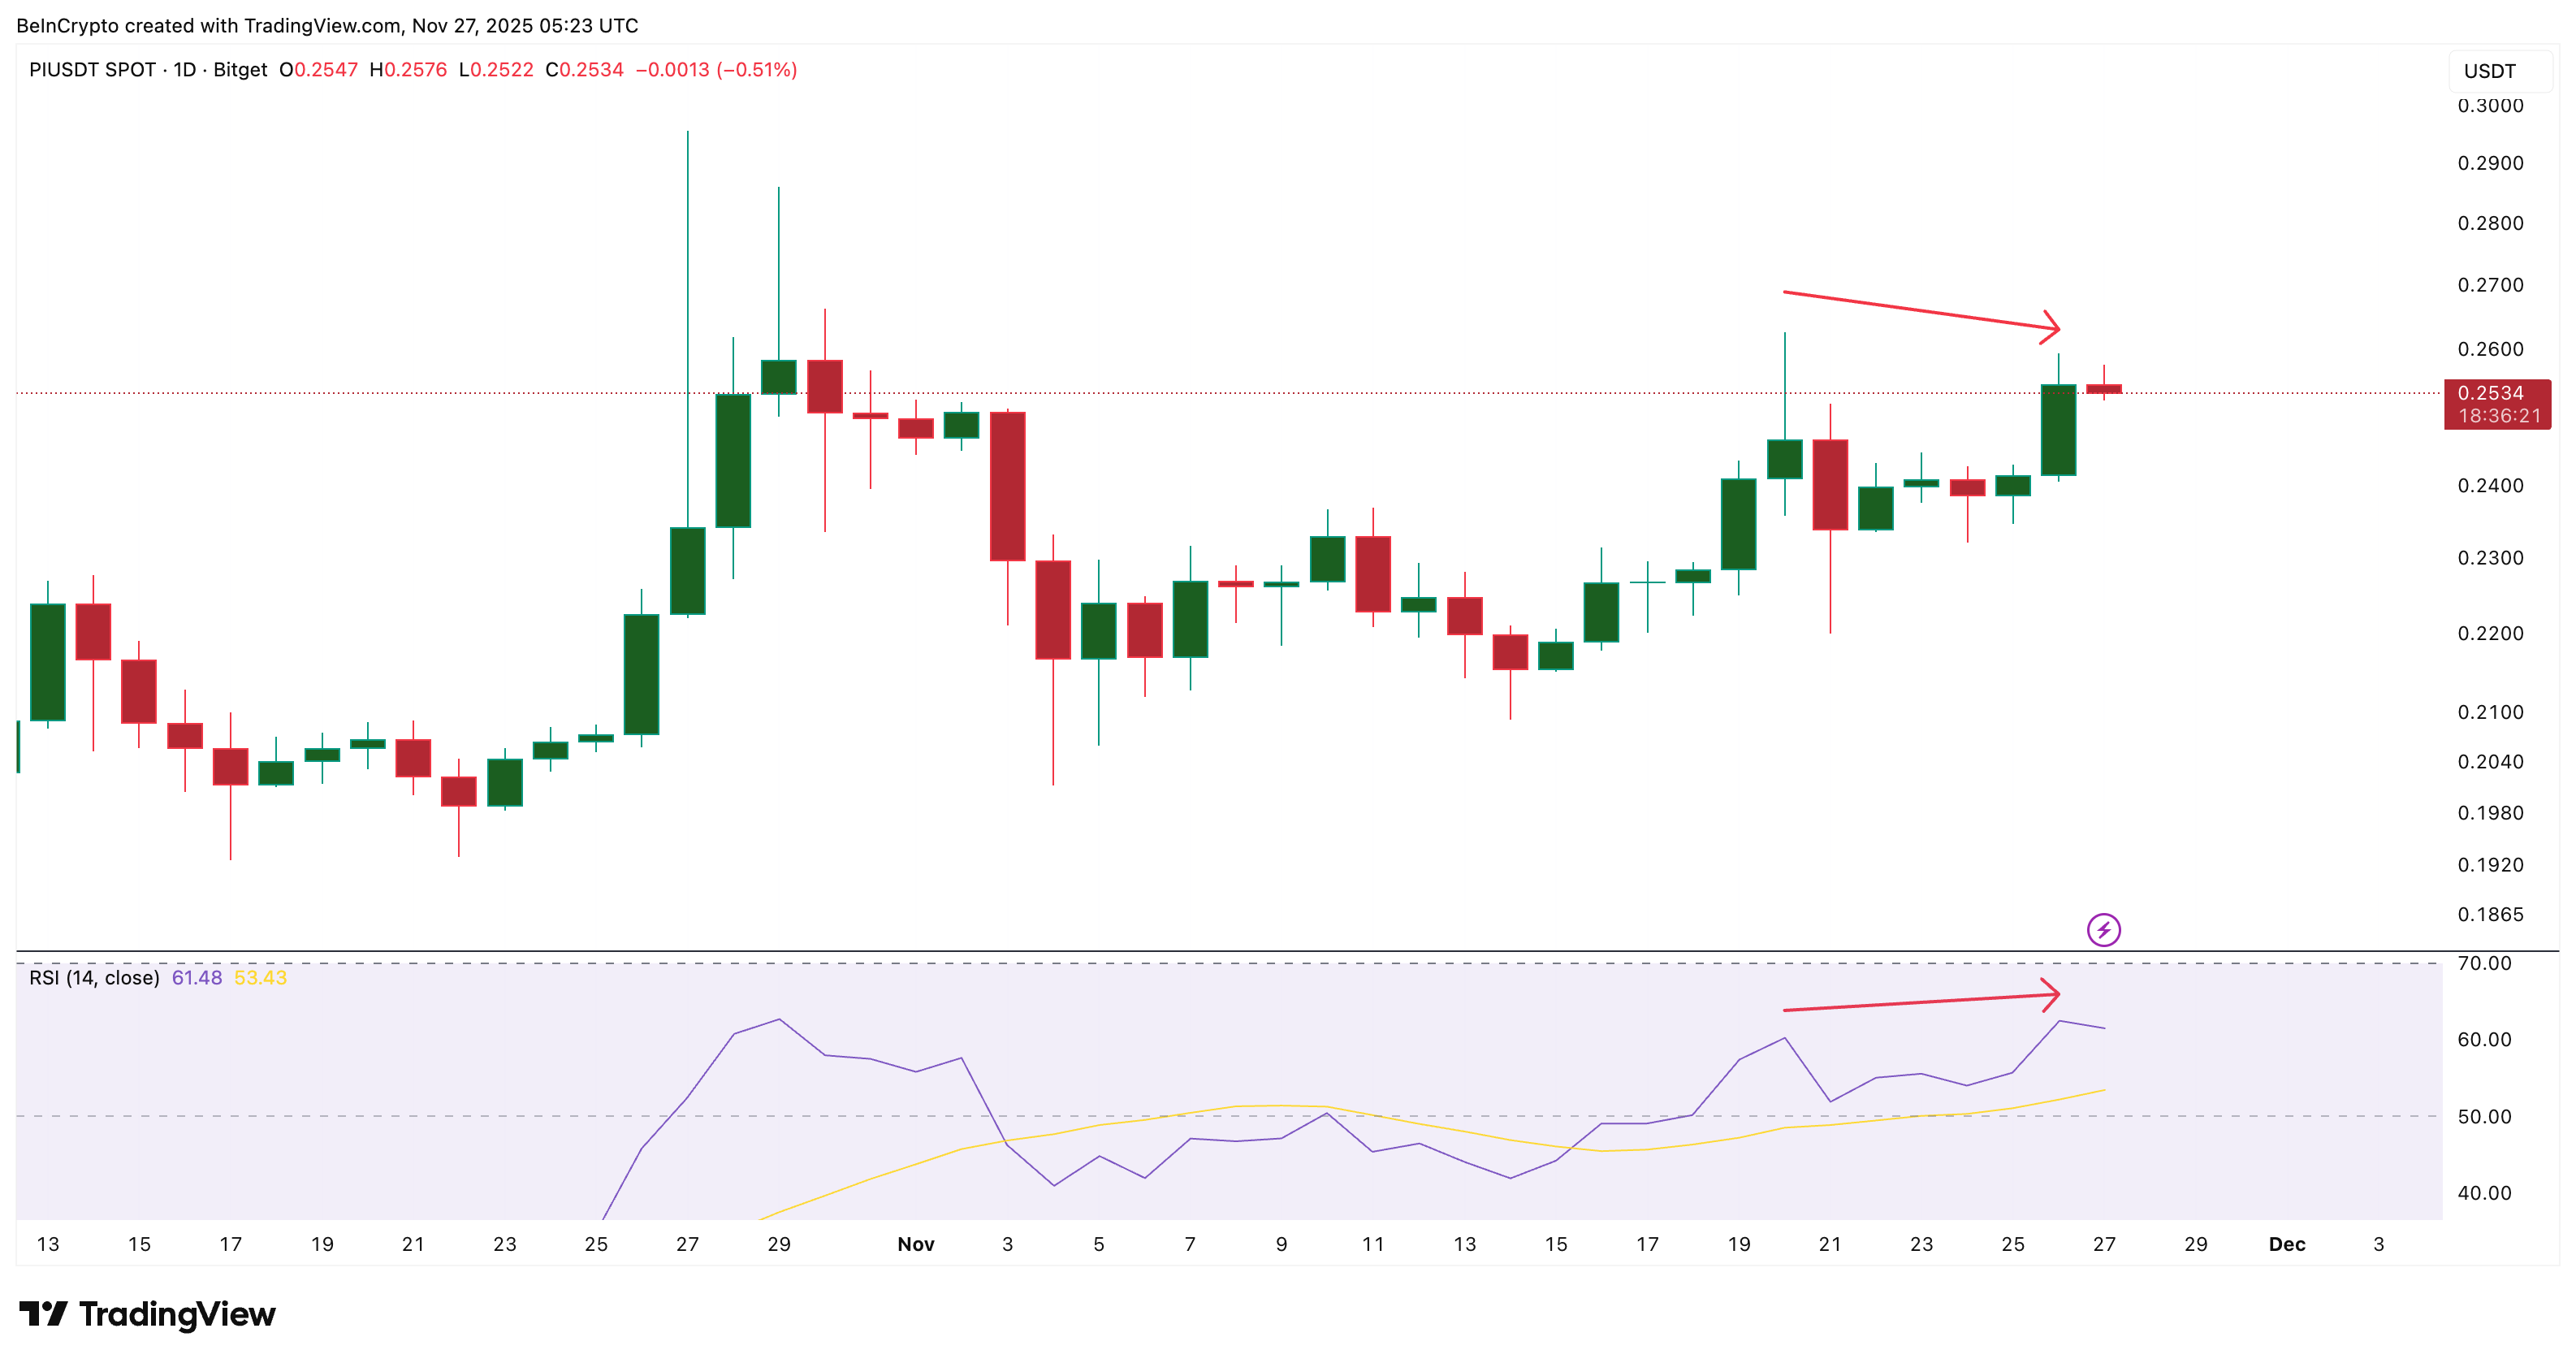
The Relative Strength Index (RSI), which tracks buying and selling strength, has shown hidden bearish divergence. Between November 20 and November 26, Pi Coin made a lower high, while the RSI made a higher high. Hidden bearish divergence usually continues the prevailing trend — and Pi Coin’s broader 30-day trend has been weak, despite the monthly gains.
 Weak Price Action:
TradingView
Weak Price Action:
TradingView
That means the up-move is real, but the underlying structure warns that a pause could flip momentum back to the downside quickly. And that might not be healthy for the Pi Coin price
Key Levels Decide Whether Pi Coin Price Can Keep Climbing
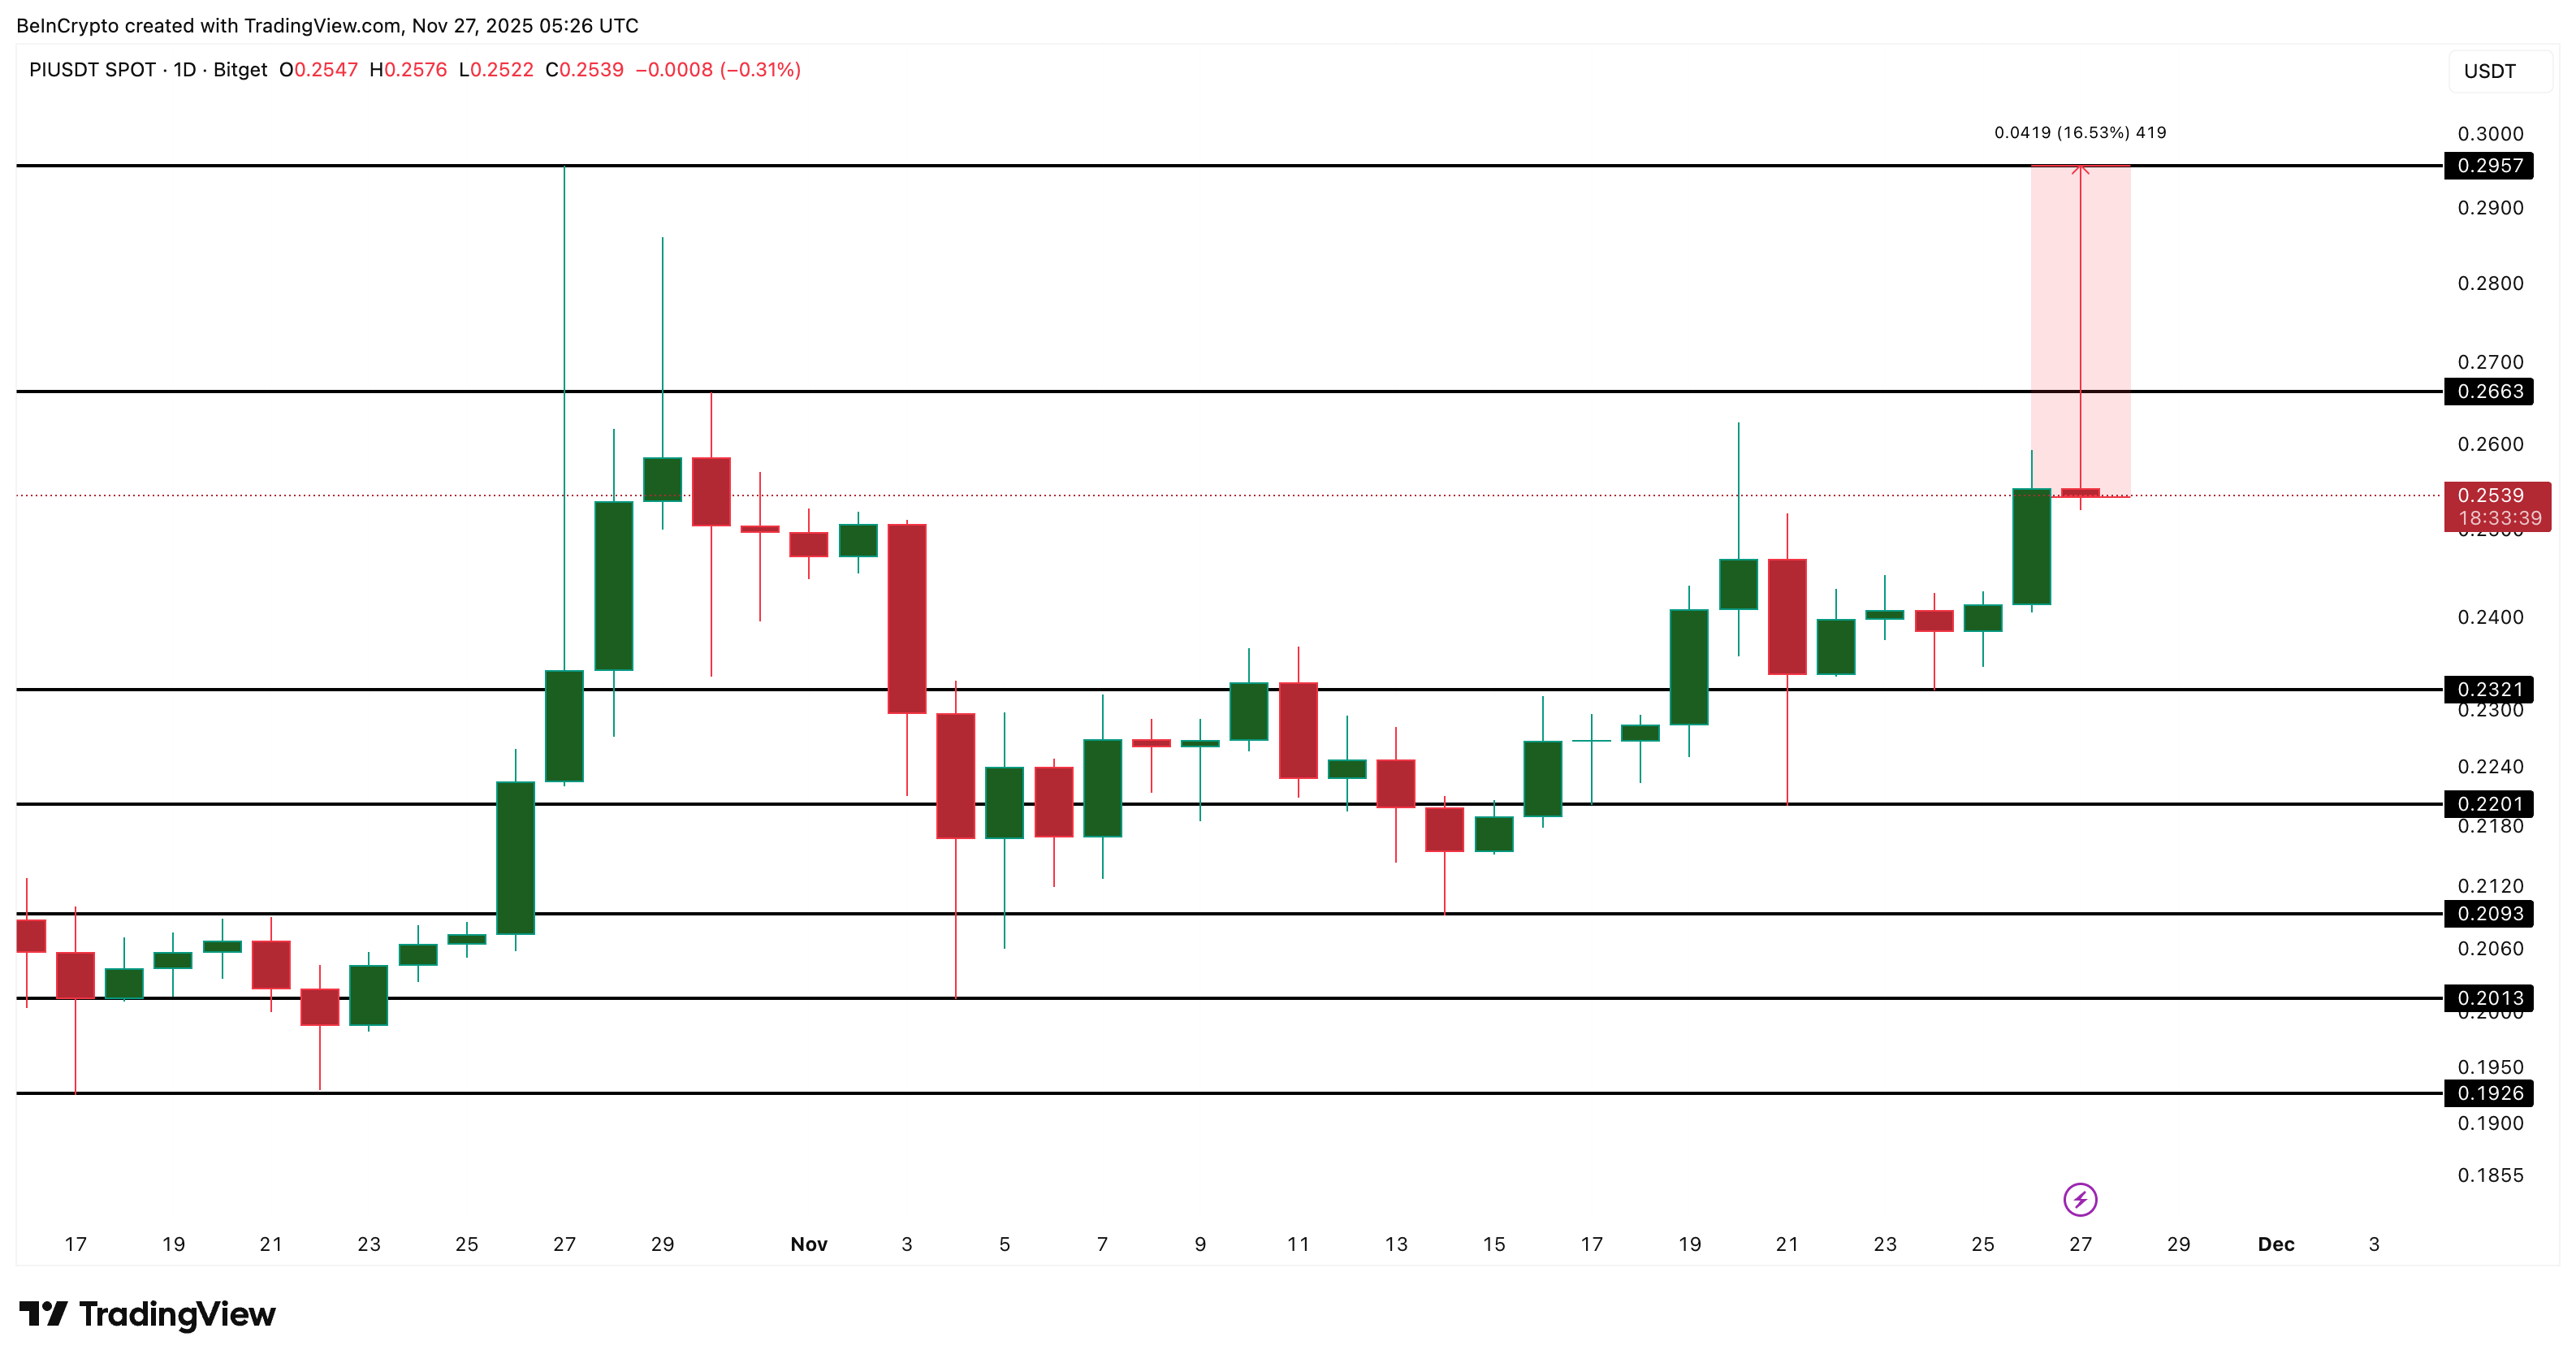
Pi Coin trades near $0.26, but this level doesn’t settle the debate. The key level that breaks the entire bearish pattern is $0.29.
A daily close above $0.29 would invalidate the head-and-shoulders setup and allow Pi Coin to aim higher. That would show the rally still has control. Until that happens, every dip needs attention.
The first support sits near $0.23. Losing that turns focus to $0.20–$0.22, zone. The neckline level discussed earlier falls in this zone.
 Pi Coin Price Analysis:
TradingView
Pi Coin Price Analysis:
TradingView
A daily close below this zone is what triggers the full 34% downside target, pulling Pi Coin toward $0.19 or even lower if market conditions weaken.
So the message is simple:
- If Pi Coin keeps climbing and clears $0.29, the uptrend holds.
- If it slows down and slips under $0.20-$0.22, the breakdown gets triggered.
Right now, Pi Coin cannot afford to “hit the brakes.” Its trend survives only as long as the climb continues.
Read the article at BeInCryptoDisclaimer: The content of this article solely reflects the author's opinion and does not represent the platform in any capacity. This article is not intended to serve as a reference for making investment decisions.
You may also like
Navigating Fluctuating Markets: Insights Gained from Recent Declines in Prices
- 2023-2024 markets saw Fed rate hikes (5.25%-5.50%) then cuts, driving S&P 500/Nasdaq surges led by Magnificent Seven tech stocks. - AI euphoria and Trump-era trade uncertainty created valuation risks, with NVIDIA up 1,150% since 2023 and small-cap/crypto surges. - Historical parallels to 2000 dot-com and 2008 crises highlight dangers of overconcentration in high-growth tech and fragile diversification. - Resilient portfolios require diversification beyond tech, active management (hedge funds/private equi
Anthropological Insights into Consumer Actions in Digital Advertising: Investing Strategically in Culturally Sensitive Advertising Technology
- Digital advertising is transforming via ethnographic research and AI, driven by Farmingdale’s anthropology curriculum and IAB’s AI initiatives. - Ethnographic methods, like TESS, decode cultural behaviors in digital spaces, enabling hyper-segmented campaigns beyond demographics. - IAB’s AI-driven ad tech requires culturally rich data to train models, aligning with privacy standards and regional regulations like GDPR. - Investors should prioritize platforms integrating ethnographic insights with AI, enhan

Cryptocurrency Price Fluctuations and Technical Strategies in the Market After 2025: Assessing Immediate Momentum and Approaches to Risk Control for Tokens Such As
- Pudgy Penguins (PENGU) exhibits extreme 2025 volatility, surging 25% then retreating 30%, with 14.46% volatility metrics highlighting crypto market instability. - Technical indicators show conflicting signals: 4-hour bullish momentum vs. daily bearish patterns, while institutional inflows ($430k) contrast with bearish sentiment (Fear & Greed Index at 28). - Risk management is critical as PENGU faces key thresholds ($0.010 support, $0.014 resistance), with potential for $0.069 rebound or $0.008645 decline
Crypto Presale Activity Spikes Ahead of FED Decision: Mono Protocol and Nexchain Lead the Watchlist