Crypto News Today: Why Is the Crypto Market Down Today?
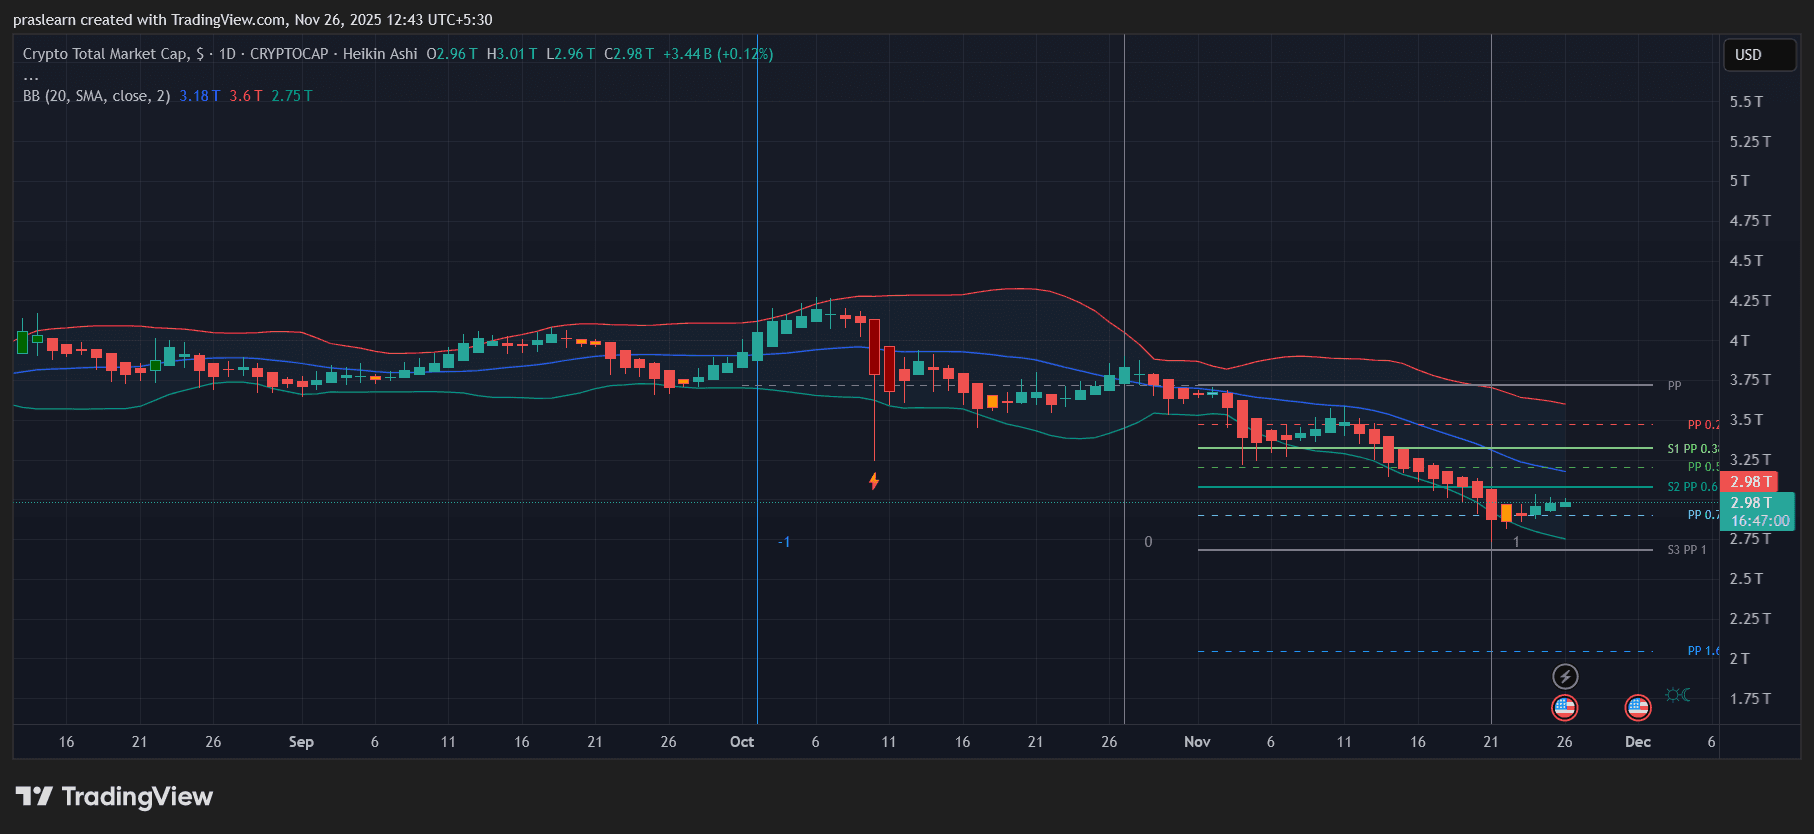
The global crypto market cap slipped 0.84% in the past 24 hours, extending a weekly decline of about 5.4%. The total market capitalization now sits near $2.98 trillion, down from the recent swing high of $3.34 trillion. The TradingView chart shows the market trending below its 30-day simple moving average (SMA), while Heikin Ashi candles continue to print weak momentum and narrow-bodied consolidation — a signal that sellers are still in control, but exhaustion may be setting in.
Crypto Market Overview
 Crypto Market Cap: TradingView
The global crypto market cap slipped 0.84% in the past 24 hours, extending a weekly decline of about 5.4%. The total market capitalization now sits near $2.98 trillion, down from the recent swing high of $3.34 trillion. The TradingView chart shows the market trending below its 30-day simple moving average (SMA), while Heikin Ashi candles continue to print weak momentum and narrow-bodied consolidation — a signal that sellers are still in control, but exhaustion may be setting in.
Regulatory Pressure Is Weighing on Sentiment

South Africa’s central bank sounded fresh alarms this week about the risks of unchecked crypto growth, highlighting that 7.8 million local users and $1.5 billion in assets now sit outside formal regulatory oversight. This comes right after the U.S. SEC began scrutinizing Fed chair candidate Kevin Hassett’s ties to Coinbase, adding another layer of political friction.
For traders, this means one thing: uncertainty. Each new regulatory headline reinforces caution, particularly among institutional investors who prefer compliant exposure via ETFs or regulated custodians. Altcoins, already more volatile, feel the pressure first as liquidity thins out and speculative positions unwind.
Derivatives Market Undergoing a Reset
A key reason behind the current correction is the derivatives unwind. Open interest fell 2.9% to $781 billion, suggesting traders have been cutting leverage-heavy positions. Perpetual funding rates collapsed 4,804% to near-flat at +0.00186%, signaling that bullish enthusiasm is fading fast.
Interestingly, Bitcoin liquidations dropped by 87% to just $2.21 million, which implies most of the excessive leverage has already been flushed out. That can be healthy — it removes the risk of cascading liquidations that accelerate sell-offs. However, it also tells us the bulls are no longer confident enough to rebuild large long positions until new catalysts appear.
Technical Breakdown: Below Key Fibonacci Levels
From a technical perspective, the chart paints a clear bearish bias. The total market cap has broken below both the 30-day SMA (3.34T) and the 50% Fibonacci retracement, confirming a mid-term downtrend. Current price action near $2.98T sits just above the 78.6% retracement zone at $2.75T, which serves as the last significant support before the next leg lower.
Bollinger Bands are widening, reflecting heightened volatility, while the RSI(14) has dipped to 25.9, indicating oversold conditions. That could trigger a short-term relief bounce, but the lack of a reversal candle on Heikin Ashi suggests it’s premature to call a bottom yet.
What to Watch Next?
The next 48 hours will be crucial. Two events could shift market direction:
- Fed liquidity data due Friday — If liquidity injections remain steady, risk assets (including crypto) could find footing.
- Bitcoin’s $85K level — This remains the psychological anchor. A rebound above that could restore confidence and lift altcoins.
Meanwhile, on-chain data from Santiment shows whales quietly accumulating during the dip, even as retail traders panic sell. This divergence often precedes a reversal phase, but timing it requires confirmation — ideally a bullish engulfing candle on the total market cap chart or a clear reclaim of the $3.1T pivot.
The crypto market’s weakness today stems from a mix of regulatory jitters, leveraged position resets, and technical breakdowns. The good news? The market is entering deeply oversold territory, and with leveraged longs cleared out, volatility may soon compress into a recovery setup.
If $BTC stabilizes above $85K and total market cap reclaims the $3.1T–$3.2T range, a short-term relief rally could follow. Until then, expect choppy sideways action and a cautious tone from traders who’ve just witnessed one of the sharpest derivative cooldowns in months.
Disclaimer: The content of this article solely reflects the author's opinion and does not represent the platform in any capacity. This article is not intended to serve as a reference for making investment decisions.
You may also like
U.S. Senate Set for December Vote on Crypto Market Structure Bill
Is XRP the Next Asset States Will Consider for Their Balance Sheets?
Thailand to Introduce 0% Tax on Bitcoin Gains Traded on Local Exchanges
Bitcoin News Update: MSTR Faces $2.8B Withdrawal Threat, Fueling Bitcoin Price Fluctuations
- Bitcoin faces pressure to drop below $80,000 as technical bearish signals, ETF outflows, and MSTR risks converge. - MSTR's potential MSCI exclusion could trigger $2.8B outflows, amplifying volatility for Bitcoin and institutional portfolios. - Texas and Abu Dhabi expand Bitcoin holdings while institutions shift to direct exposure amid ETF redemption trends. - Regulatory uncertainty and liquidity constraints challenge Bitcoin's $100,000 trajectory despite sustained institutional demand.
