
Pi Coin Needs a 4% Push to Turn Recovery Into Rally — But a 5% Risk Still Lingers

Pi Coin price is down about 1.5% today, but its 7-day gain of 6.1% still beats the rest of the crypto market. It is also up around 15% this month, while Bitcoin has fallen nearly 20%. That shows how negatively correlated Pi has been, one of the reasons it keeps holding green candles even in
Pi Coin price is down about 1.5% today, but its 7-day gain of 6.1% still beats the rest of the crypto market. It is also up around 15% this month, while Bitcoin has fallen nearly 20%. That shows how negatively correlated Pi has been, one of the reasons it keeps holding green candles even in weak conditions.
But the move has been stuck in a narrow band between $0.24 and $0.22 since November 17. The chart now shows a tight 4–5% window where Pi Coin could break either up or down, depending on how a few signals resolve.
Large Buyers Still Supporting the Bounce
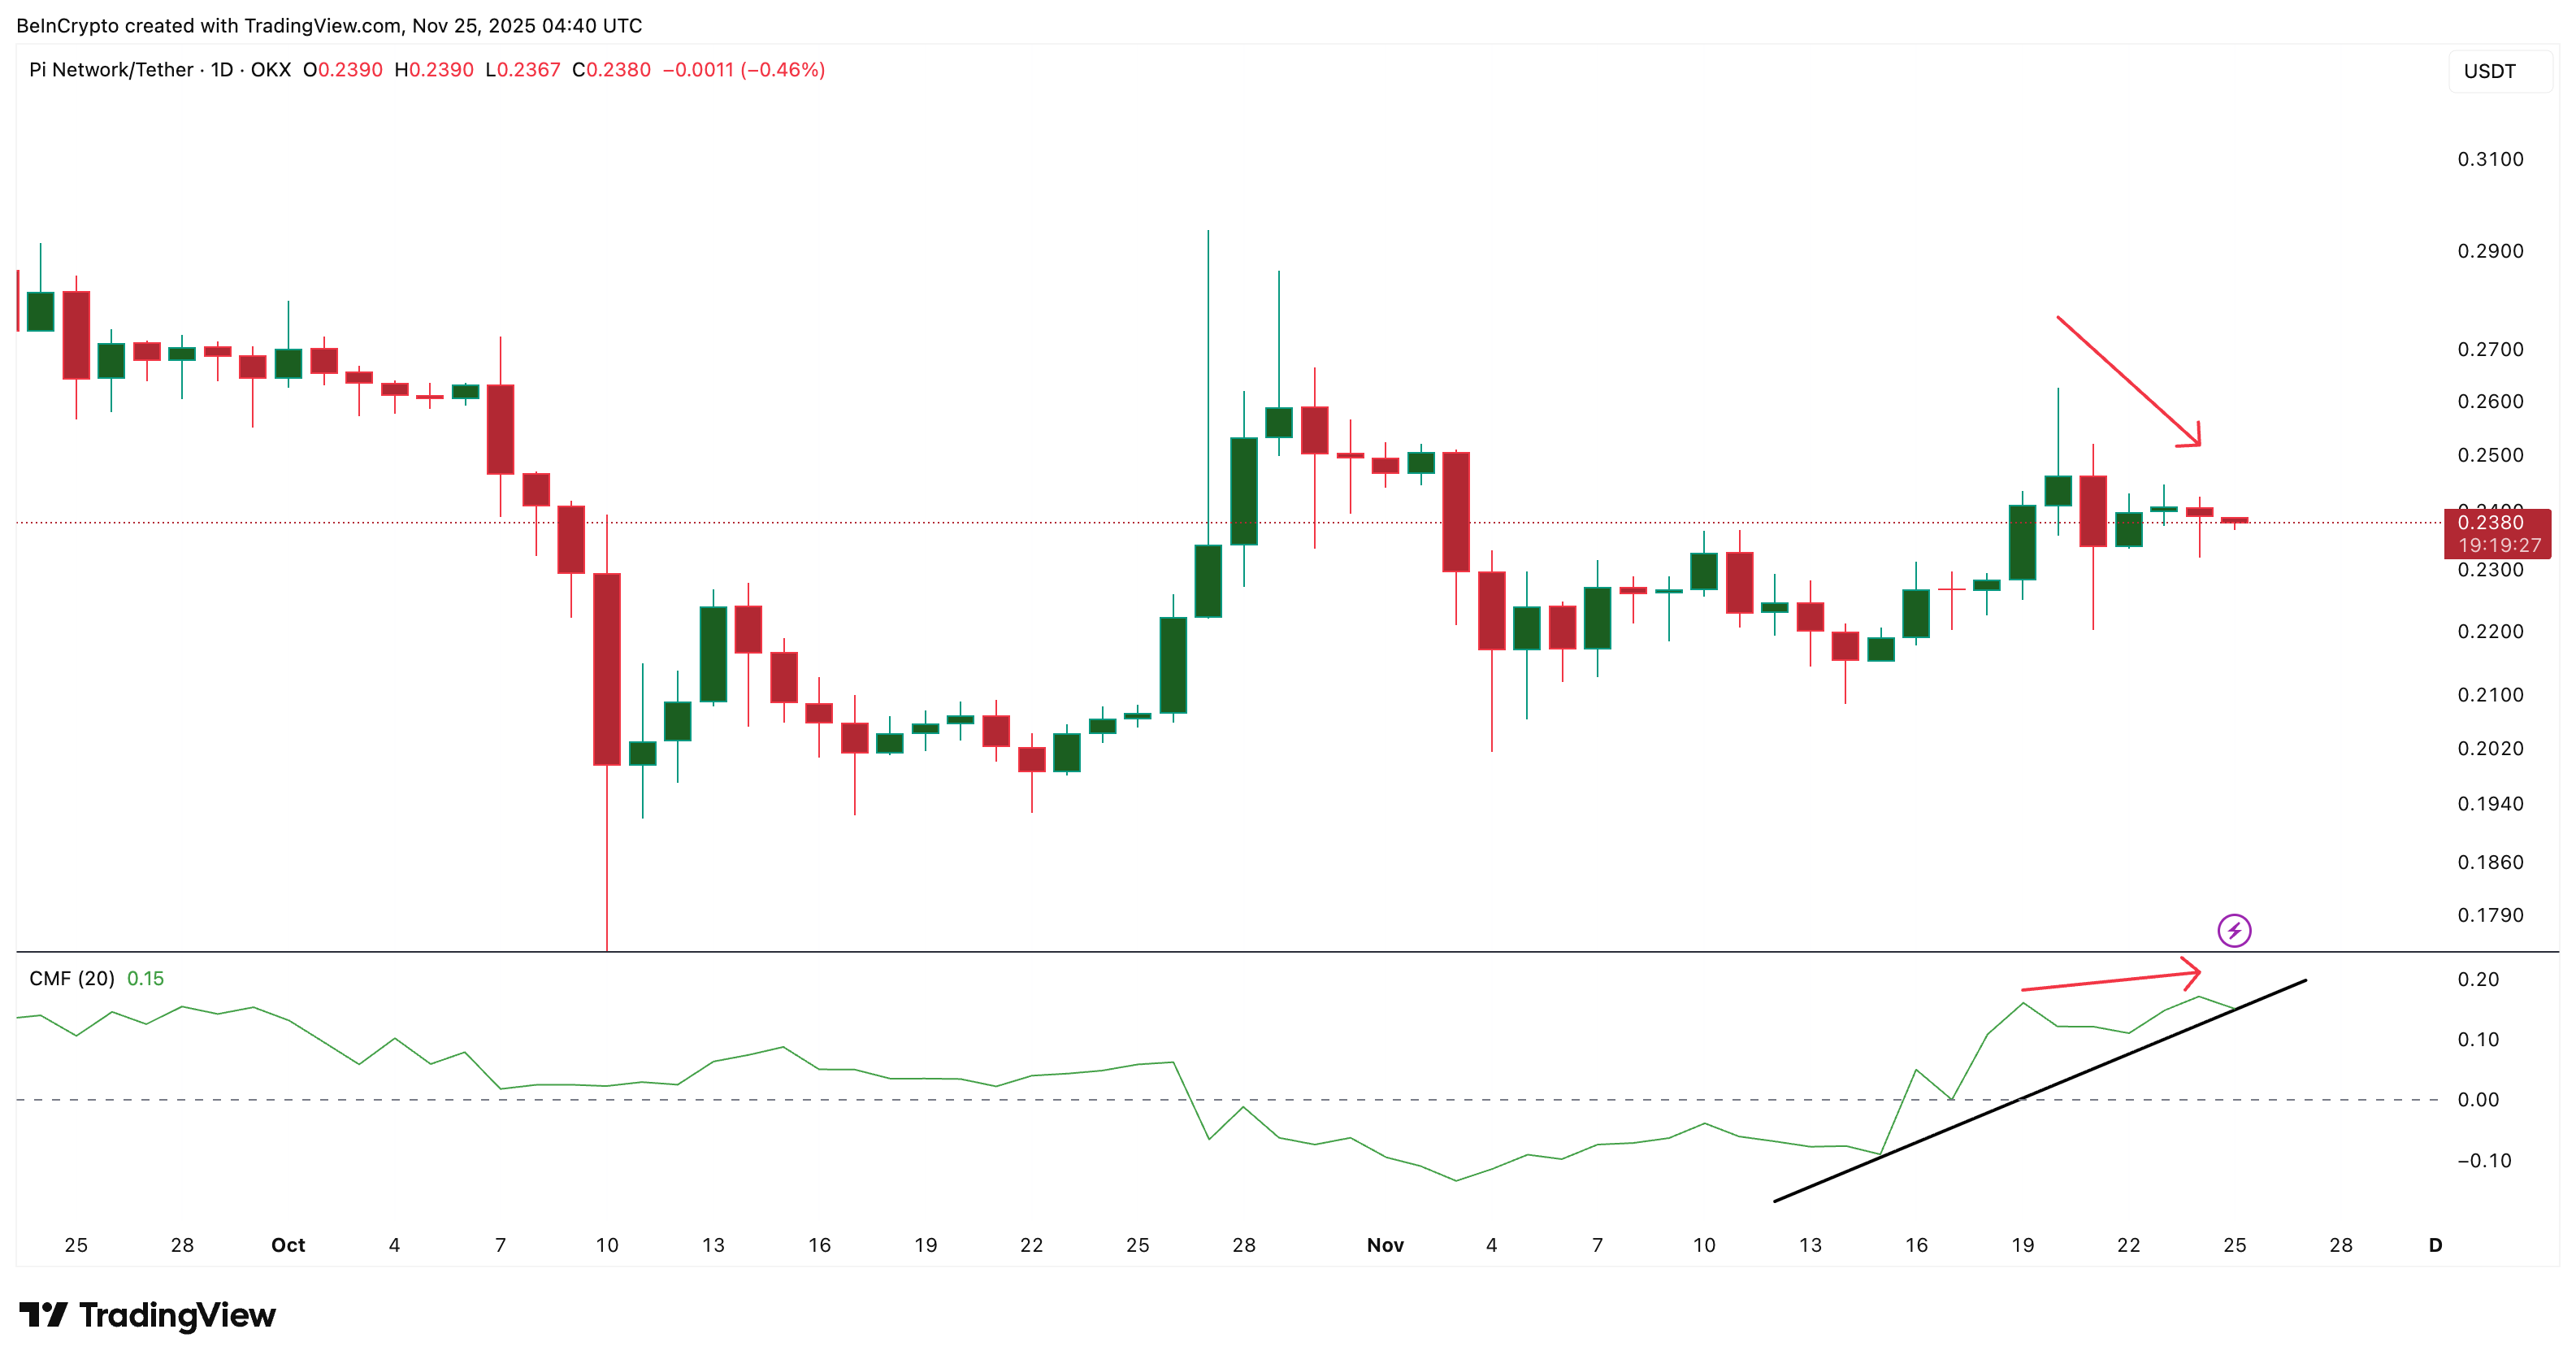
Pi Coin has one strong positive signal: bigger wallets continue to support the move.
Between November 19 and November 24, the price made a lower high while the Chaikin Money Flow (CMF) made a higher high. CMF measures whether big wallets are adding or exiting. This is a bullish divergence, meaning accumulation is happening even as price slows.
 Money Flow Looks Strong:
TradingView
Money Flow Looks Strong:
TradingView
Want more token insights like this? Sign up for Editor Harsh Notariya’s Daily Crypto Newsletter.
CMF is also holding above its trendline and above zero. As long as it stays above that line, large-wallet support remains in place, and the bounce stays alive.
This is the only clean bullish signal the Pi Coin price has right now.
Retail Strength Is Weak, And Volume Support Is Missing?
Smaller buyers are not showing the same energy.
Between November 21 and November 24, the Pi Coin price made a higher low, but the Money Flow Index (MFI) made a lower low. MFI tracks dip-buying strength by combining price and volume. This is a bearish divergence, showing weaker retail buying.
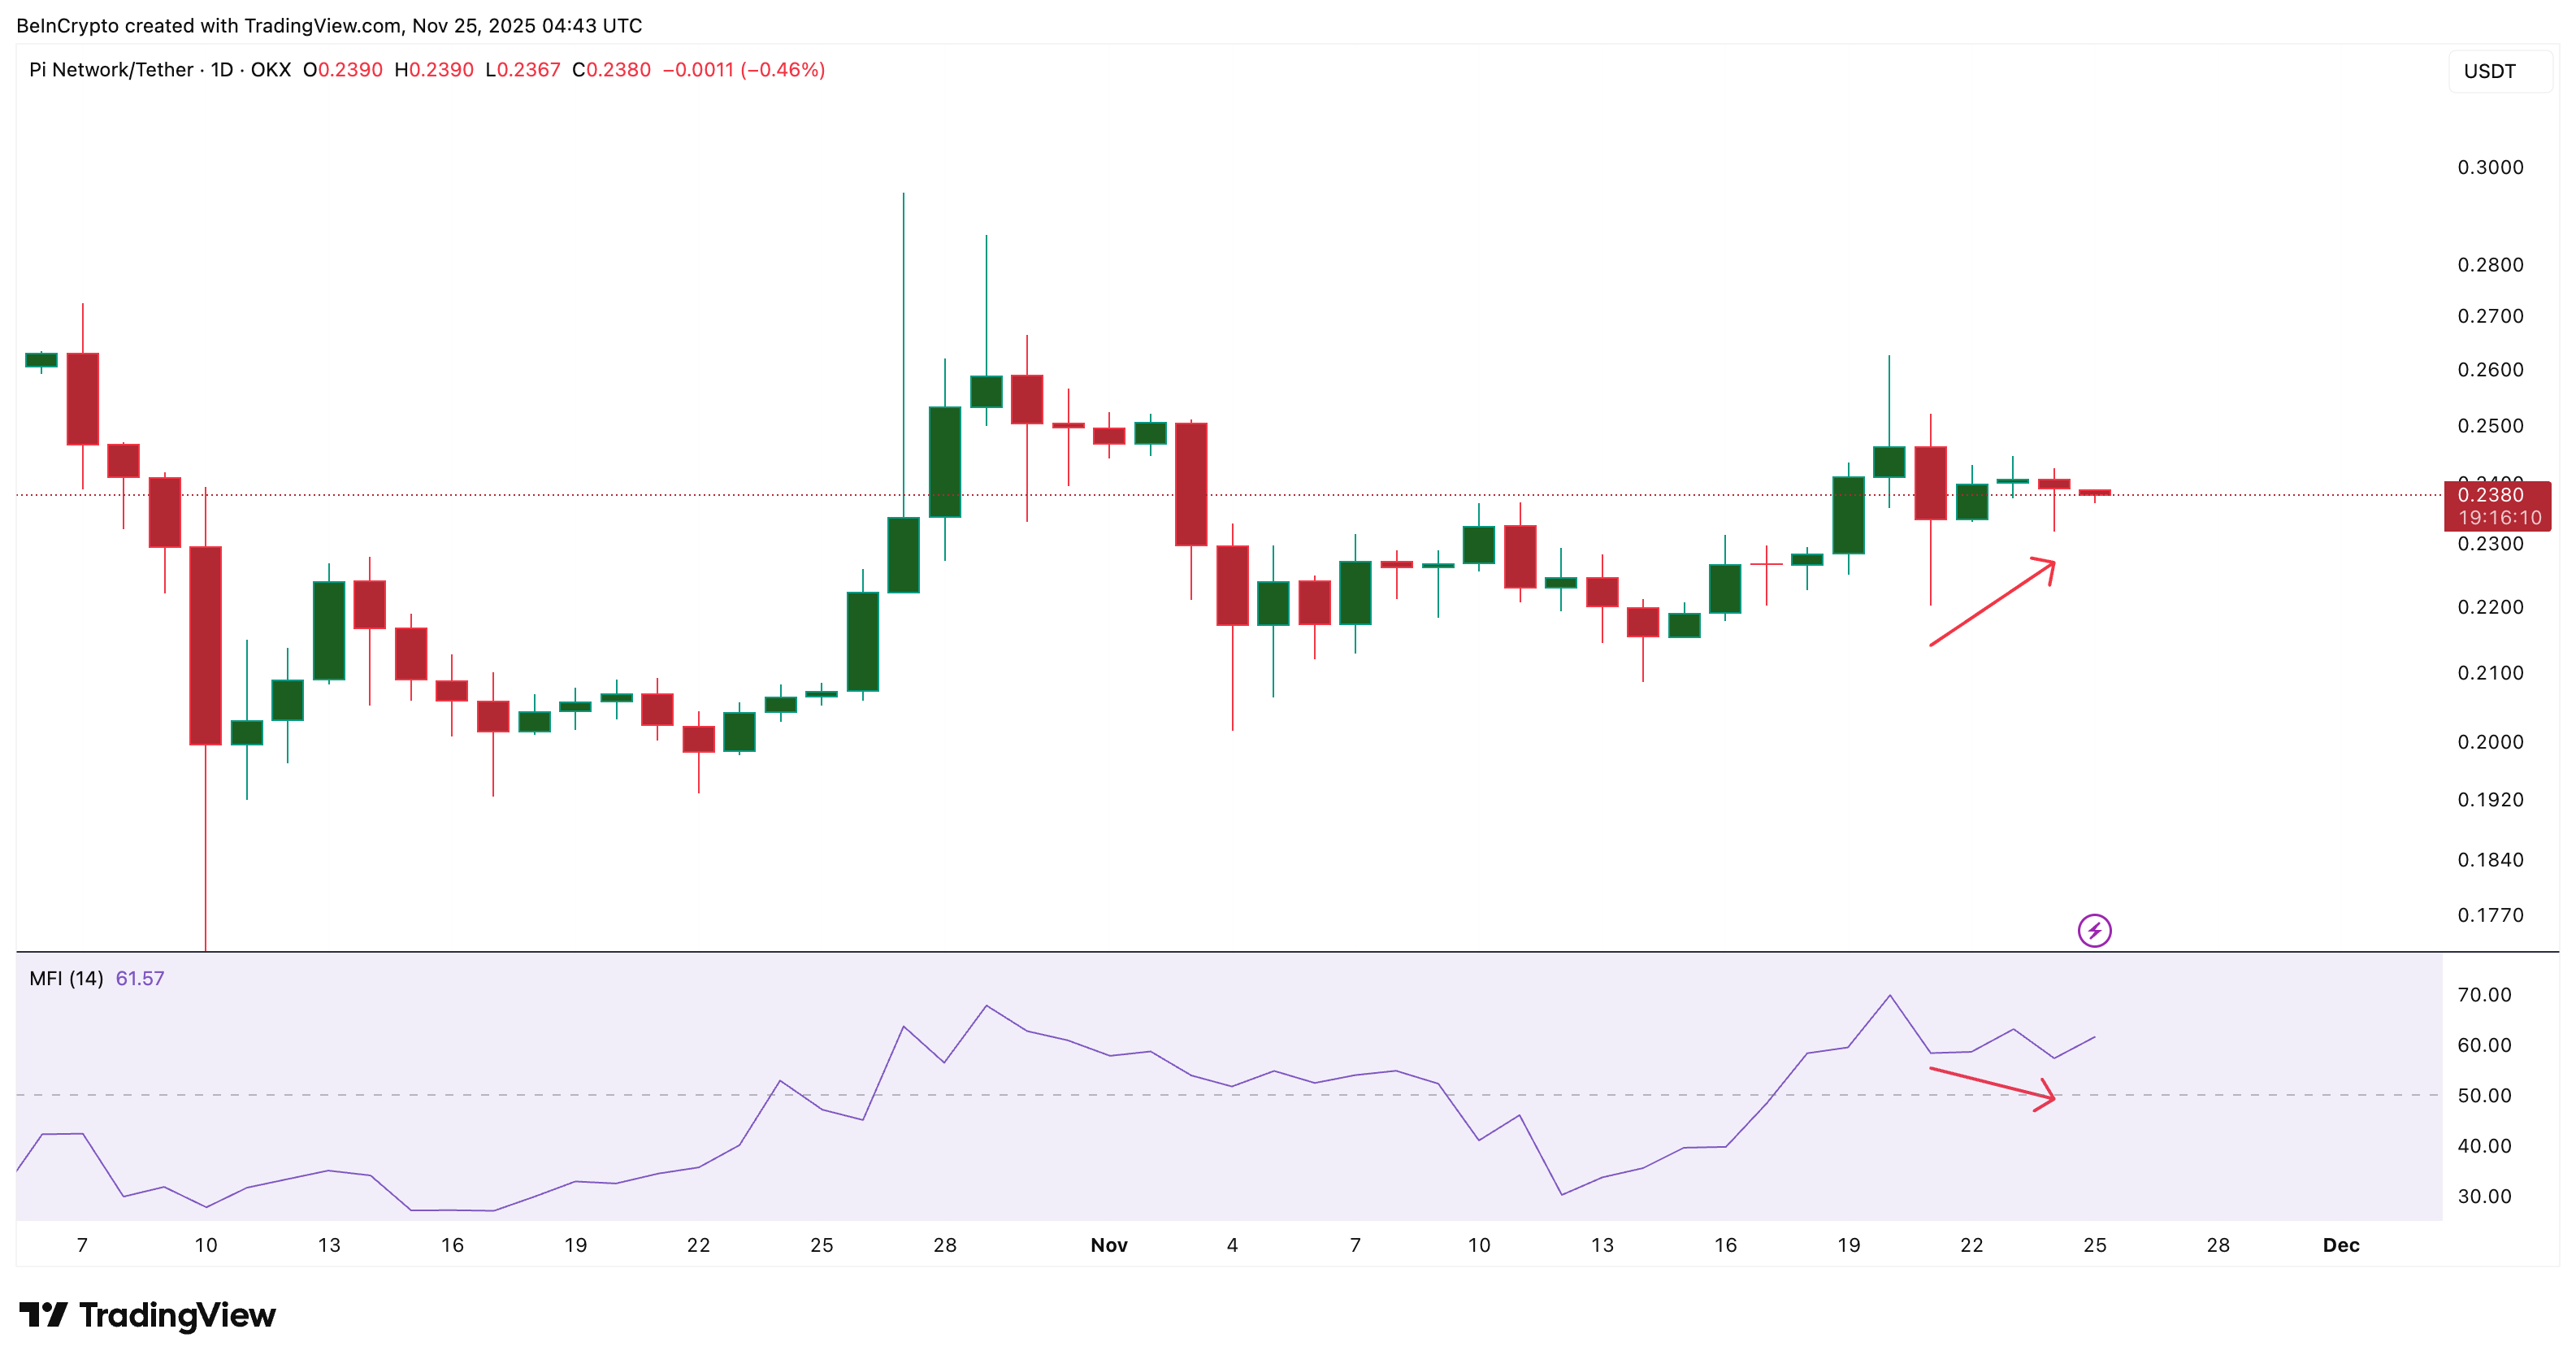 Weak Dip Buying Risks A PI Dip:
TradingView
Weak Dip Buying Risks A PI Dip:
TradingView
Volume confirms the same risk.
On-Balance Volume (OBV) is still below its key trendline near –1.97 billion. OBV measures whether fresh volume is entering the market. Until it breaks above that trendline, PI does not have enough participation for a strong breakout. And, a dip under the ascending trendline could weaken the volume support further.
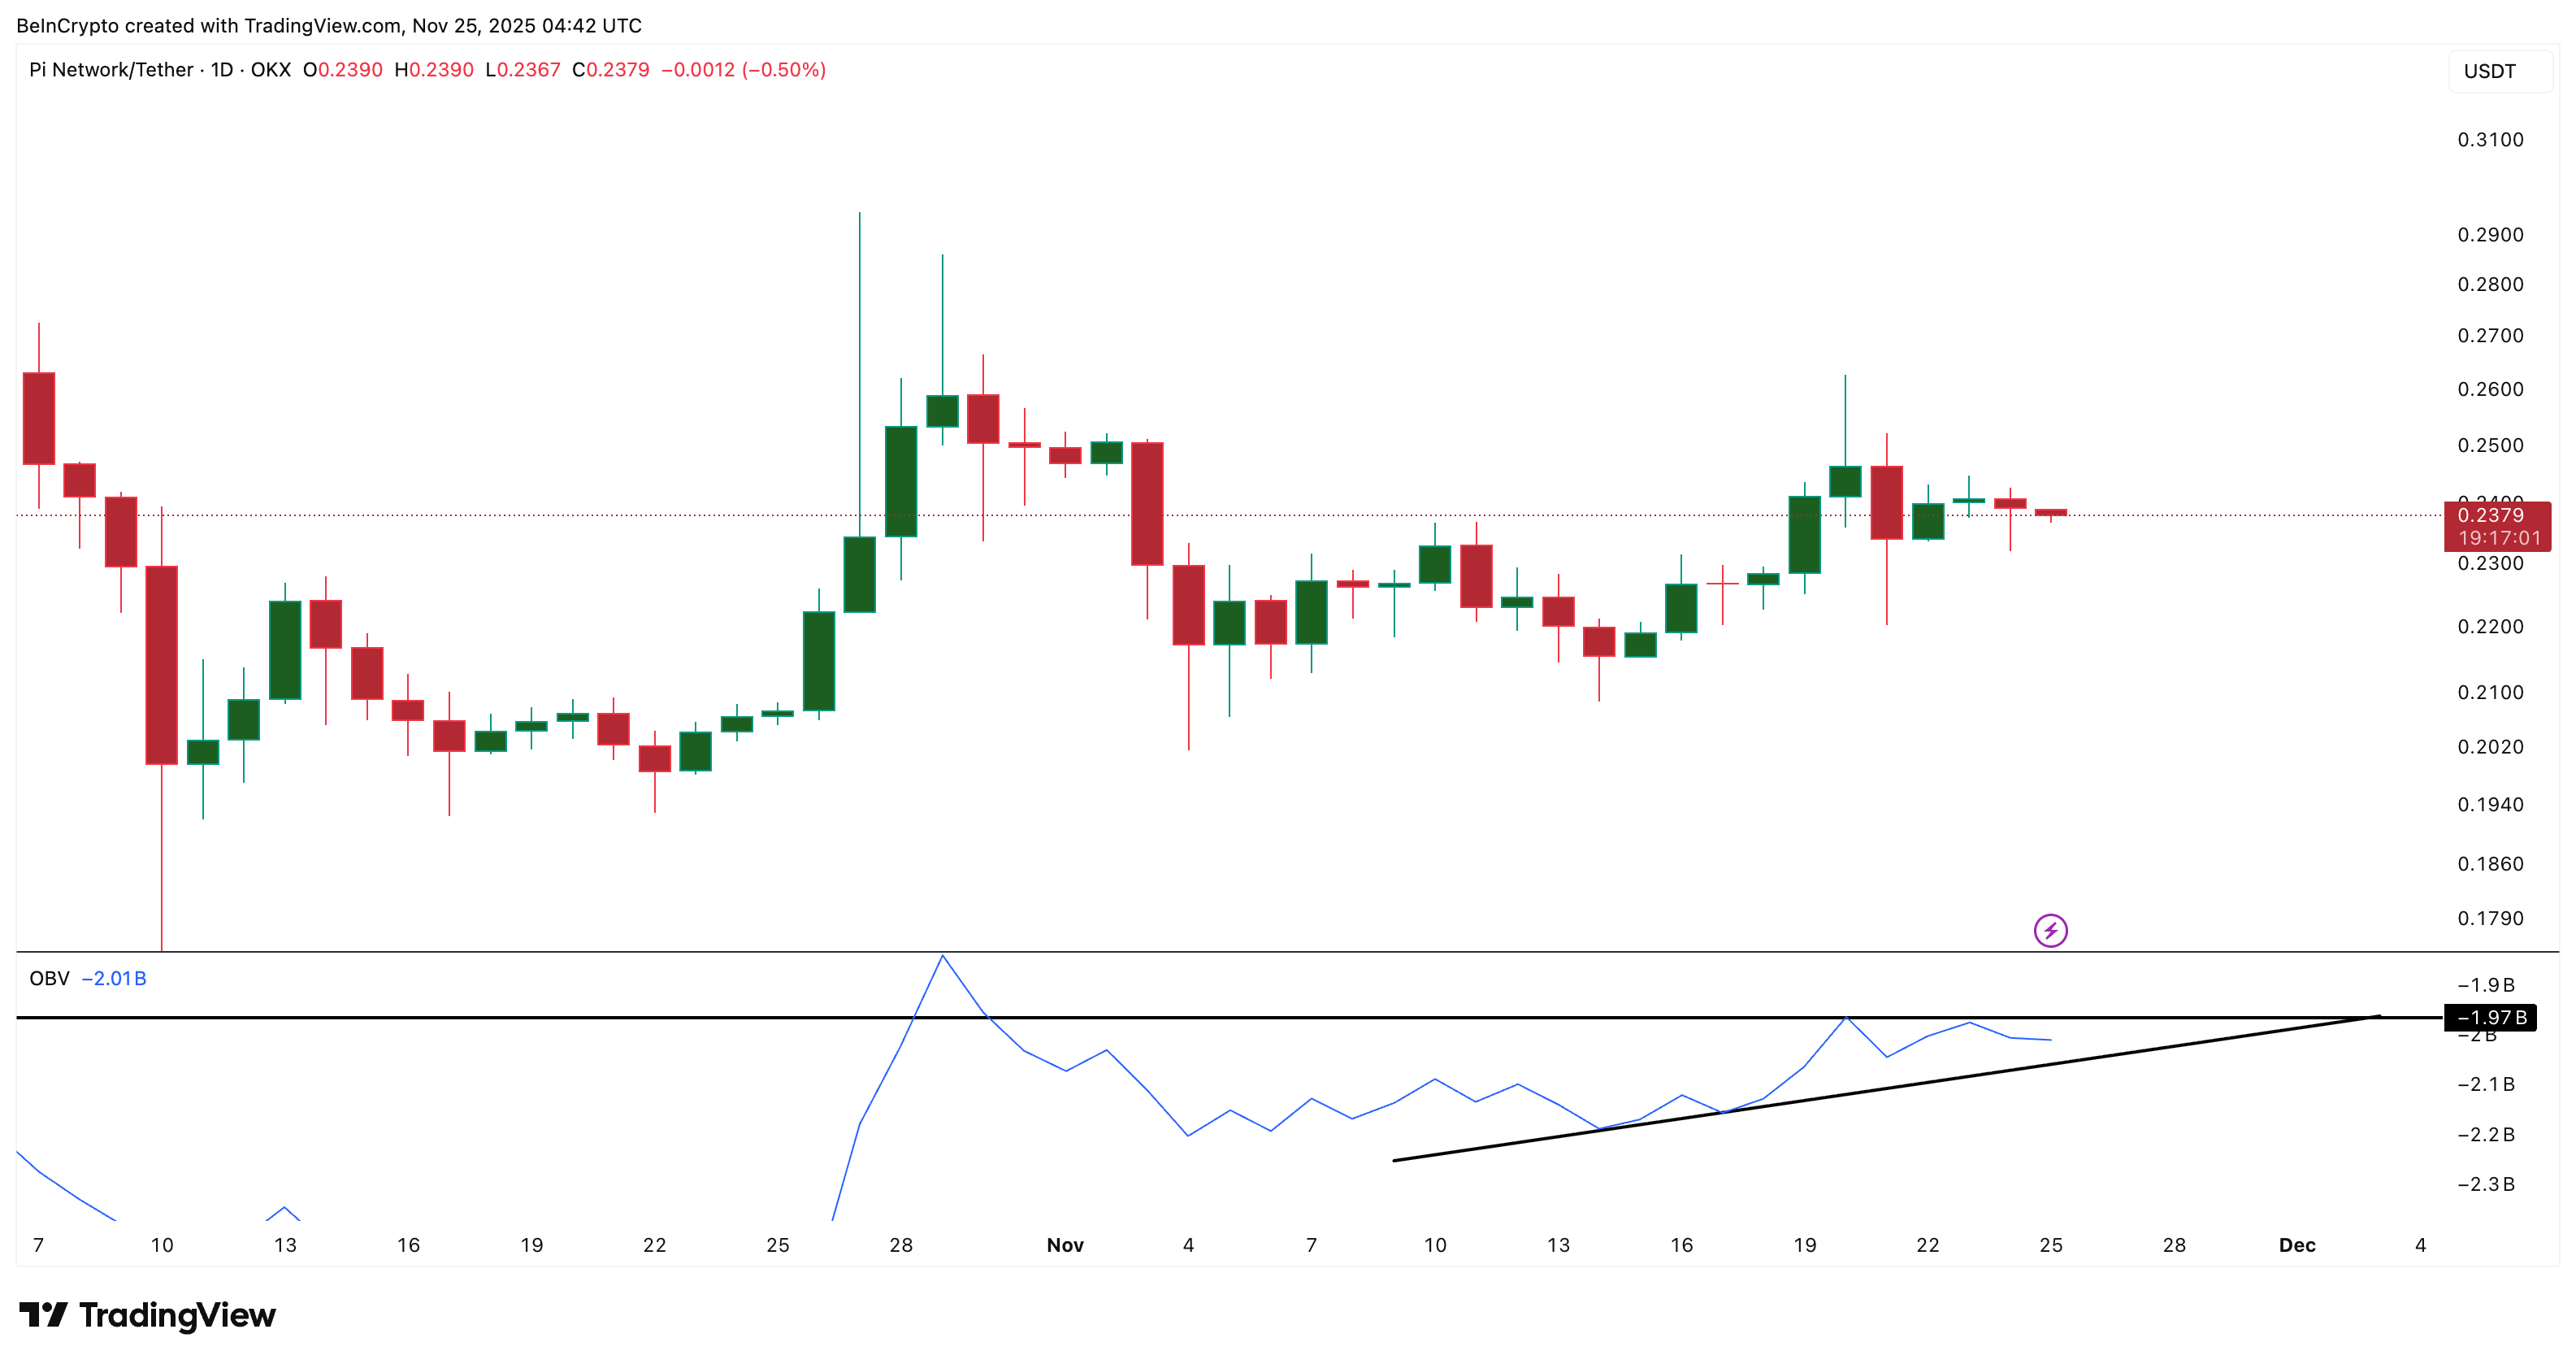 Volume Support Could Be The Pi Coin Price Decider:
TradingView
Volume Support Could Be The Pi Coin Price Decider:
TradingView
In short, big wallets remain supportive, but retail buying is still weak. Volume remains neutral and might be the indicator that decides the next Pi Coin price move.
Pi Coin Price: A 4% Breakout Or A 5% Breakdown
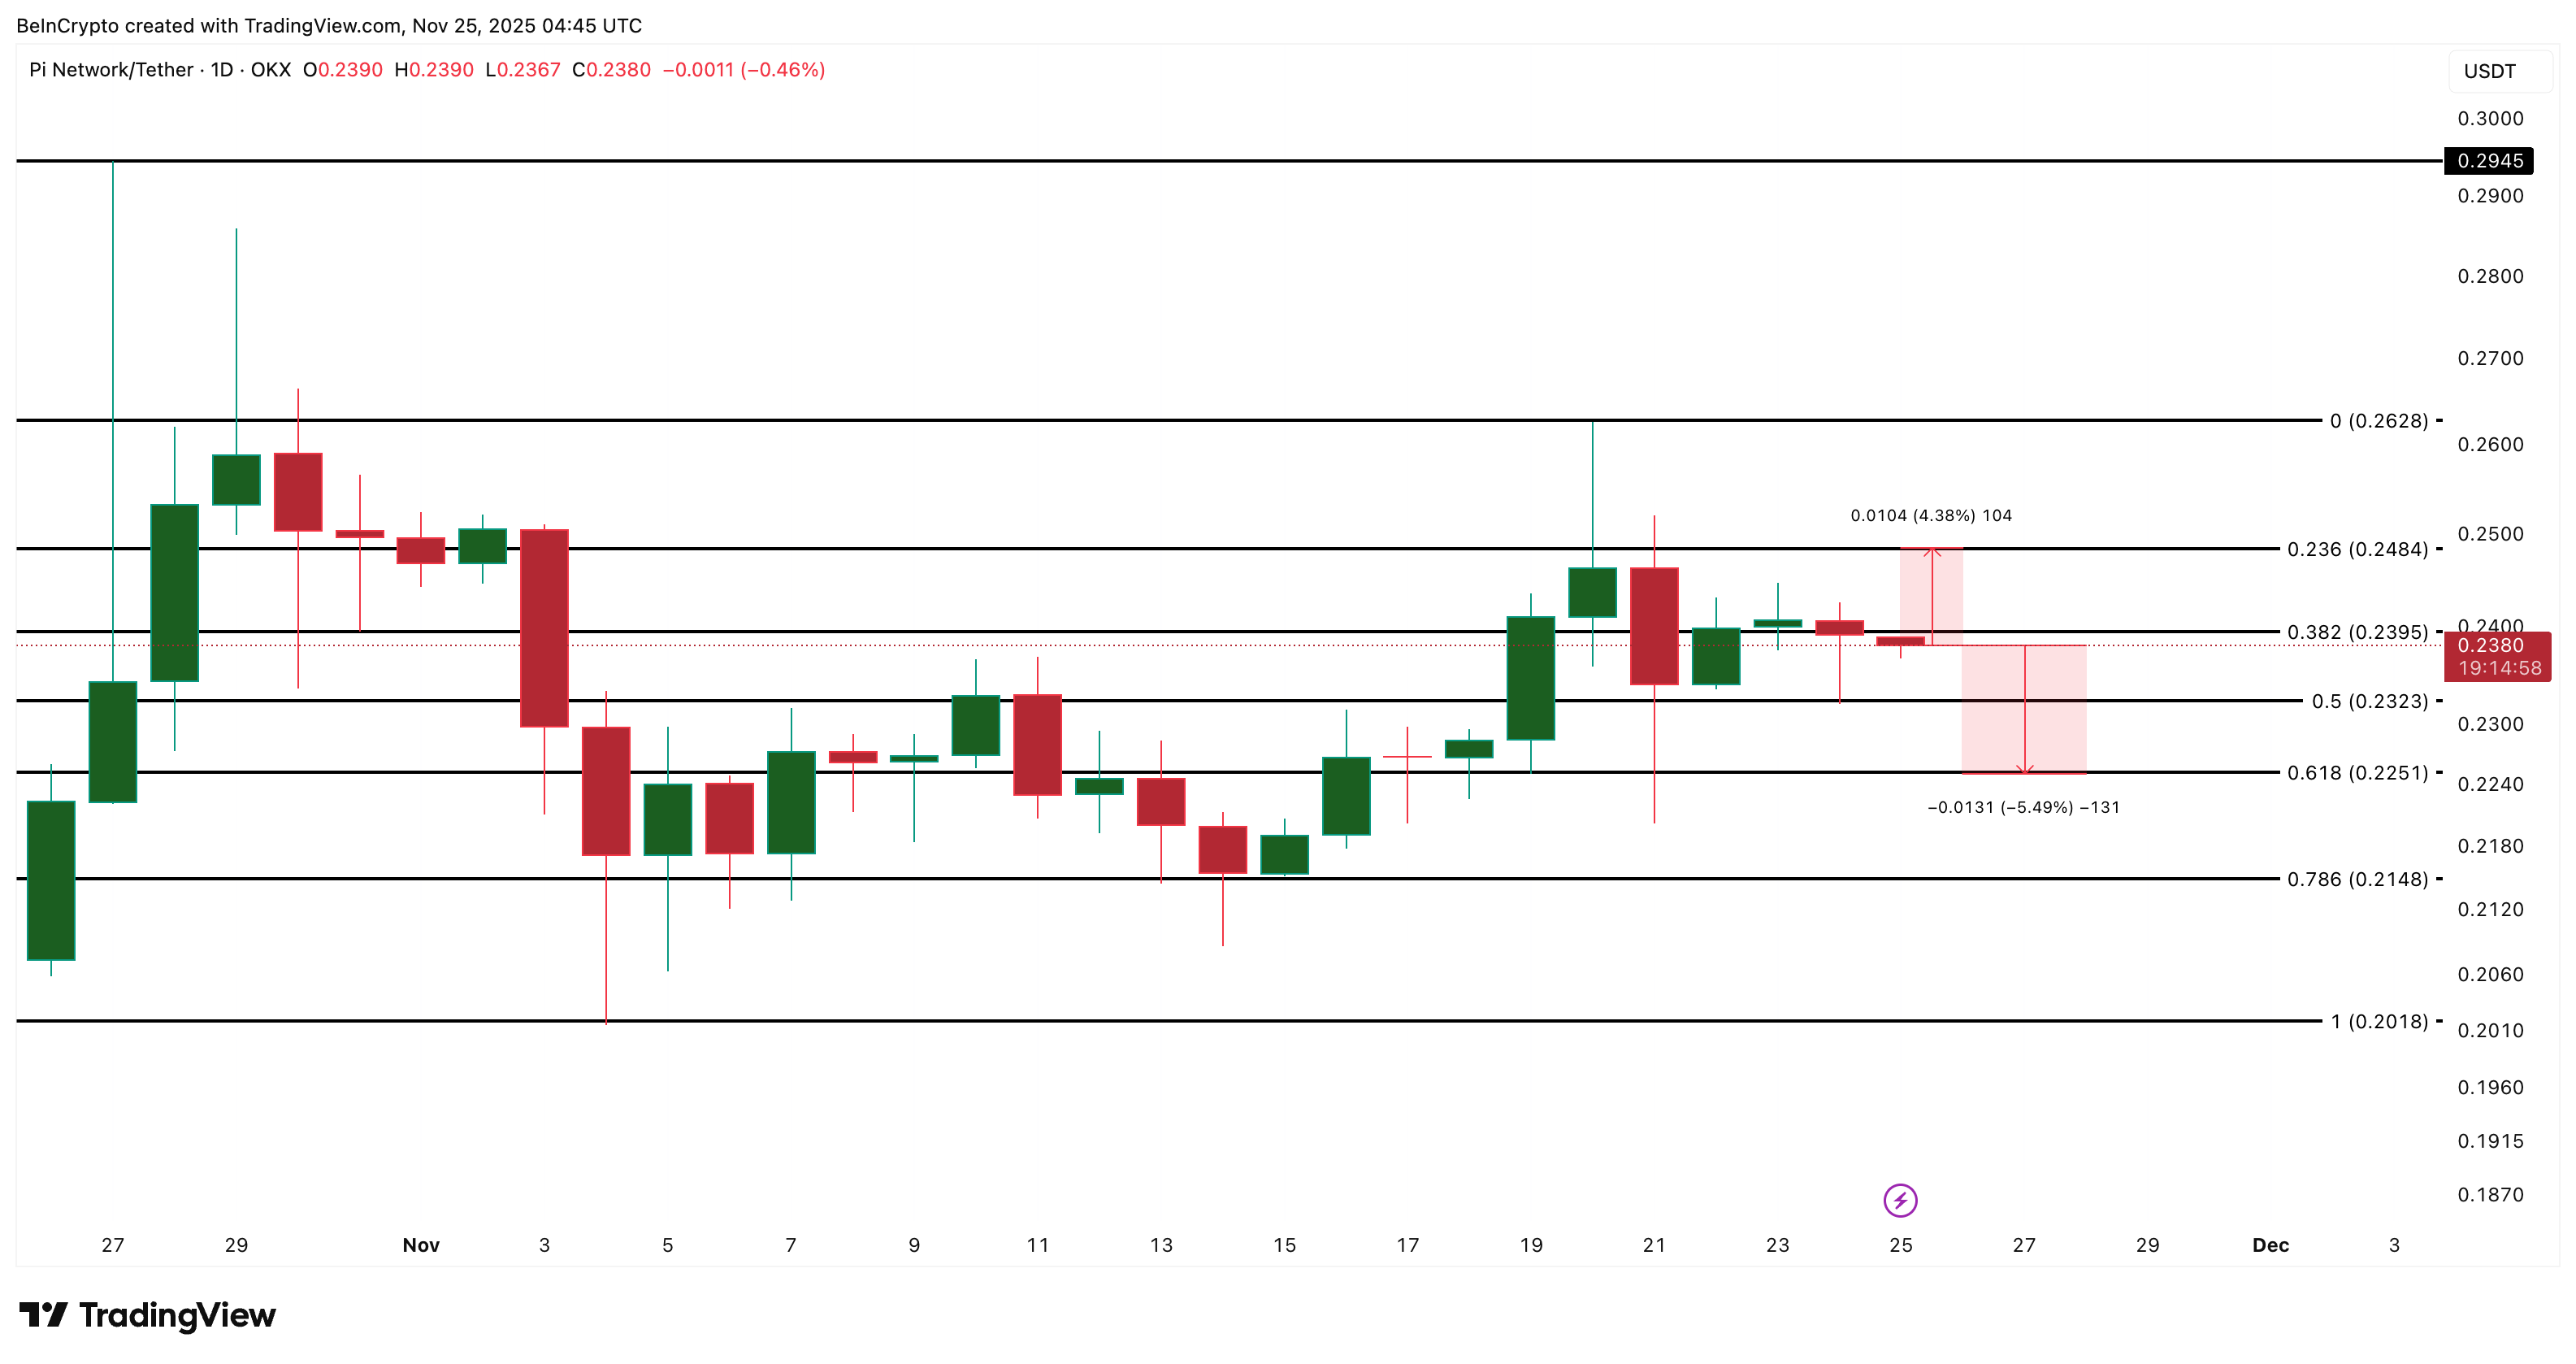
PI must break $0.24 to turn this recovery into a real rally. That level requires a 4.38% move and opens the door toward $0.26 and $0.29 if volume strengthens.
But the breakdown is close as well. A fall under $0.22 exposes $0.21. Dropping below $0.22 would mark a 5.49% decline and align with the bearish MFI divergences and neutral OBV.
 Pi Coin Price Analysis:
TradingView
Pi Coin Price Analysis:
TradingView
Right now, Pi Coin sits at a point where both outcomes remain equally close:
- CMF keeps the bounce alive and can help with the 4% upmove
- MFI and OBV keep pressure on the downside, exposing the 5% risk.
A clean break above $0.24 confirms strength. A clean drop under $0.22 confirms weakness. Either way, the Pi Coin price range could break soon.
Disclaimer: The content of this article solely reflects the author's opinion and does not represent the platform in any capacity. This article is not intended to serve as a reference for making investment decisions.
You may also like
The BTC Collapse: Examining the Triggers and Consequences for 2026
- Bitcoin's 2026 collapse risk stems from leverage, quantum threats, and macroeconomic fragility, mirroring 2008/1929 crises. - Leverage-driven liquidation loops and corporate Bitcoin holdings create self-fulfilling price cascades across crypto and traditional markets. - Quantum computing could break Bitcoin's cryptography, while regulatory uncertainty amplifies systemic risks in its financialized ecosystem. - Historical parallels highlight recurring patterns of speculative excess and leverage, urging robu

The Bitcoin Leverage Liquidation Dilemma: How Investor Actions and Systemic Threats Shape a Financialized Cryptocurrency Market
- October 2025's Bitcoin futures liquidation wiped $19B, exposing systemic risks from leveraged crypto exposure. - Herd mentality and ultra-leveraged products (3x/5x ETFs) amplified volatility, triggering cascading liquidations during price drops. - SEC restricted 2x leverage caps but overlooked stablecoin risks and opaque crypto-lending structures fueling contagion. - Regulators now face balancing innovation with systemic safeguards, including stress-testing crypto-linked institutions and enforcing stable

YFI drops 1.51% over the past 24 hours following Edgewater Wireless’s proposal to extend warrants
- Edgewater Wireless proposes extending 8.33M warrants by 12 months to maintain capital flexibility. - YFI stock fell 1.51% in 24 hours amid the announcement, with 53.58% annual decline as of Dec 5, 2025. - The $0.10 exercise price remains below current $3781 share price, preserving discounted capital-raising potential. - Extension requires TSXV approval but avoids shareholder votes, reflecting common practice in capital-intensive tech sectors.

Bitcoin’s Latest Price Drop and What It Means for Crypto Investors: Addressing Systemic Threats and Regulatory Ambiguity in the Market After 2025
- Bitcoin's 2025 price crash from $126k to $92k exposed systemic risks in leveraged crypto markets, with $9.89B in liquidations triggered by macro shocks and thin liquidity. - Regulatory clarity via 2025 acts (GENIUS/CLARITY) boosted adoption but coexisted with geopolitical tensions and fragmented global standards, creating inconsistent risk environments. - Institutional Bitcoin demand surged through ETFs ($220B inflow in November 2025), contrasting with retail caution post-crash, as leverage risks and reg
