Every trader and investor has eyes on BTC $80k support, which has become the most critical support line as Bitcoin faces relentless selling pressure triggered by global macro shocks, liquidation spikes, and collapsing risk sentiment. While the BTC price today shows very mild attempts at stabilization,but the market still broadly remains fragile, and the BTC price chart continues to signal caution across major timeframes.
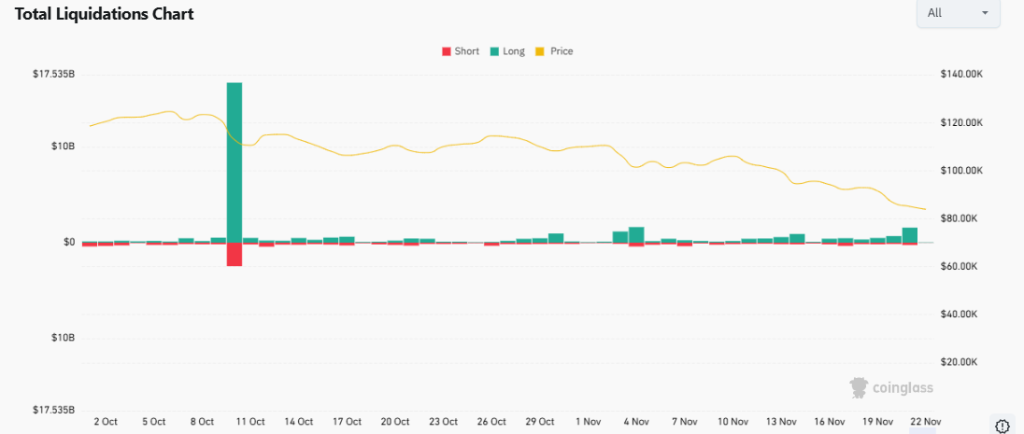
The downturn began on October 10, 2025, when the U.S. administration escalated its trade war with China. The announcement triggered a rapid and severe market reaction, wiping out $19.16 billion in crypto liquidations. Rising business costs, supply chain concerns, and global instability all contributed to a sharp unwind of leveraged longs.
Although many expected late-October rate cuts to soften the decline, but the Federal Reserve’s 0.25bps cut produced the opposite effect. The uncertain forward rate cuts left investors with little confidence in additional easing, pushing them further into risk-off sentiment territory.
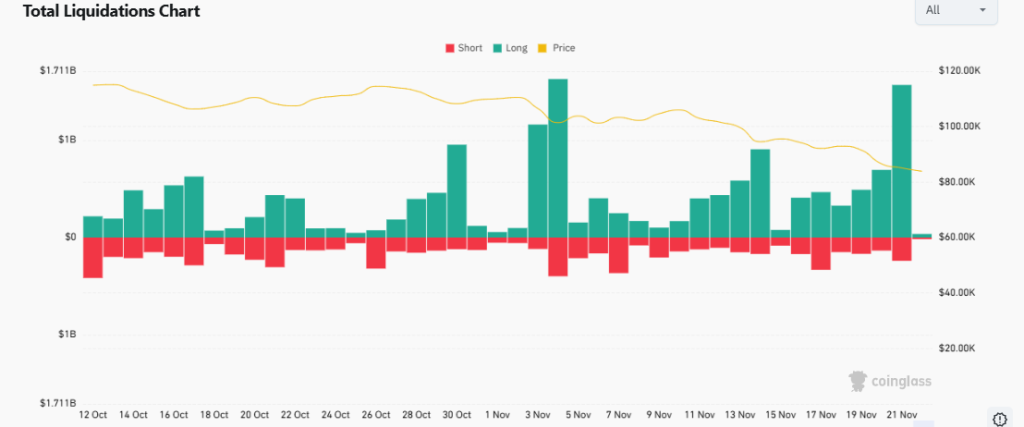
This shift is evident in the Crypto Liquidation charts , where long positions heavily outweighed shorts, confirming the dominance of fear-driven selling.
SImilarly, geopolitical shocks added further pressure. Not the only cause but one of the major cause was the most recent missile and drone attacks in the Russia-Ukraine conflict triggered another wave of panic, with $1.87 billion liquidated on November 21 and $1.70 billion on November 22. This sequence of events deepened concern that global conflict risk was rising and markets responded accordingly.
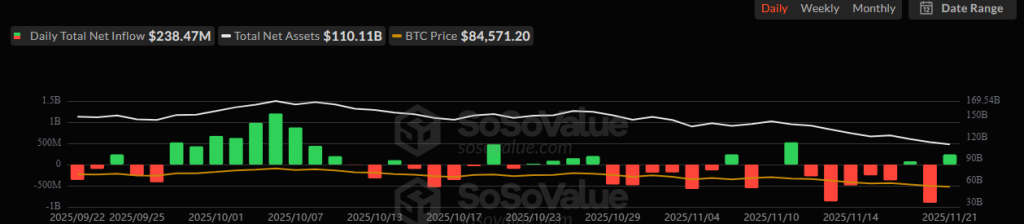
One of the major findings comes from institutional flows which reflected the same caution. Billions were withdrawn from crypto-backed investment products throughout November. As a result, the BTC price USD dropped sharply.
Even though Bitcoin reached an ATH of $126,296 earlier in a friendlier climate, but the macro backdrop has now overshadowed earlier optimism. Expectations for further rate cuts have diminished, dampening hopes for a quick stabilization.
- Also Read :
- Bitcoin Likely to Remain Under Pressure as Massive ETF Outflows Shake the Market
- ,
Technically, Bitcoin price has been in a persistent decline, falling 35% from its peak to reach $80,524. While BTC price today shows a slight rebound toward $84,244, analysts emphasize that the bounce remains shallow and lacks momentum. The BTC price chart still reflects a structure that favors lower levels unless demand strengthens decisively.
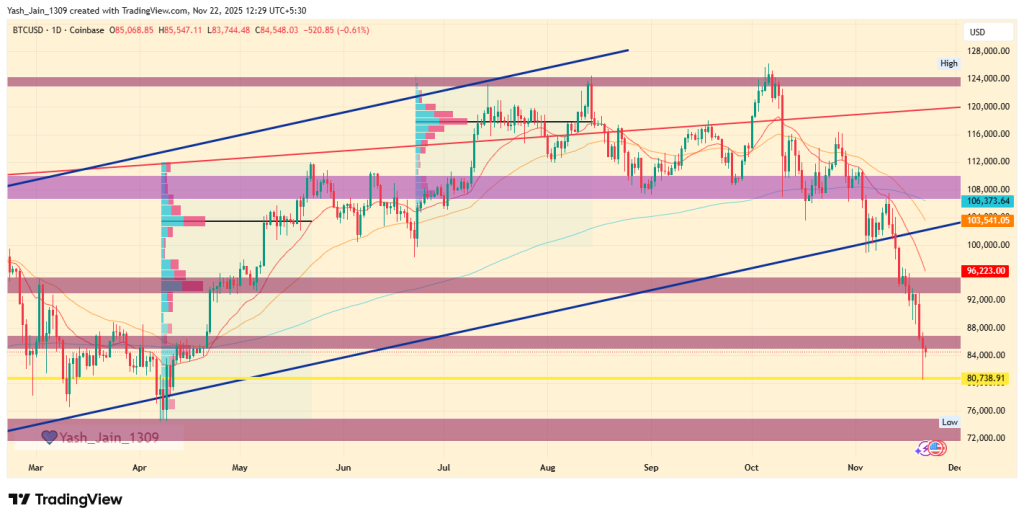
The BTC $80k support level now represents the final near-term zone preventing a deeper slide. Analyst suggest that failure to stay above it could accelerate the drop toward $72,000-$73,000, followed by the broader $66,000 region if selling pressure escalates. On the other hand, a reclaim above $86,000 would be the earliest sign of stabilization.
Whether Bitcoin can defend BTC $80k support will largely shape the broader BTC price prediction and sentiment heading into December.
Another analyst said that the total market cap has shed $1.3T since October, signaling a clear bearish trend. but this phase is about positioning, not panic, per analyst. Based on monetary capacities, stack conviction through steady DCA if liquid, or stay in stables to protect capital, is the best strategy at times like these.
Also, analysts suggest avoiding random tokens and focus on quality assets like BTC, ETH, and ZEC while watching high-liquidity chains such as SOL and BNB.