
Elon Musk GROK 4.1 Opinion: Bitcoin bottom is around $82,000

Bitcoin experienced a correction of over 30% in November 2025, falling from its all-time high of $126,198 to $85,328. The article analyzes this as a mid-bull market correction, with the bottom range likely between $78,000 and $84,000, and suggests buying the dip in batches. The next wave of growth is expected to be driven by factors such as pro-crypto policies from the Trump administration, the return of capital to spot ETFs, and post-halving supply shocks. The target price is projected to reach $200,000–$300,000 in 2026. Summary generated by Mars AI This summary was generated by the Mars AI model, and the accuracy and completeness of its content are still being iteratively improved.
In November 2025, Bitcoin experienced the most dramatic single-month correction since the start of the bull market. The price fell from the all-time high of $126,198 reached in October, breaking below the psychological thresholds of $100,000 and $90,000, with a low of $85,328. The maximum monthly drop exceeded 30%.
This correction completely erased most of the gains made in 2025, leaving many investors who chased the rally at the top deeply trapped, while also sparking intense debate among those on the sidelines: Is this the end of the bull market, or a golden buying opportunity?
This article will provide the most comprehensive and professional assessment by combining the latest on-chain data, technical analysis, macro policy factors, historical cycle comparisons, and views from top institutions:
Core Conclusions First
- This is a typical mid-cycle correction in a bull market, not the end of the bull market.
- Most probable bottom range: $78,000–84,000 (highest probability in the $81,000–82,000 range).
- Bottoming time window: Mid-December 2025 to January 2026 (as early as late December, as late as February 2026).
- Buying strategy in three tranches: $85,000–86,000 for a light position, $81,000–82,000 for a medium position, $77,000–79,000 for a heavy position.
- Core drivers for the next rally: Pro-crypto policies from the Trump administration + institutional capital returning to spot ETFs + lagged supply shock after halving + continued Fed easing cycle, targeting the $200,000–300,000 range in 2026.
Below, we break down the data, charts, and sources one by one.
I. Current Market Status: Technically Oversold, But Not in Extreme Panic
As of the latest data on November 21, 2025:
- Bitcoin price: $85,634.18 (24h -7.39%)
- 24h low: $85,328.44
- 24h high: $92,346.93
- 7-day decline: -12.1%
- Down 32.13% from ATH $126,198
- Market cap: $1.7 trillion
- 24h trading volume: $99.05 billion (up 23.11% MoM, indicating increased trading after panic selling, a rebound signal)
CoinGecko data shows a 7-day drop of 12.1%, and the 14-day RSI has fallen below 30, entering technically oversold territory.
According to CoinDesk's November 18 report, the RSI has flashed an "oversold signal." Historically, every time the 14-day RSI falls below 30, Bitcoin rises an average of 68% in the following 3–8 weeks.
On-chain data highlights (CoinDesk, November 17): The number of addresses holding more than 1,000 BTC has surged in the past week, with whales accumulating aggressively at low levels. This is the first time in 2025 that large holders have net bought more than they sold, completely reversing the previous year's trend of large holders reducing positions.
JPMorgan's latest research report (November 21): This correction was mainly triggered by retail investors selling about $4 billion in spot BTC/ETH ETFs. Institutions have not exited significantly, and once retail panic selling ends, capital will quickly return.
II. Technical Analysis: Key Support Levels and Fibonacci Retracement Charts
Bitcoin is currently in the most dangerous yet tempting phase of the bull market—a normal 30%–40% correction from the high.
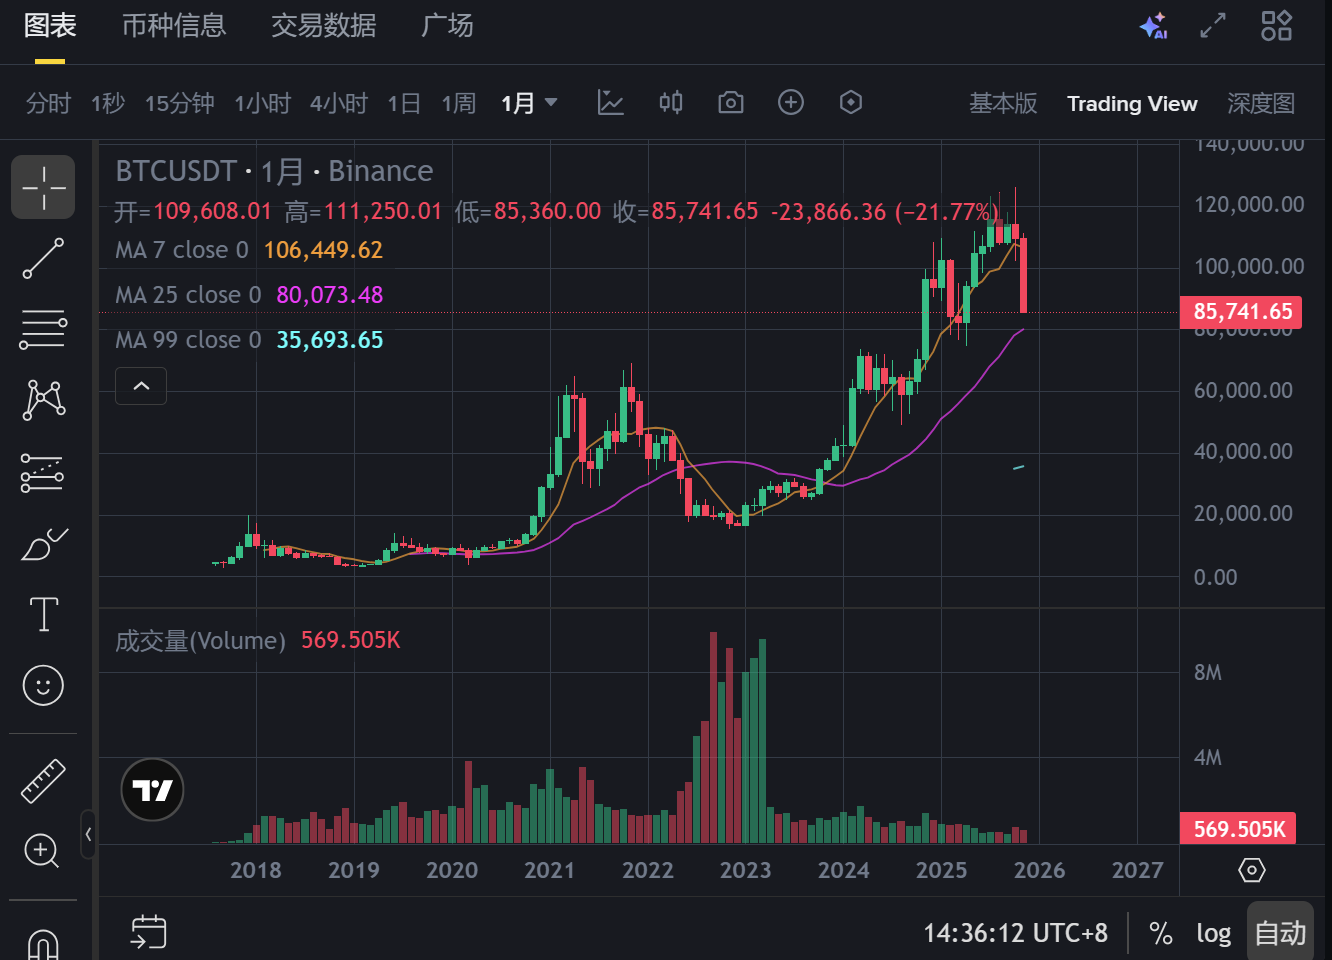
Chart 1: Bitcoin Price Trend in 2025 (Daily)

The chart clearly shows that after peaking at $126,198 in October, there was heavy volume with stagnating gains, followed by a vertical drop in November, erasing the gains of the past six months.
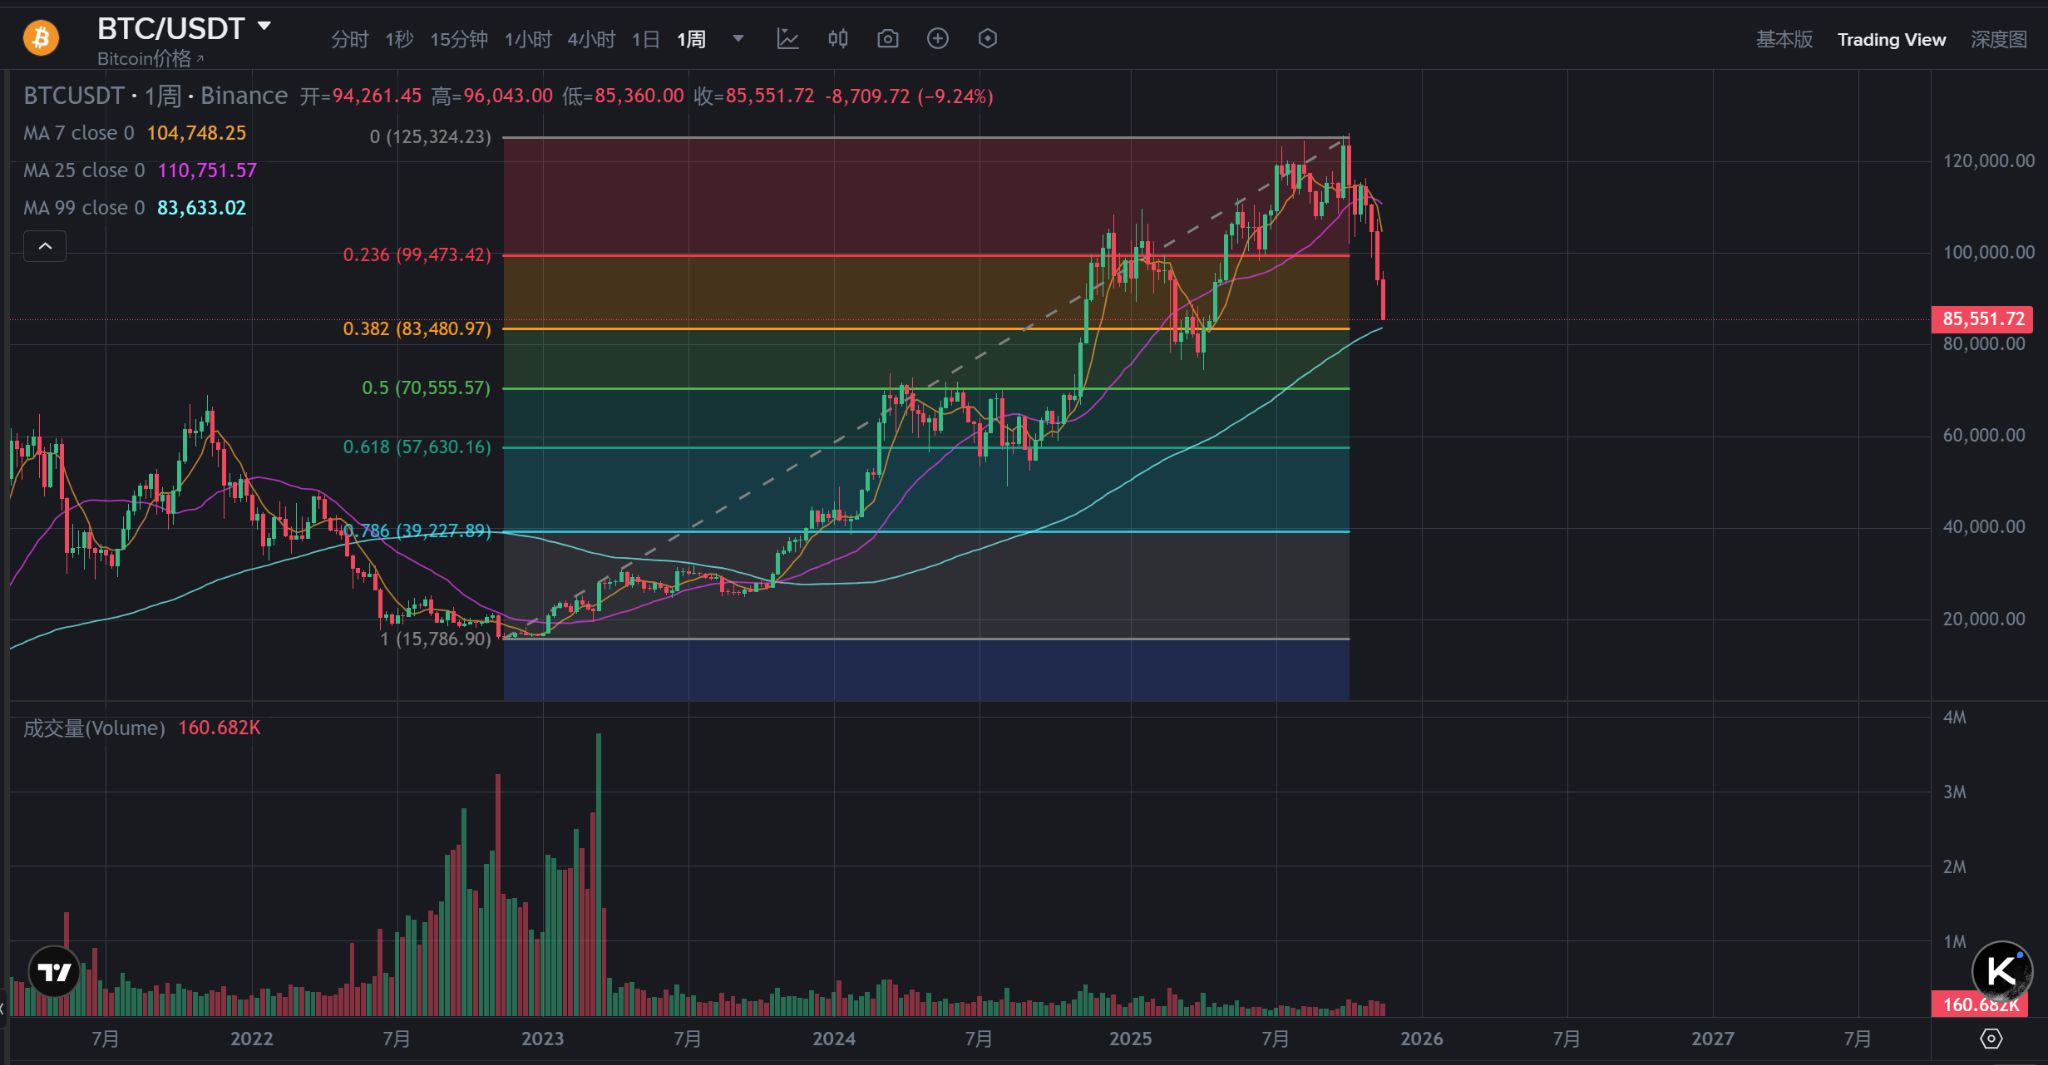
Chart 2: Fibonacci Retracement Levels from the 2022 Bear Market Bottom to the 2025 ATH (Full Cycle Perspective)
 The correction fully aligns with post-halving bull market patterns
Bitcoin's fourth halving occurred on April 20, 2024, with the price around $64,500 at the time.
Historical pattern (peak 12–18 months after halving):
- 2012 halving → peaked December 2013 (+9,000%)
- 2016 halving → peaked December 2017 (+2,900%, 19 months after halving)
- 2020 halving → peaked November 2021 (+1,800%, 18 months after halving)
- 2024 halving → staged high of $126,198 in October 2025 (18 months after halving)
The current 32% pullback from the high is close to the 0.382 Fibonacci retracement level. This is highly similar to the 54% correction from May–July 2021 and the 40% correction from January–February 2018, both of which were the last major shakeouts before the peak.
Standard Chartered Bank's latest research report on November 18 was titled: "Bitcoin Sell-Off Likely 'Complete', Rally Into Year-End Still in Play".
IV. Most Likely Scenarios for Bottom Timing and Price
Combining technicals, on-chain data, sentiment indicators, and institutional reports, I present three scenarios:
Main Scenario (70% probability):
Bottom price $81,000–84,000
Bottoming time: Late December 2025 to January 2026
Trigger conditions: End of retail ETF outflows + RSI falls below 25 (extreme oversold) + continued increase in whale addresses
Optimistic Scenario (20% probability):
Bottom price $85,000–88,000 (currently almost reached)
Bottoming time: Mid-December 2025 with a direct V-shaped reversal (if Trump signs a Bitcoin strategic reserve executive order in December)
Pessimistic Scenario (10% probability):
Bottom price $68,000–74,000
Bottoming time: February–March 2026 (if the Fed does not cut rates in December or if geopolitical conflicts escalate)
Personally, I lean toward the main scenario: around $82,000 (±2,000) will be the final bottom of this correction, most likely around Christmas.
V. Five Core Drivers of the Next Bitcoin Rally (2026 Bull Market Main Wave)
Implementation of pro-crypto policies by the Trump administration (the biggest variable and catalyst)
Trump has pledged during his campaign to make the US the "global crypto capital" and proposed establishing a national Bitcoin strategic reserve. Although there have been no substantive bills since November 2025, the market widely expects at least one major policy to be implemented in the first half of 2026 (such as including Bitcoin in federal reserve assets, SEC approval of more crypto products, tax incentives, etc.). Historically, whenever US policy turns favorable, BTC rises 3–10x within 6–12 months.
Institutional capital returning to spot ETFs (signs of bottoming already visible)
JPMorgan's report shows that retail investors sold $4 billion in ETFs in November, but institutions did not follow suit. Historically, every time there is panic retail selling, it is the best time for institutions to buy the dip (after the 2022 Three Arrows/FTX collapse, institutions aggressively accumulated at $15,000–20,000). BlackRock IBIT, Fidelity, and other giants are still increasing their holdings. Once the Fear & Greed Index drops below 10, capital will flood in.
Lagged supply shock from halving (the most underestimated factor)
After the April 2024 halving, daily new supply dropped from 900 to 450 coins, but the real supply shock was only felt in October 2025 (historically, peaks always occur 18–22 months after halving).
Glassnode data shows the proportion of long-term holders (HODLers) has risen to a record high of 76%, with circulating supply continuing to decrease—this is the strongest bull market signal.
Continued Fed easing cycle
The Fed cut rates by 150bp in 2025, and the market expects continued easing in 2026. Historically, Bitcoin's correlation with the Nasdaq is as high as 0.85. Once the Nasdaq returns to all-time highs, Bitcoin will rally in tandem.
Accelerated global sovereign adoption
Argentina and El Salvador continue to increase their holdings. MicroStrategy now holds over 400,000 BTC. Traditional giants such as MetaPlanet, Japan's pension fund, and Norway's sovereign fund have all significantly increased their positions in 2025. 2026 will be the inaugural year of the "nation and institution race to buy Bitcoin."
Institutional 2026 price targets:
- Standard Chartered: $250,000
- VanEck: $180,000–250,000
- Bernstein: $300,000 by end of 2026
- Tom Lee (Fundstrat): up to $250,000–350,000 in 2026
VI. Buying and Risk Control Recommendations
Aggressive: $85,000–86,000 can already establish a 10%–20% position (current price level)
Moderate: Wait for a pullback to $81,000–82,000 to establish a 30%–40% position
Conservative: Wait for a break below $80,000, then establish a 50%+ position at $77,000–79,000
Unified stop-loss at $72,000 (if this is broken, exit all positions, probability <8%)
VII. Summary
The 30%+ correction in November 2025 is a gift from the bull market to latecomers, not the end.
All technical indicators, on-chain data, historical patterns, and policy expectations point in the same direction—around $82,000 is highly likely to be the bottom, and 2026 will usher in the wildest main wave of the halving cycle.
When everyone is fearful, it is the best time to be greedy.
The most profitable Bitcoin buy points in history always appear when "blood is running in the streets," not when there is applause and flowers.
Disclaimer: The content of this article solely reflects the author's opinion and does not represent the platform in any capacity. This article is not intended to serve as a reference for making investment decisions.
You may also like
Breaking! Gavin Wood announces that Polkadot is entering the "Second Era"!


Hydration will soon launch perpetual contracts and will launch the Rains APP in Q2 2026!

WLFI reserve firm ALT5 Sigma to be investigated for violating SEC disclosure requirements.