Bitcoin Price Crashes Under $90K, Triggering Fresh Fears of Deeper Weakness
Bitcoin price started another decline below $90,000. BTC is now showing bearish signs and might struggle to recover above $88,5000.
- Bitcoin started a fresh decline below $92,000 and $90,000.
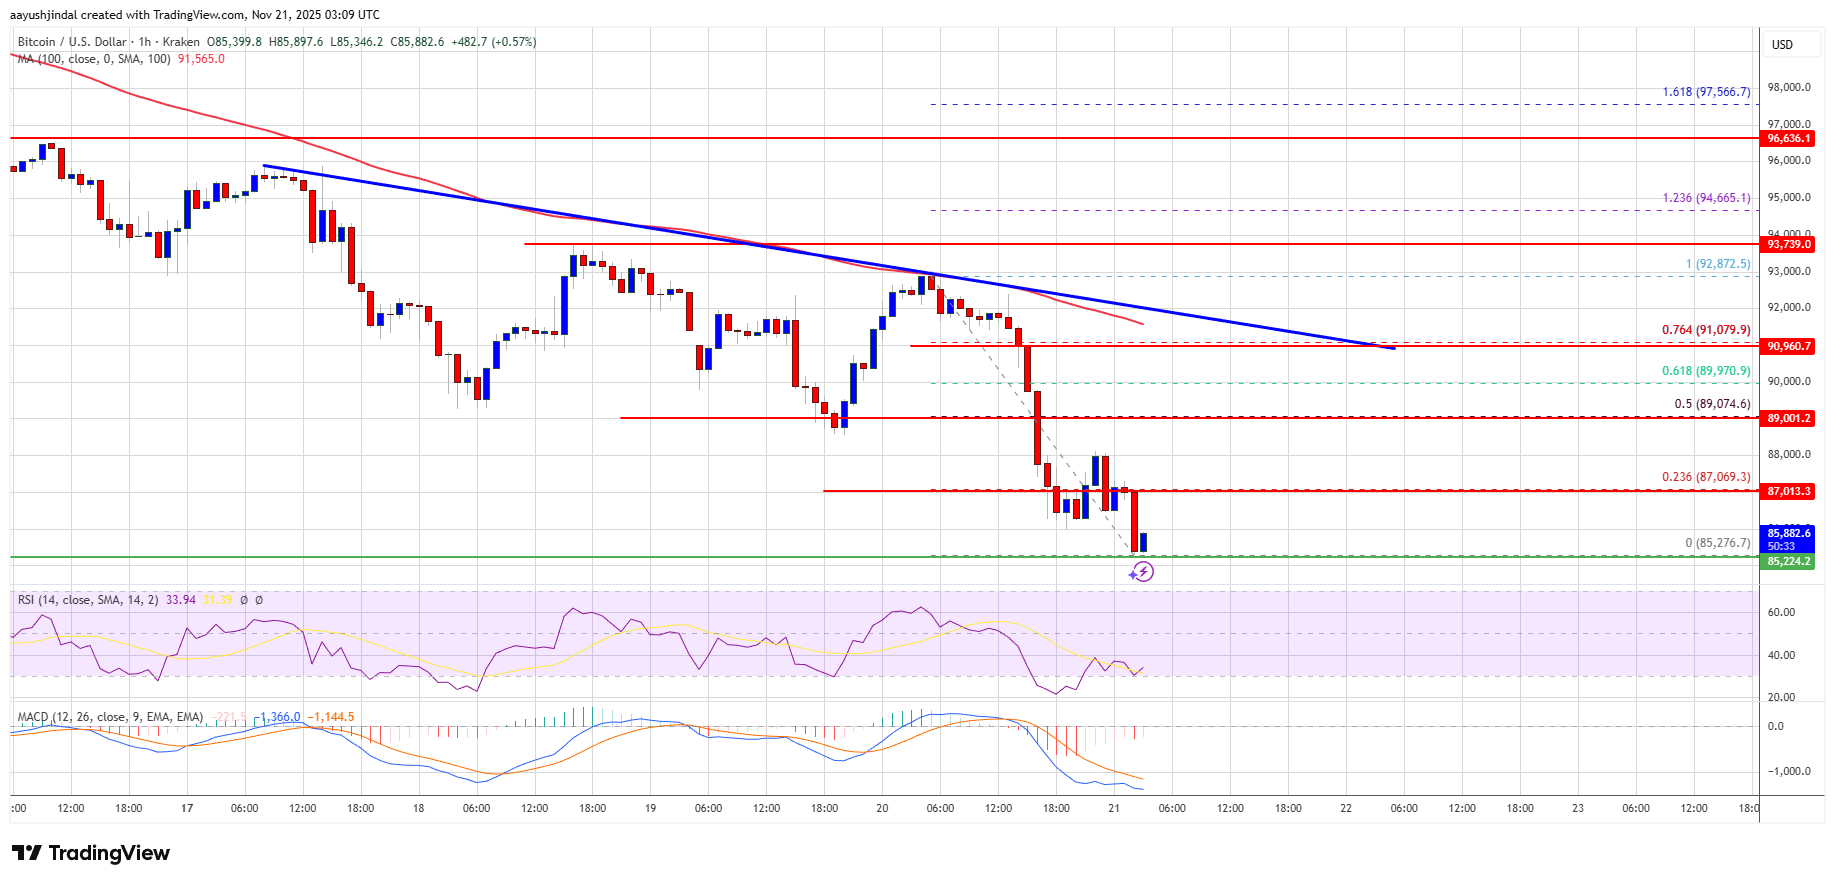
- The price is trading below $90,000 and the 100 hourly Simple moving average.
- There is a bearish trend line forming with resistance at $91,000 on the hourly chart of the BTC/USD pair (data feed from Kraken).
- The pair might continue to move down if it settles below the $90,000 zone.
Bitcoin Price Dips Further
Bitcoin price failed to stay in a positive zone above the $90,000 level. BTC bears remained active below $88,800 and pushed the price lower.
The bears gained strength and were able to push the price below the $87,500 zone. A low was formed at $85,276, and the price is now consolidating losses below the 23.6% Fib retracement level of the recent decline from the $92,872 swing high to the $85,276 low.
Bitcoin is now trading below $90,000 and the 100 hourly Simple moving average. Besides, there is a bearish trend line forming with resistance at $91,500 on the hourly chart of the BTC/USD pair.
If the bulls attempt another recovery wave, the price could face resistance near the $87,000 level. The first key resistance is near the $89,000 level and the 50% Fib retracement level of the recent decline from the $92,872 swing high to the $85,276 low.

The next resistance could be $91,000 and the trend line. A close above the $91,000 resistance might send the price further higher. In the stated case, the price could rise and test the $92,500 resistance. Any more gains might send the price toward the $93,200 level. The next barrier for the bulls could be $94,500 and $95,000.
More Losses In BTC?
If Bitcoin fails to rise above the $90,000 resistance zone, it could start another decline. Immediate support is near the $85,500 level. The first major support is near the $85,000 level.
The next support is now near the $83,200 zone. Any more losses might send the price toward the $82,500 support in the near term. The main support sits at $80,000, below which BTC might accelerate lower in the near term.
Technical indicators:
Hourly MACD – The MACD is now gaining pace in the bearish zone.
Hourly RSI (Relative Strength Index) – The RSI for BTC/USD is now below the 50 level.
Major Support Levels – $85,500, followed by $85,000.
Major Resistance Levels – $87,000 and $89,000.
Disclaimer: The content of this article solely reflects the author's opinion and does not represent the platform in any capacity. This article is not intended to serve as a reference for making investment decisions.
You may also like
ICP's $4.92 Level Key as Energy Industry Drives Sustained Positive Outlook
- ICP token consolidates below $4.97 after failed $5.17 breakout, with $4.92 support critical for avoiding deeper correction. - Energy sector gains momentum as Constellation Energy secures $1B loan for Three Mile Island nuclear restart to support AI data centers. - GDS Holdings reports 74.4% data center utilization, reflecting strong demand for hyperscale infrastructure linked to AI expansion. - Analysts highlight energy-sector tailwinds for ICP's long-term potential despite near-term technical uncertainty
XRP News Today: XRP's Death Cross and $2.20 Breach Indicate Broad Market Downturn
- XRP跌破关键$2.20支撑位并形成死亡交叉技术形态,短期看跌信号显著增强。 - 技术分析预测价格可能进一步下探$1.25,跌破历史支撑区间引发持续性担忧。 - 加密市场整体承压,比特币/以太坊同步出现死亡交叉,显示行业性熊市趋势。 - 支持者指出XRP跨境支付优势或吸引抄底资金,但短期流动性紧缩加剧下行风险。

Bitcoin News Update: Bitcoin's Recent Decline: Can Institutional Investors Help Steady the Market or Intensify the Slump?
- Bitcoin's price drop below $85,000 has intensified debates as long-term holders offload over 400,000 BTC, per economist Peter Schiff's warning about "weak hands" deepening selloffs. - High-profile exits like Owen Gunden's $1.3B BTC liquidation highlight profit-taking by OGs, while institutions via ETFs have absorbed 2.39M BTC since 2024, per Ark Invest. - Market fragility worsens as gamma exposure forces dealers to sell near $85,000 support, but institutional demand could stabilize prices if buying conti

YFI Value Drops 4.78% Over the Past Week as Market Fluctuations Continue
- YFI rose 0.1% in 24 hours but fell 4.78% in seven days, with 14.2% monthly and 50% annual declines. - Price movements reflect broader market instability, not project-specific updates or governance changes in Yearn.finance. - Analysts predict YFI remains sensitive to macroeconomic trends and global investor sentiment in the near term. - Token consolidation continues without fundamental shifts, urging investors to monitor on-chain metrics and protocol updates.

