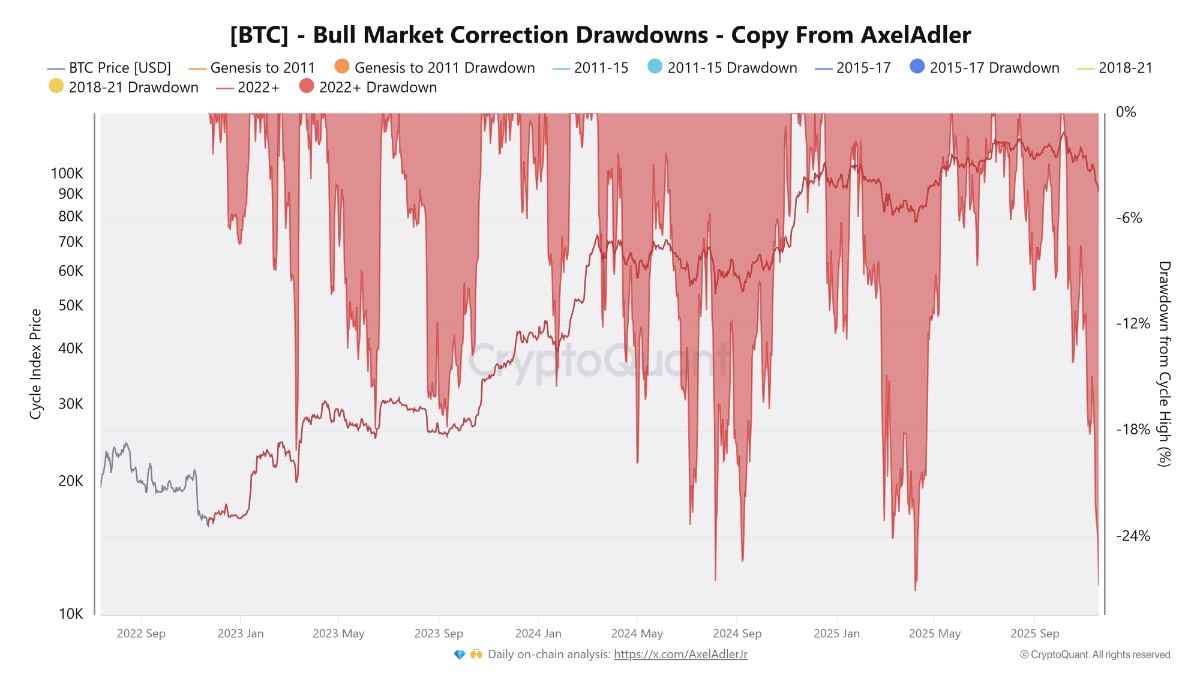
Bitcoin’s ( BTC ) drawdown on Monday pushed the asset into a 26.7% loss, narrowly overtaking the 26.5% slide seen in April, and marking the steepest correction of the current bull market. The move red-lined multiple market structure indicators, suggesting the current correction could be a final leverage washout phase.
 Bitcoin bull market correction levels. Source: CryptoQuant
Key takeaways:
Bitcoin’s 26.7% correction is now the largest of the cycle.
The Crypto Fear & Greed index shows ‘Extreme Fear’ among investors, but as a counterindicator, it could be a sign that Bitcoin is trading at a discount.
“Extreme fear” is usually followed by profitable Bitcoin price action
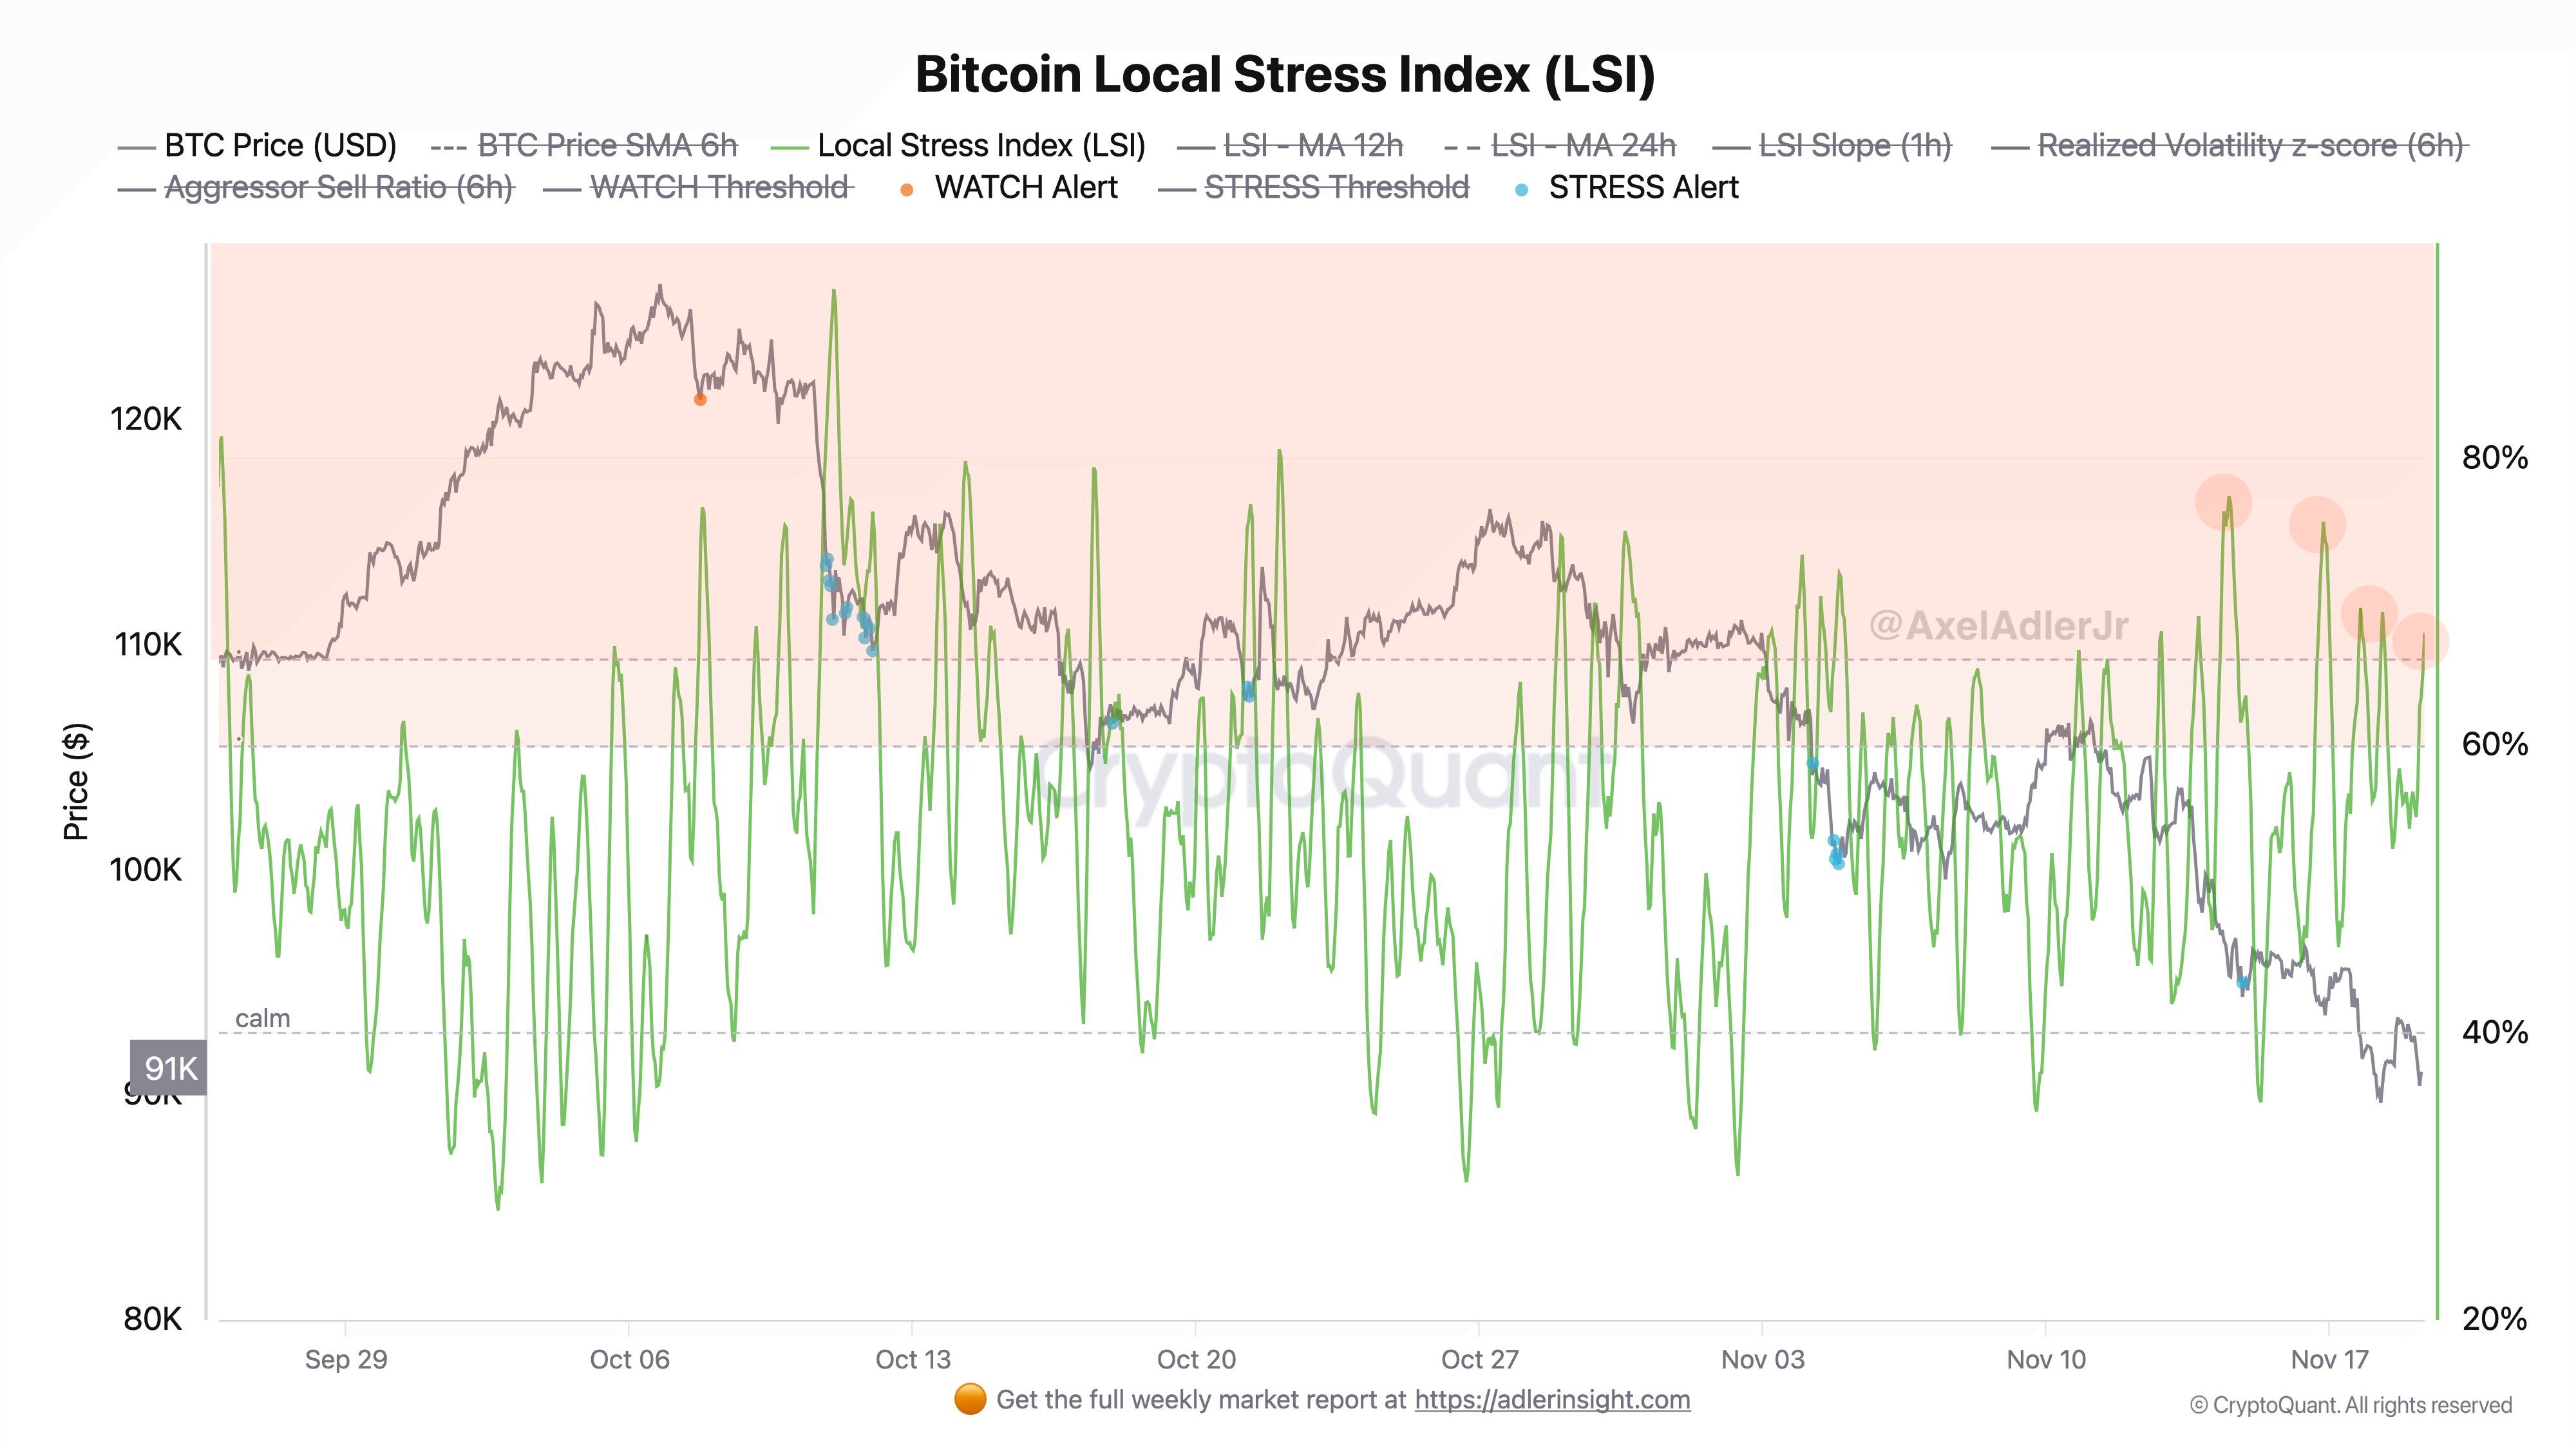
Bitcoin researcher Axel Adler Jr. said that the local market stress index remained elevated following the sharp sell-off on Monday, currently sitting at 67.82, above the system’s WATCH threshold of 64 but still below levels associated with critical breakdowns.
The highest tension point occurred during BTC’s collapse on Monday, when realized volatility surged to a 4.55 Z-score and aggressive selling signaled stress alerts.
Over the past 24 hours, the index has eased into the 62–68 range, though its short-term slope (+2.62) signaled renewed stress building within the market.
 Bitcoin local stress index. Source: Axel Adler Jr./X
Sentiment indicators are painting a similar picture. The Crypto Fear & Greed Index fell below 10 before rebounding slightly to 15, but is still locked in Extreme Fear. Historically, dips into this zone have been far more constructive in the previous years.
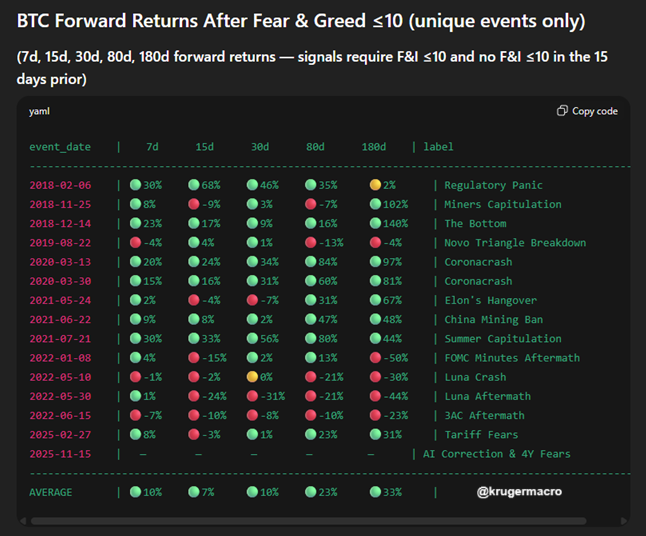
Across past cycles, whenever the Crypto Fear & Greed Index has fallen to 10 or below, Bitcoin has consistently delivered strong forward returns. On average, prices increased by 10% within a week, maintained similar strength over 15–30 days, and accelerated to 23% by day 80 and 33% by six months.
 Bitcoin returns post Fear & Greed Index drop below <10. Source: Alex Kruger/X
Economist Alex Kruger noted that in all 11 capitulation events since 2018, where the index hit this extreme level, short-term weakness was common, but almost every event produced a rebound. The pattern is one of Bitcoin’s most reliable behavioral edges: when fear reaches its peak, forward returns skew heavily to the upside.
Meanwhile, Bitcoin analyst VICTOR claimed that the current drawdown is “the close your eyes and bid type of range,” historically associated with late-stage flushes rather than cycle tops.
Related: Bitcoin recovery expected as liquidity conditions change, but US macro remains a threat
Short-term holder capitulation deepens, but the end could be near
Fresh onchain data indicated Bitcoin was entering one of the most severe short-term capitulation phases of this cycle. STH's profit-ratio (SOPR) has fallen back to 0.97, confirming that short-term holders are consistently selling at a loss. The ratio has now spent several weeks below 1.0, forming a clear capitulation band, a structure that has historically appeared near cyclical turning points.
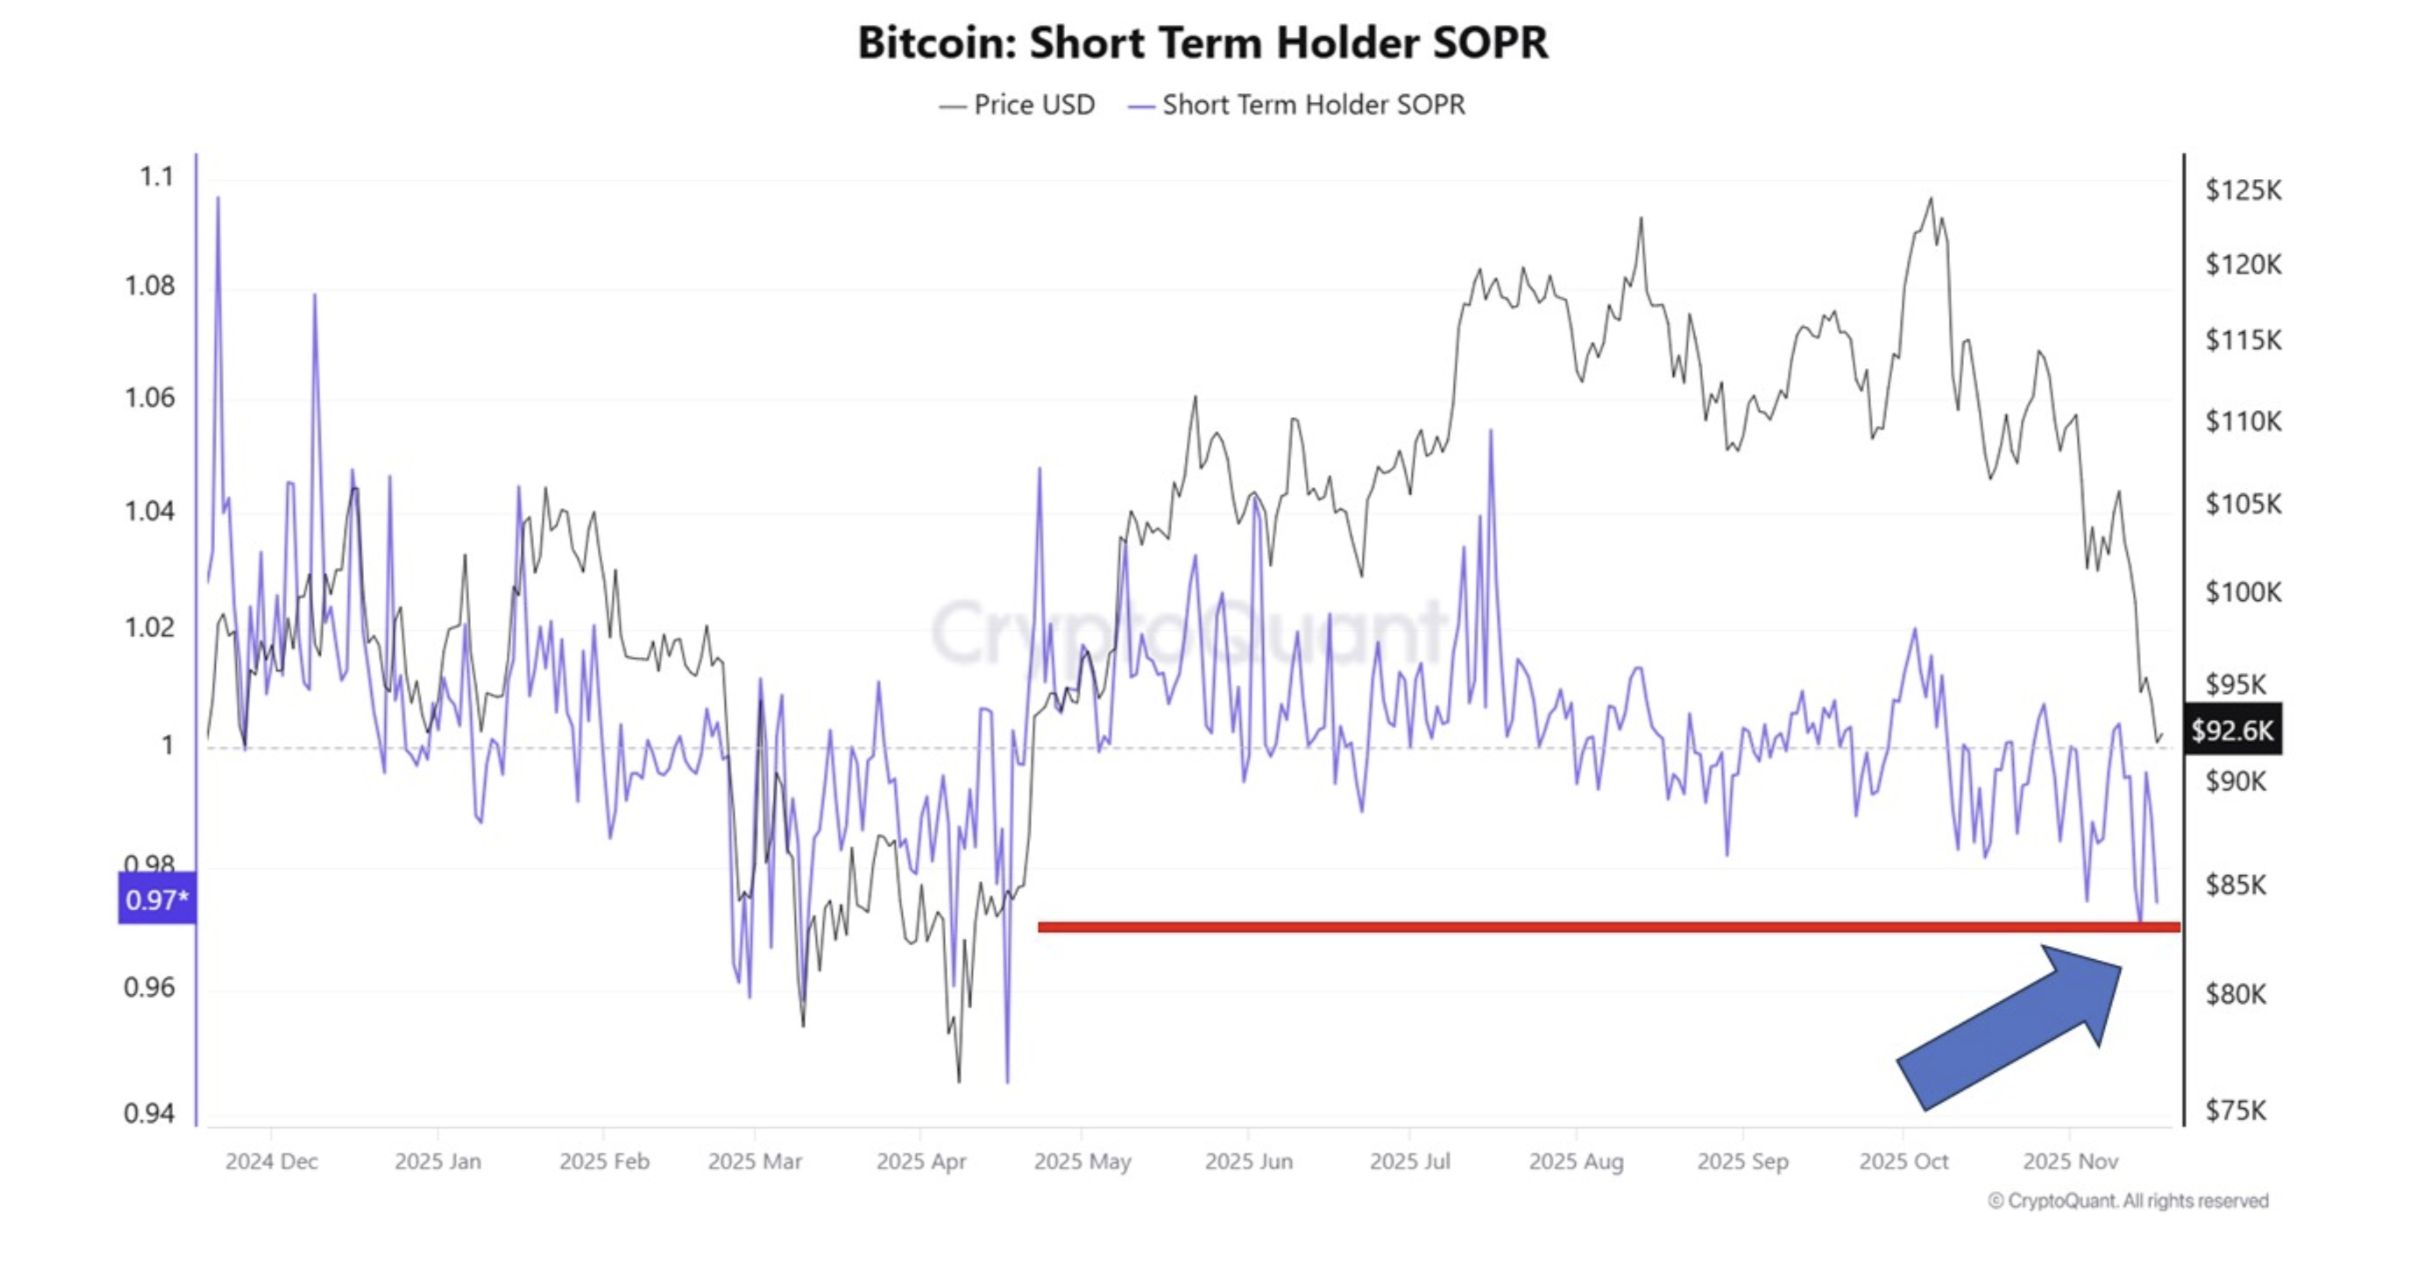 Bitcoin SOPR trend. Source: CryptoQuant
Similarly, STH-MVRV has dropped far below 1.0, indicating that nearly all recent buyers are underwater. This mirrored past episodes where unrealized losses spike, panic selling accelerates, and weak hands exhaust their supply.
The transfer of 65,200 BTC to exchanges at a loss further validates that fear is active, not theoretical. While this does not guarantee an immediate reversal, the combination of a sub-1.0 SOPR, deeply negative MVRV, and loss-driven exchange inflows suggests that the correction could be entering its final stages.
Related: Saylor shrugs off suggestion Wall Street ‘hurt’ Bitcoin amid latest crash