Pi Coin Price Still In Green, Yet The Chart Now Shows 3 Red Flags — Pullback Soon?

Pi Coin price is still green on the monthly chart, but the short-term structure has shifted. A bearish engulfing pattern, weakening OBV, and a hidden bearish divergence now hint that the recent bounce may be losing strength. Unless PI reclaims key resistance soon, a deeper pullback zone could open up.
Pi Coin price is still up about 9% over the past month, but the short-term picture has started to soften. PI trades near $0.226 today, almost flat over the past 24 hours. Traders may see this as stability, but the charts are flashing several signs that the rebound from $0.209 may be running out of steam.
These early signals suggest a pullback could come unless buyers regain control.
Chart Signals Hint At A Weakening Bounce
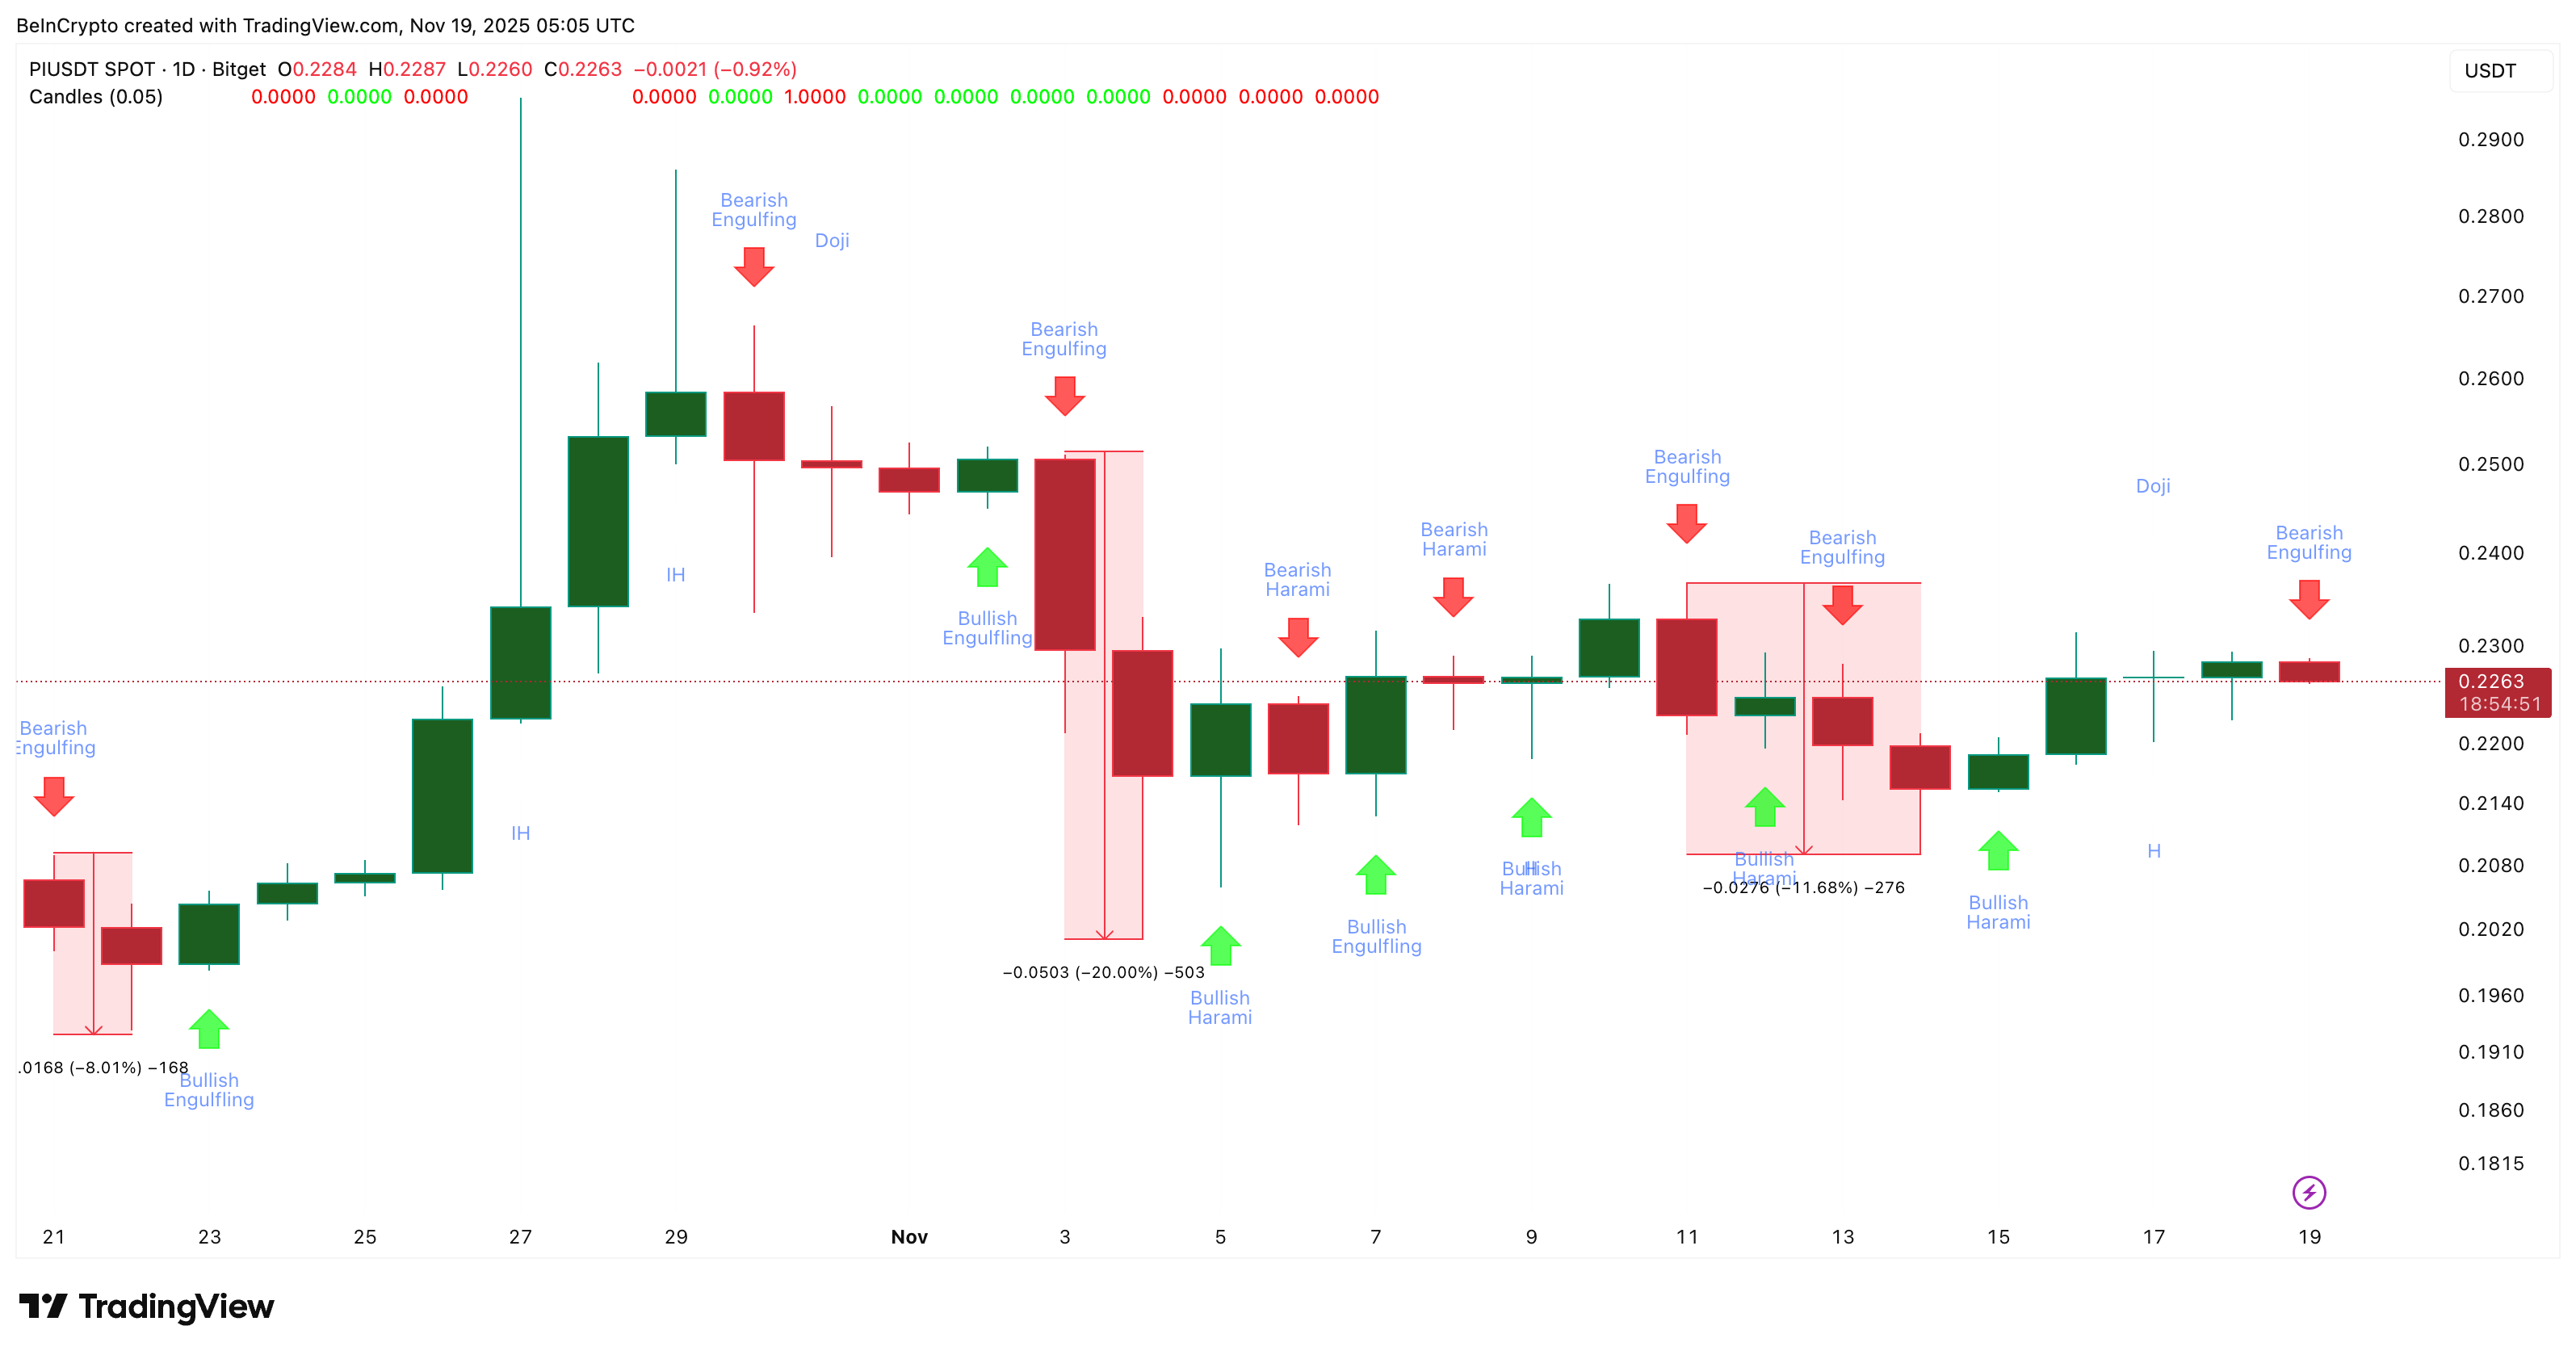
The first sign comes from a bearish engulfing pattern that formed on the daily Pi Coin chart. A bearish engulfing appears when a red candle fully covers the previous green candle. It often shows that sellers have regained control after buyers lose momentum.
Each time this pattern has appeared on Pi Coin since October 21, the price has dropped sharply, sometimes by 8% and sometimes by as much as 20%.
 Key Candlestick Patterns:
TradingView
Key Candlestick Patterns:
TradingView
Want more token insights like this? Sign up for Editor Harsh Notariya’s Daily Crypto Newsletter.
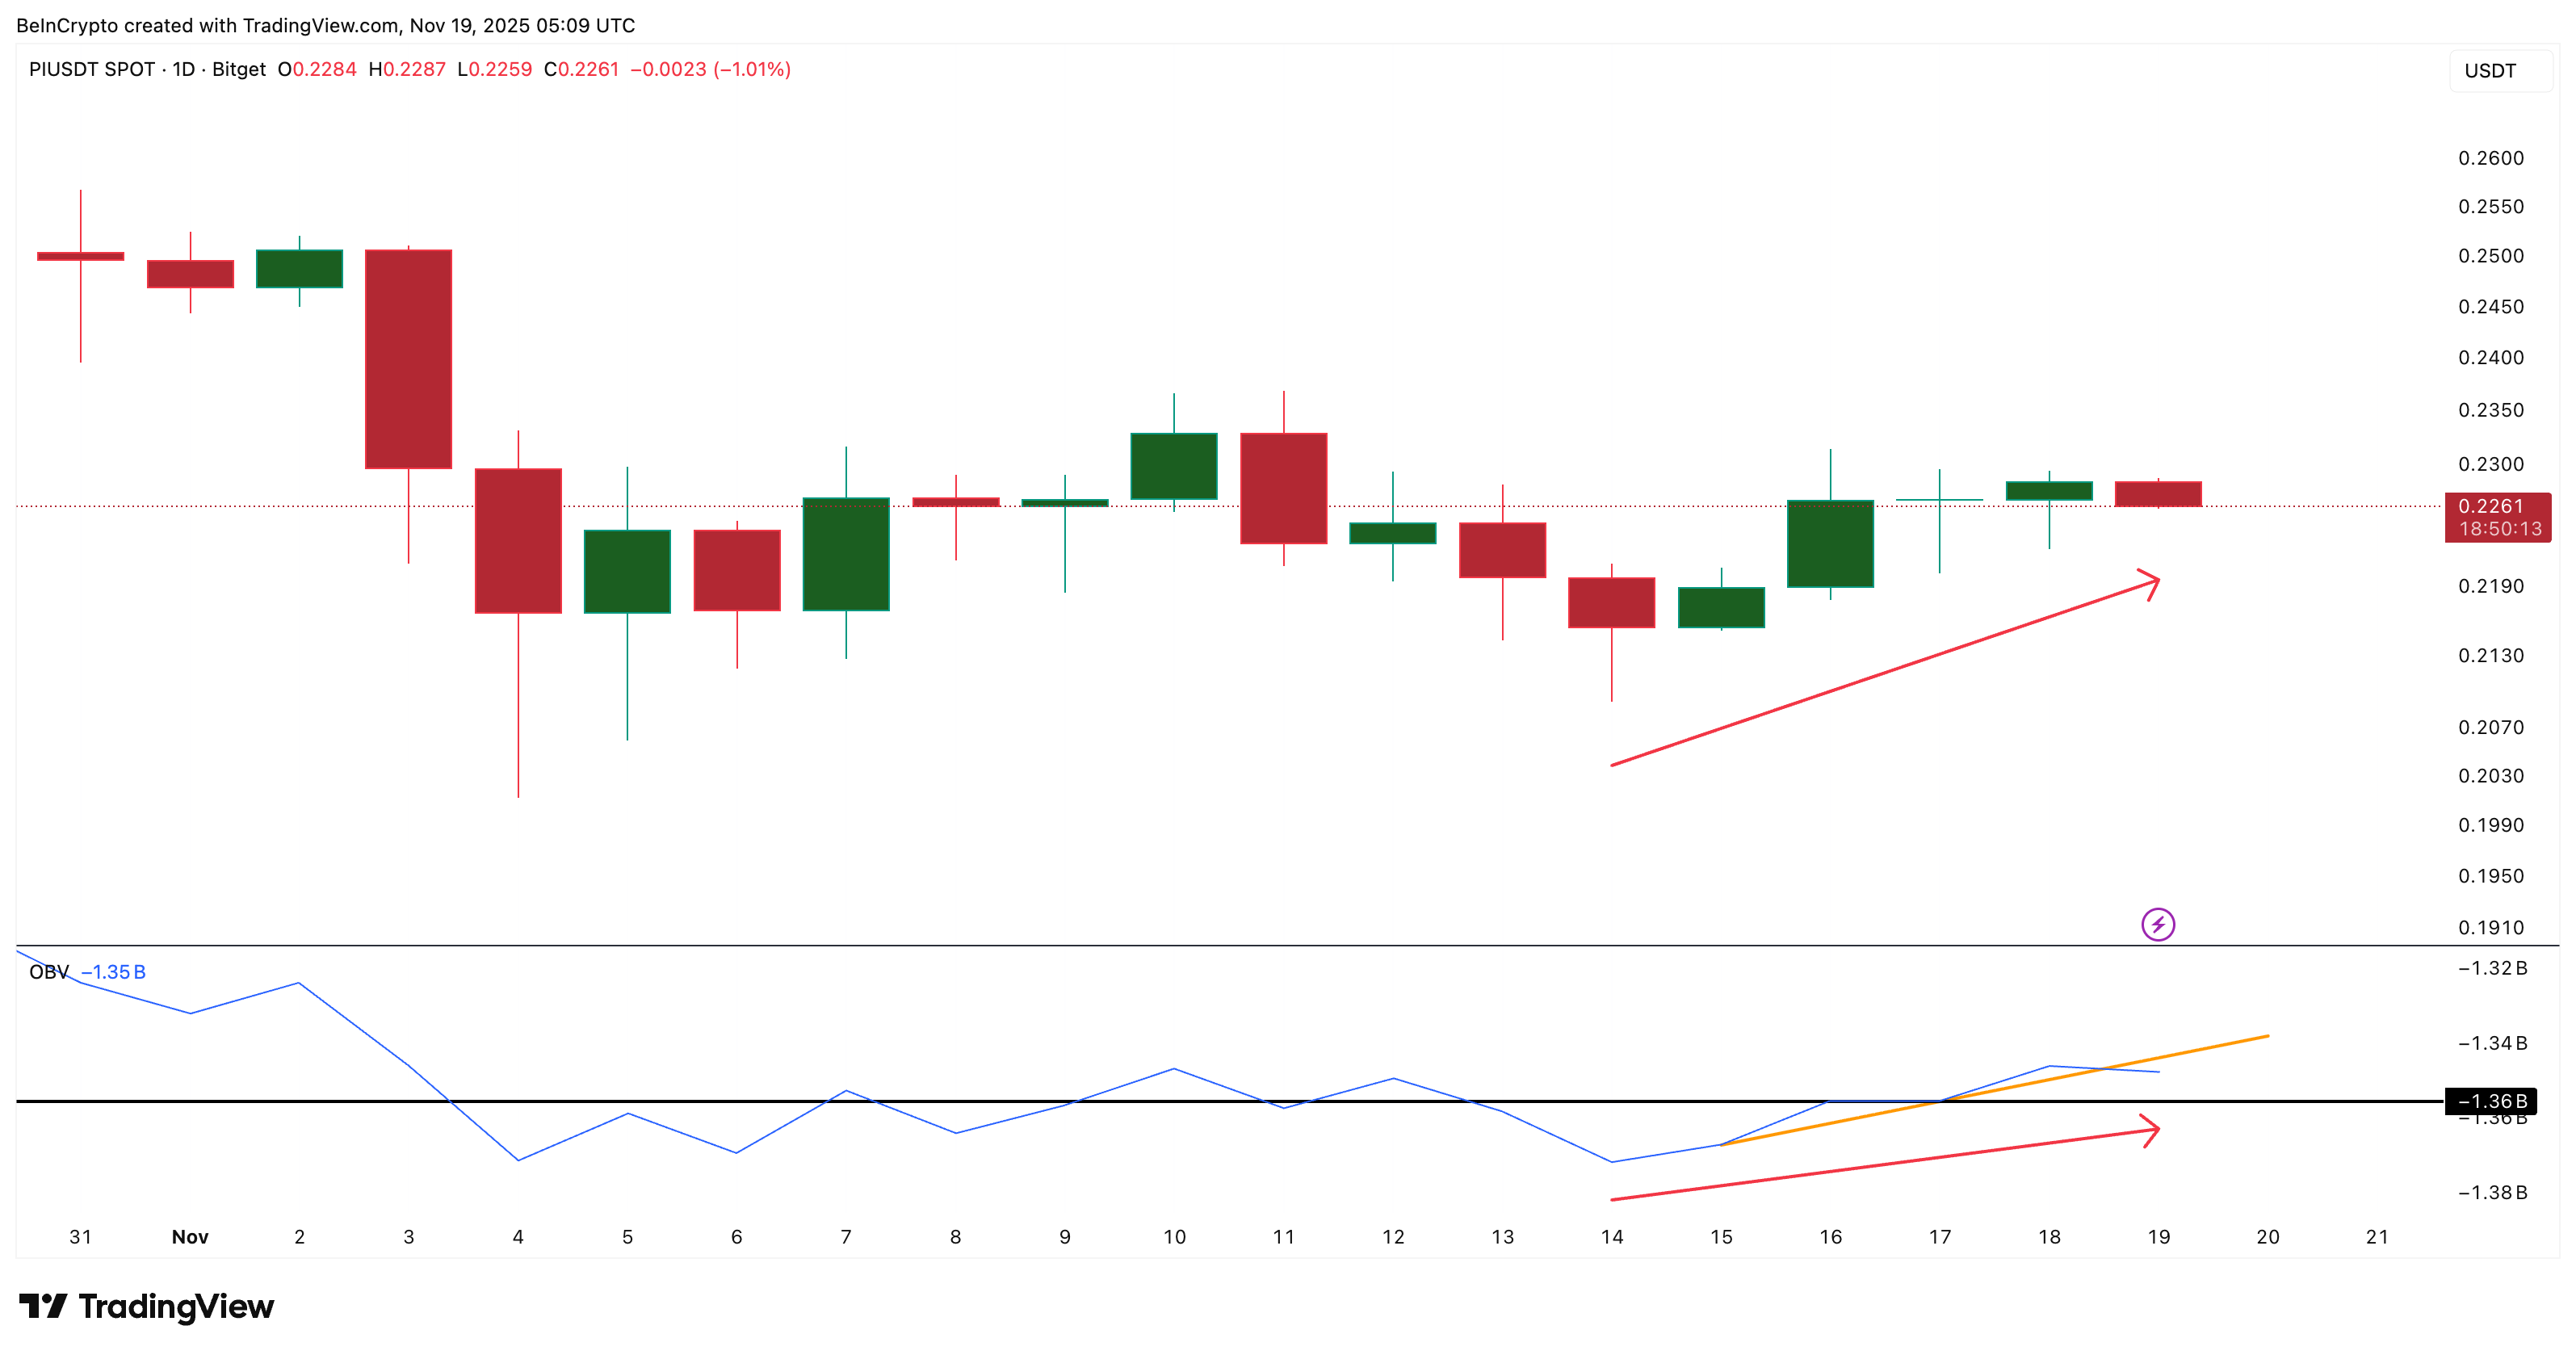
The second sign comes from the on-balance volume (OBV) indicator. OBV helps show whether real money is flowing into or out of a token.
Between November 14 and 18, OBV made higher lows while the price also made higher lows. That showed real buying support during the bounce. But OBV has now broken below the rising trend line that has supported it for days. If OBV falls under –1.36 billion, it will confirm a lower low on volume, which is already sell-biased. That shift usually happens when buyers lose strength and sellers take over, completely.
 Pi Coin Volume Takes A Hit:
TradingView
Pi Coin Volume Takes A Hit:
TradingView
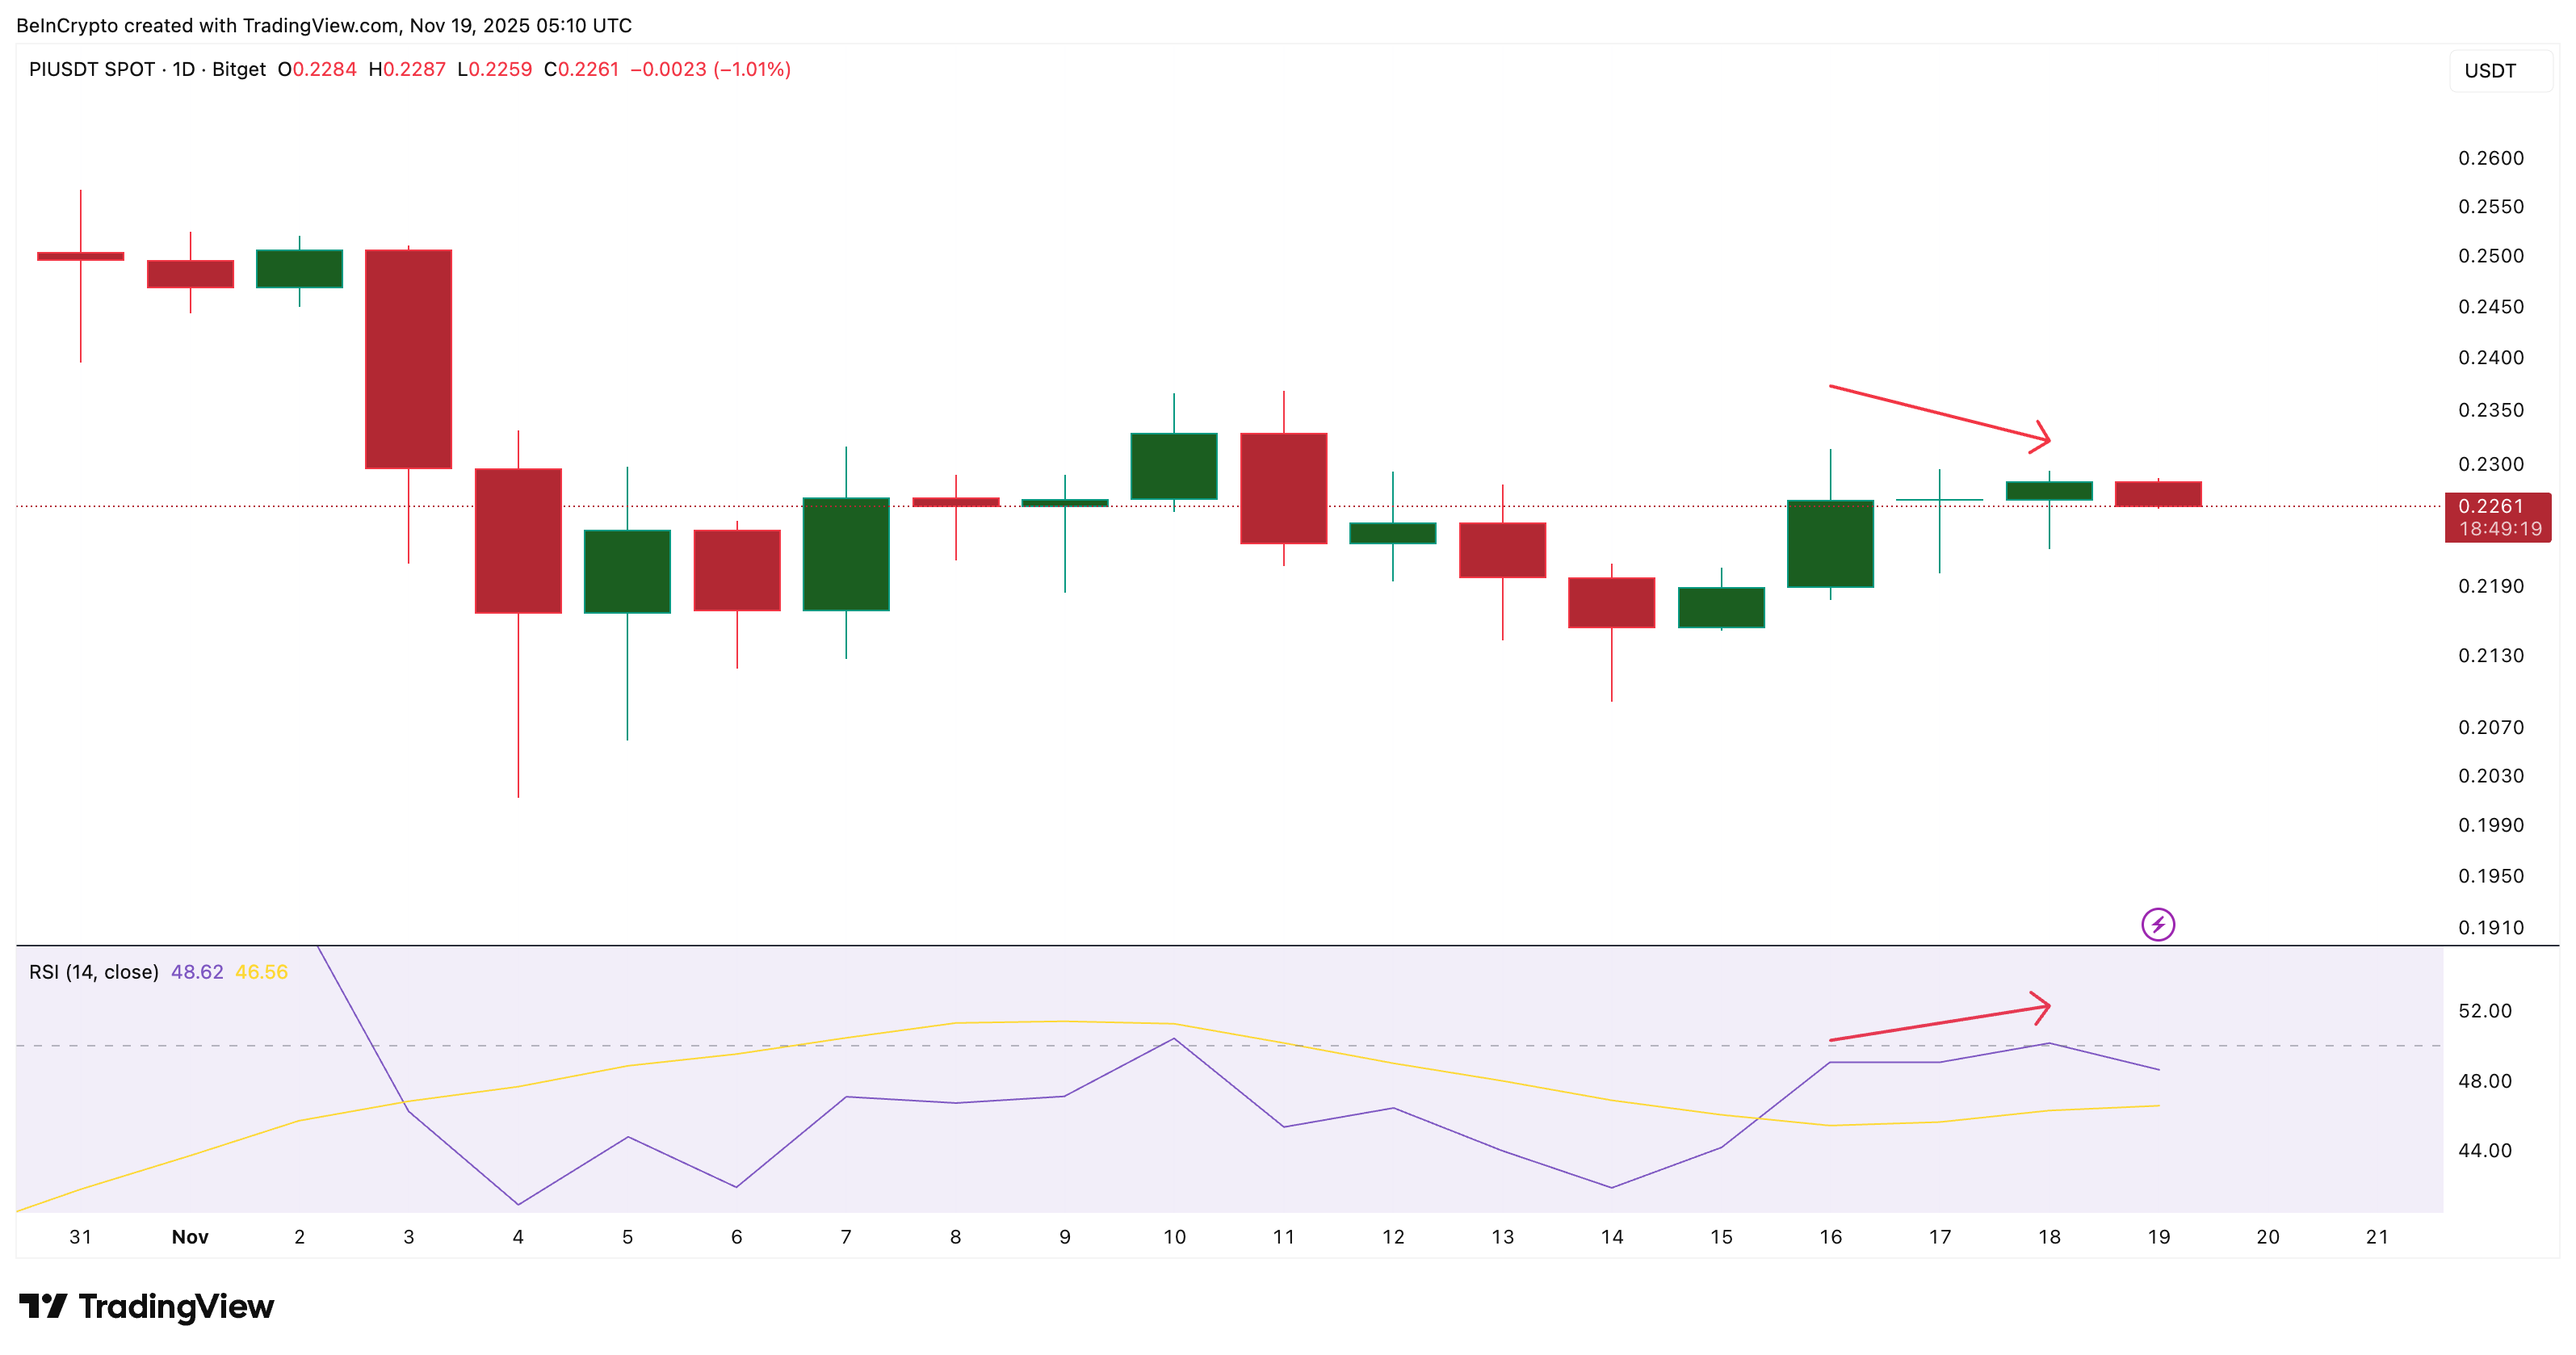
The third sign is a hidden bearish divergence on the Relative Strength Index (RSI). RSI measures buying strength.
Between November 16 and 18, the price made a lower high while the RSI made a higher high. This pattern is called hidden bearish divergence. It signals that the broader downtrend may still be in control and usually appears just before the next leg down in an ongoing downtrend.
 Hidden Bearish Divergence Flashes:
TradingView
Hidden Bearish Divergence Flashes:
TradingView
Together, these three signals show that Pi Coin’s recent bounce still sits inside a bigger downward structure.
Pi Coin Price Levels That Matter Now
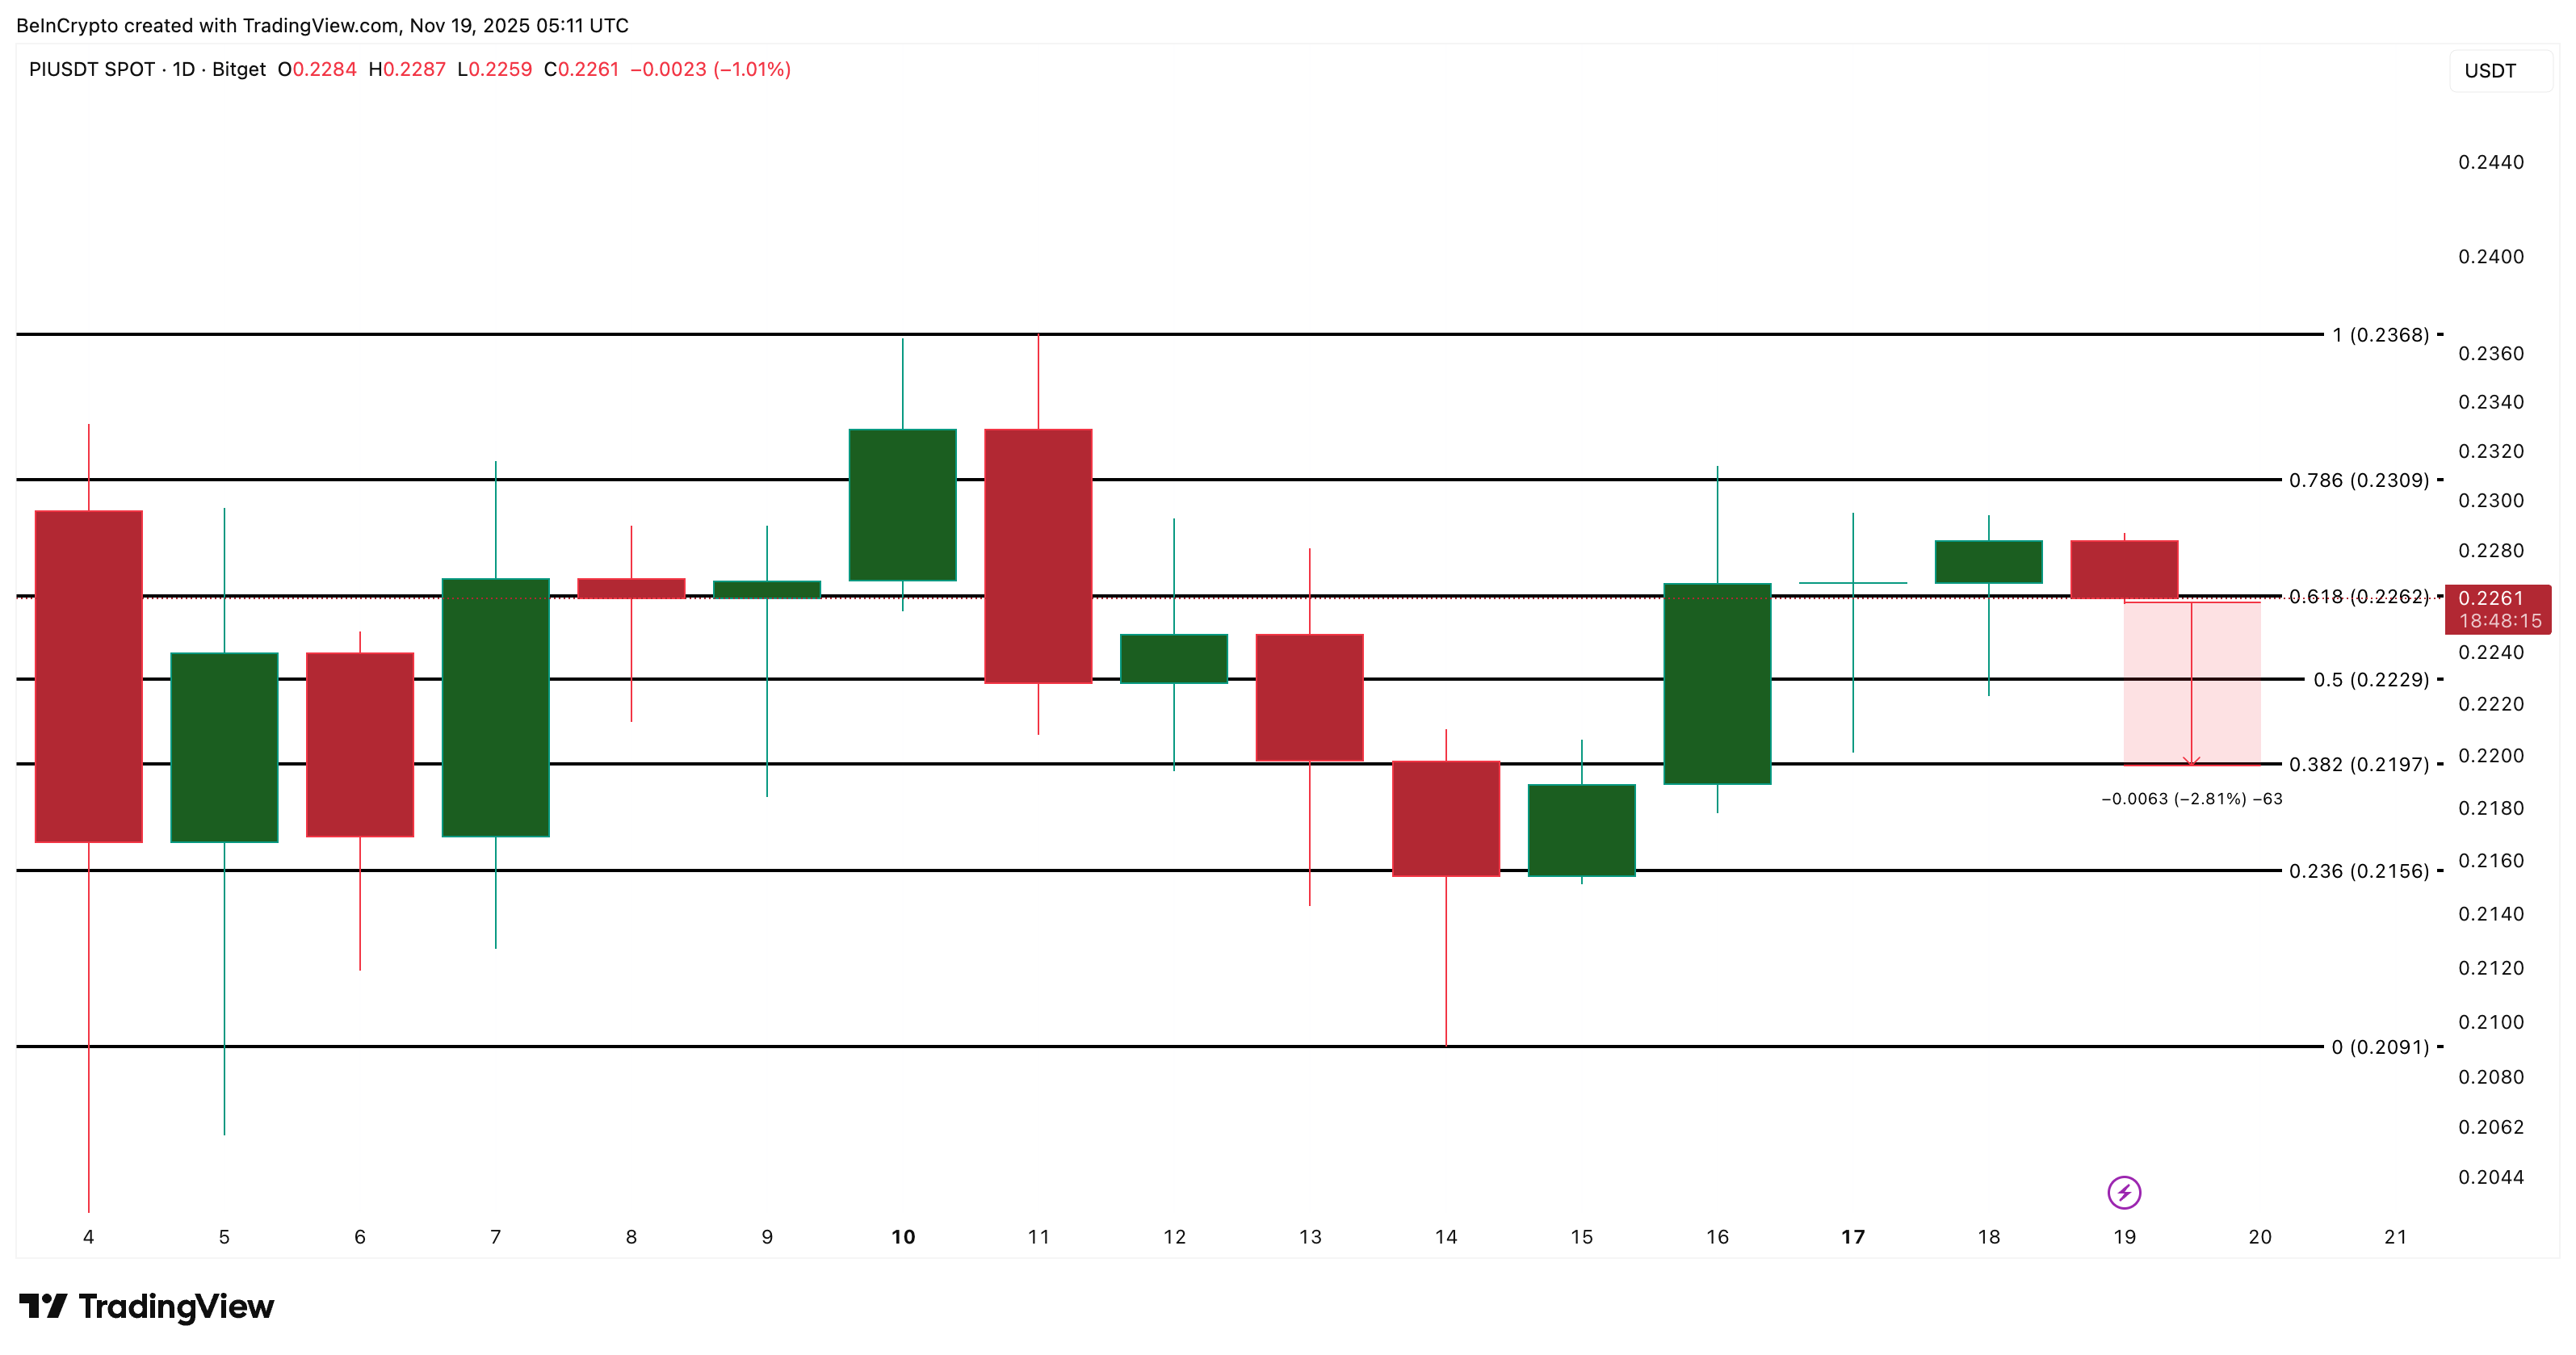
If a deeper pullback starts, the first key level PI must protect is $0.219. Holding above this level keeps the bounce alive. Losing it opens the way toward $0.209, which is the base where the last rebound began.
If buyers want to invalidate the bearish signs, PI needs to reclaim $0.230 and then break $0.236 with strong volume. Only then would the short-term trend flip back to positive.
 Pi Coin Price Analysis:
TradingView
Pi Coin Price Analysis:
TradingView
Pi Coin price is still green on the monthly chart, but the latest structure suggests traders should stay cautious. The indicators show rising weakness, and unless PI clears its resistance soon, the pullback zone may come into play.
Read the article at BeInCryptoDisclaimer: The content of this article solely reflects the author's opinion and does not represent the platform in any capacity. This article is not intended to serve as a reference for making investment decisions.
You may also like
Coast Guard Strengthens Prohibition of Hate Symbols to Combat Antisemitism and Extremist Activity
- U.S. Coast Guard reversed a policy to reclassify hate symbols like swastikas and nooses from "potentially divisive" to prohibited, following backlash from lawmakers and advocacy groups over antisemitism risks. - The reversal came after a leaked draft proposal aligned with Trump-era Pentagon directives, which critics argued weakened harassment definitions and accountability for hate incidents. - Coast Guard reaffirmed strict prohibitions on divisive symbols, emphasizing severe punishment for violations, b

Bitcoin Updates Today: MicroStrategy Faces a Bitcoin Conundrum: Should They Retain for Future Gains or Liquidate to Stay Afloat?
- MicroStrategy's stock hits 52-week low as Bitcoin dips below $88,000, testing its BTC treasury strategy's viability. - 650,000 BTC holdings now "underwater" at $74k average cost, limiting capital raises and straining liquidity instruments. - Preferred shares (STRD/STRK) fall 30-34% as market demands higher yields, while JPMorgan warns of $8.8B outflow risk from index exclusion. - CEO Saylor claims 80% BTC drop tolerance, but critics fear forced sales could trigger self-fulfilling price declines. - Weak c
XRP News Today: XRP Faces $1.75 Test as Buyers Confront $15M Withdrawals with ETFs on the Horizon
- XRP faces critical $1.75 support zone amid $15.5M outflows and 50% decline from July highs. - TD Sequential buy signals and ETF launches (Nov 18) could trigger rebounds or stabilize price. - Key resistance at $2.150 threatens bearish trend if $1.75 support fails to hold. - Market volatility highlights ETFs' potential to shift institutional adoption and price dynamics.
Blockchain Sheds Light on Criminal Networks While Meme Coins Transform the Future of Cryptocurrency
- UK's NCA dismantled a £1B crypto money-laundering network linking Russian entities to drug trafficking and war funding, arresting 128 and seizing £25M in cash/crypto. - Blockchain analytics tools like Chainalysis are enabling law enforcement to track illicit crypto flows, challenging the anonymity of public blockchains in cross-border crime. - Meme coin Apeing (APEING) emerges as a 1000x contender through community-driven momentum, transparent whitelist access, and structured communication, contrasting t