
This Bitcoin Price Level Stands Between Boom and Bust

Bitcoin has dropped almost 15% this month, pushing traders back into the “cycle top or deeper dip” debate. Several on-chain signals hint at selling exhaustion, but everything now rests on one resistance band. If Bitcoin clears it, the recovery starts. If not, the downside can accelerate quickly.
The Bitcoin price has dropped sharply this month. Since early November, it has fallen almost 15%, turning one of the strongest assets of the year into one of the weakest in the current pullback.
The drop has pushed the market into two camps again. Some believe this is the start of a deeper correction. Others believe the cycle is still unfolding, and this is merely an oversized dip. The next move depends on one level. If Bitcoin reclaims it, the rebound setup activates. If it fails there, the downside can widen fast.
Bitcoin Momentum Softens the Fall, but One Level Must Validate It
There are early signs that sellers may be losing strength.
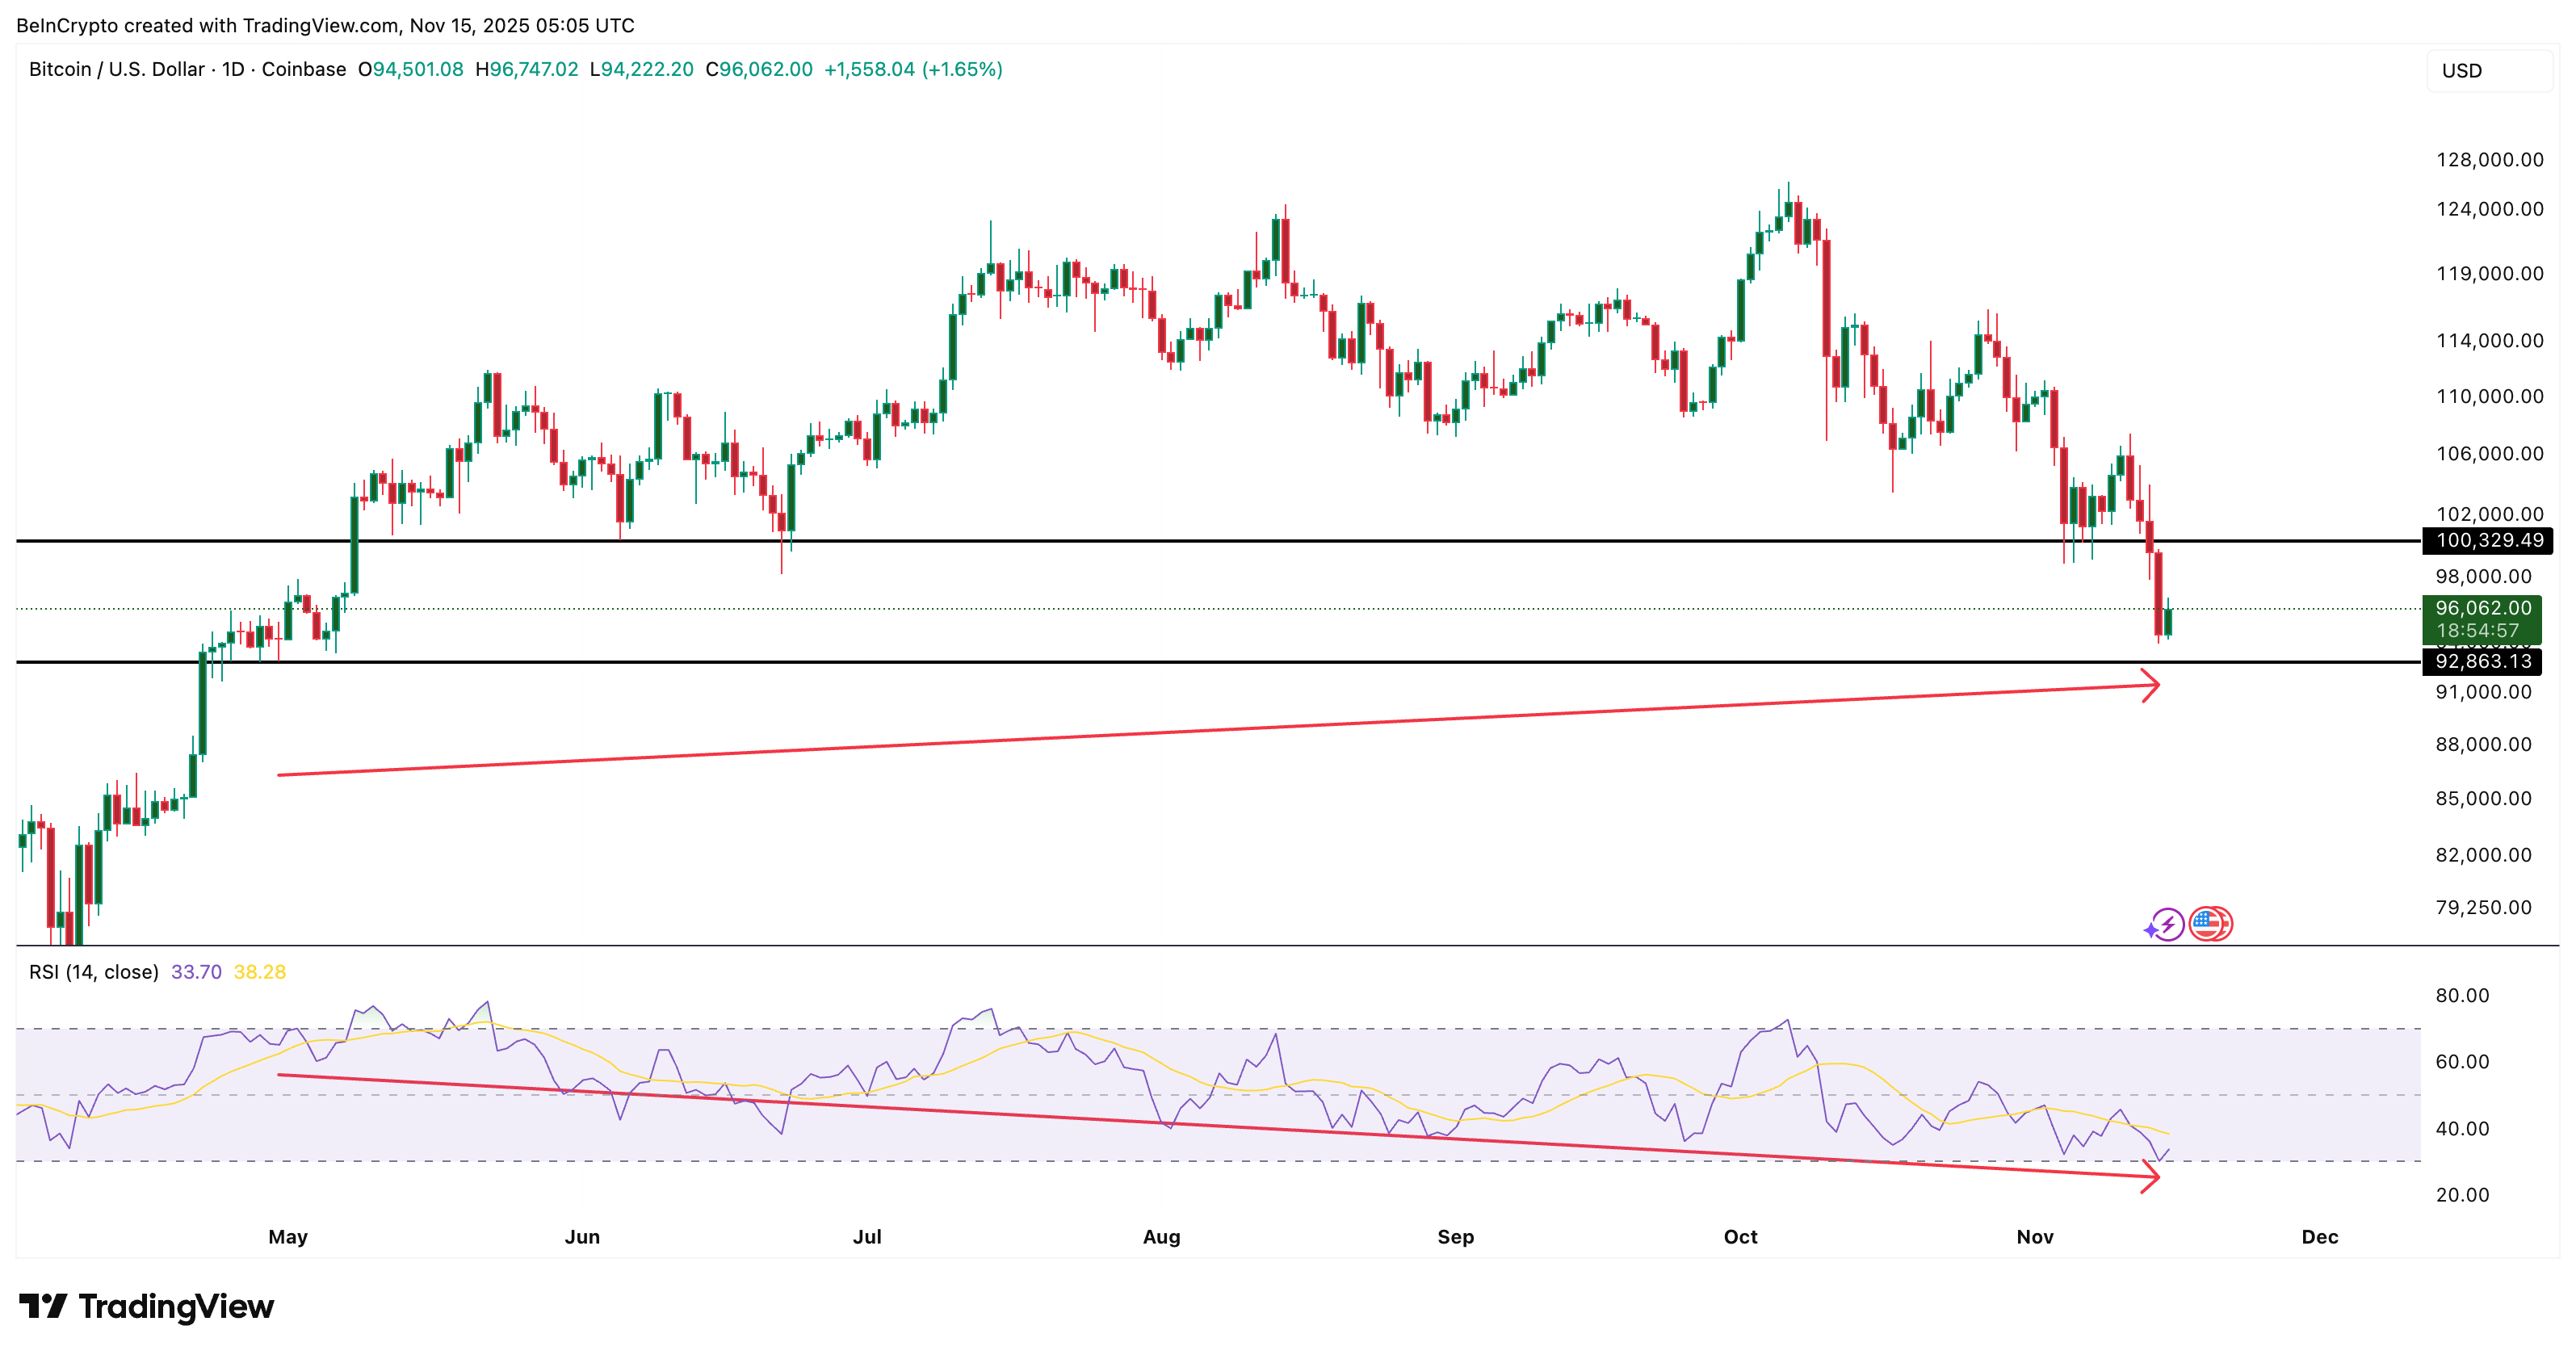
The Relative Strength Index entered the oversold zone this week and has since reversed. That usually shows that selling pressure is easing.
A longer-term pattern also supports that view. Between April 30 and November 14, Bitcoin price formed a higher low, which means the broader trend is not fully broken. However, over the same period, the RSI also made a lower low. This is a hidden bullish divergence, a signal that often appears when a strong trend is attempting to resume after a significant correction.
For the RSI sign to play out, the Bitcoin price must cross above $100,300 ( a key support since late April), which might now act as a psychological resistance.
 Bitcoin Sellers Might Be Getting Weaker:
TradingView
Bitcoin Sellers Might Be Getting Weaker:
TradingView
Want more token insights like this? Sign up for Editor Harsh Notariya’s Daily Crypto Newsletter here.
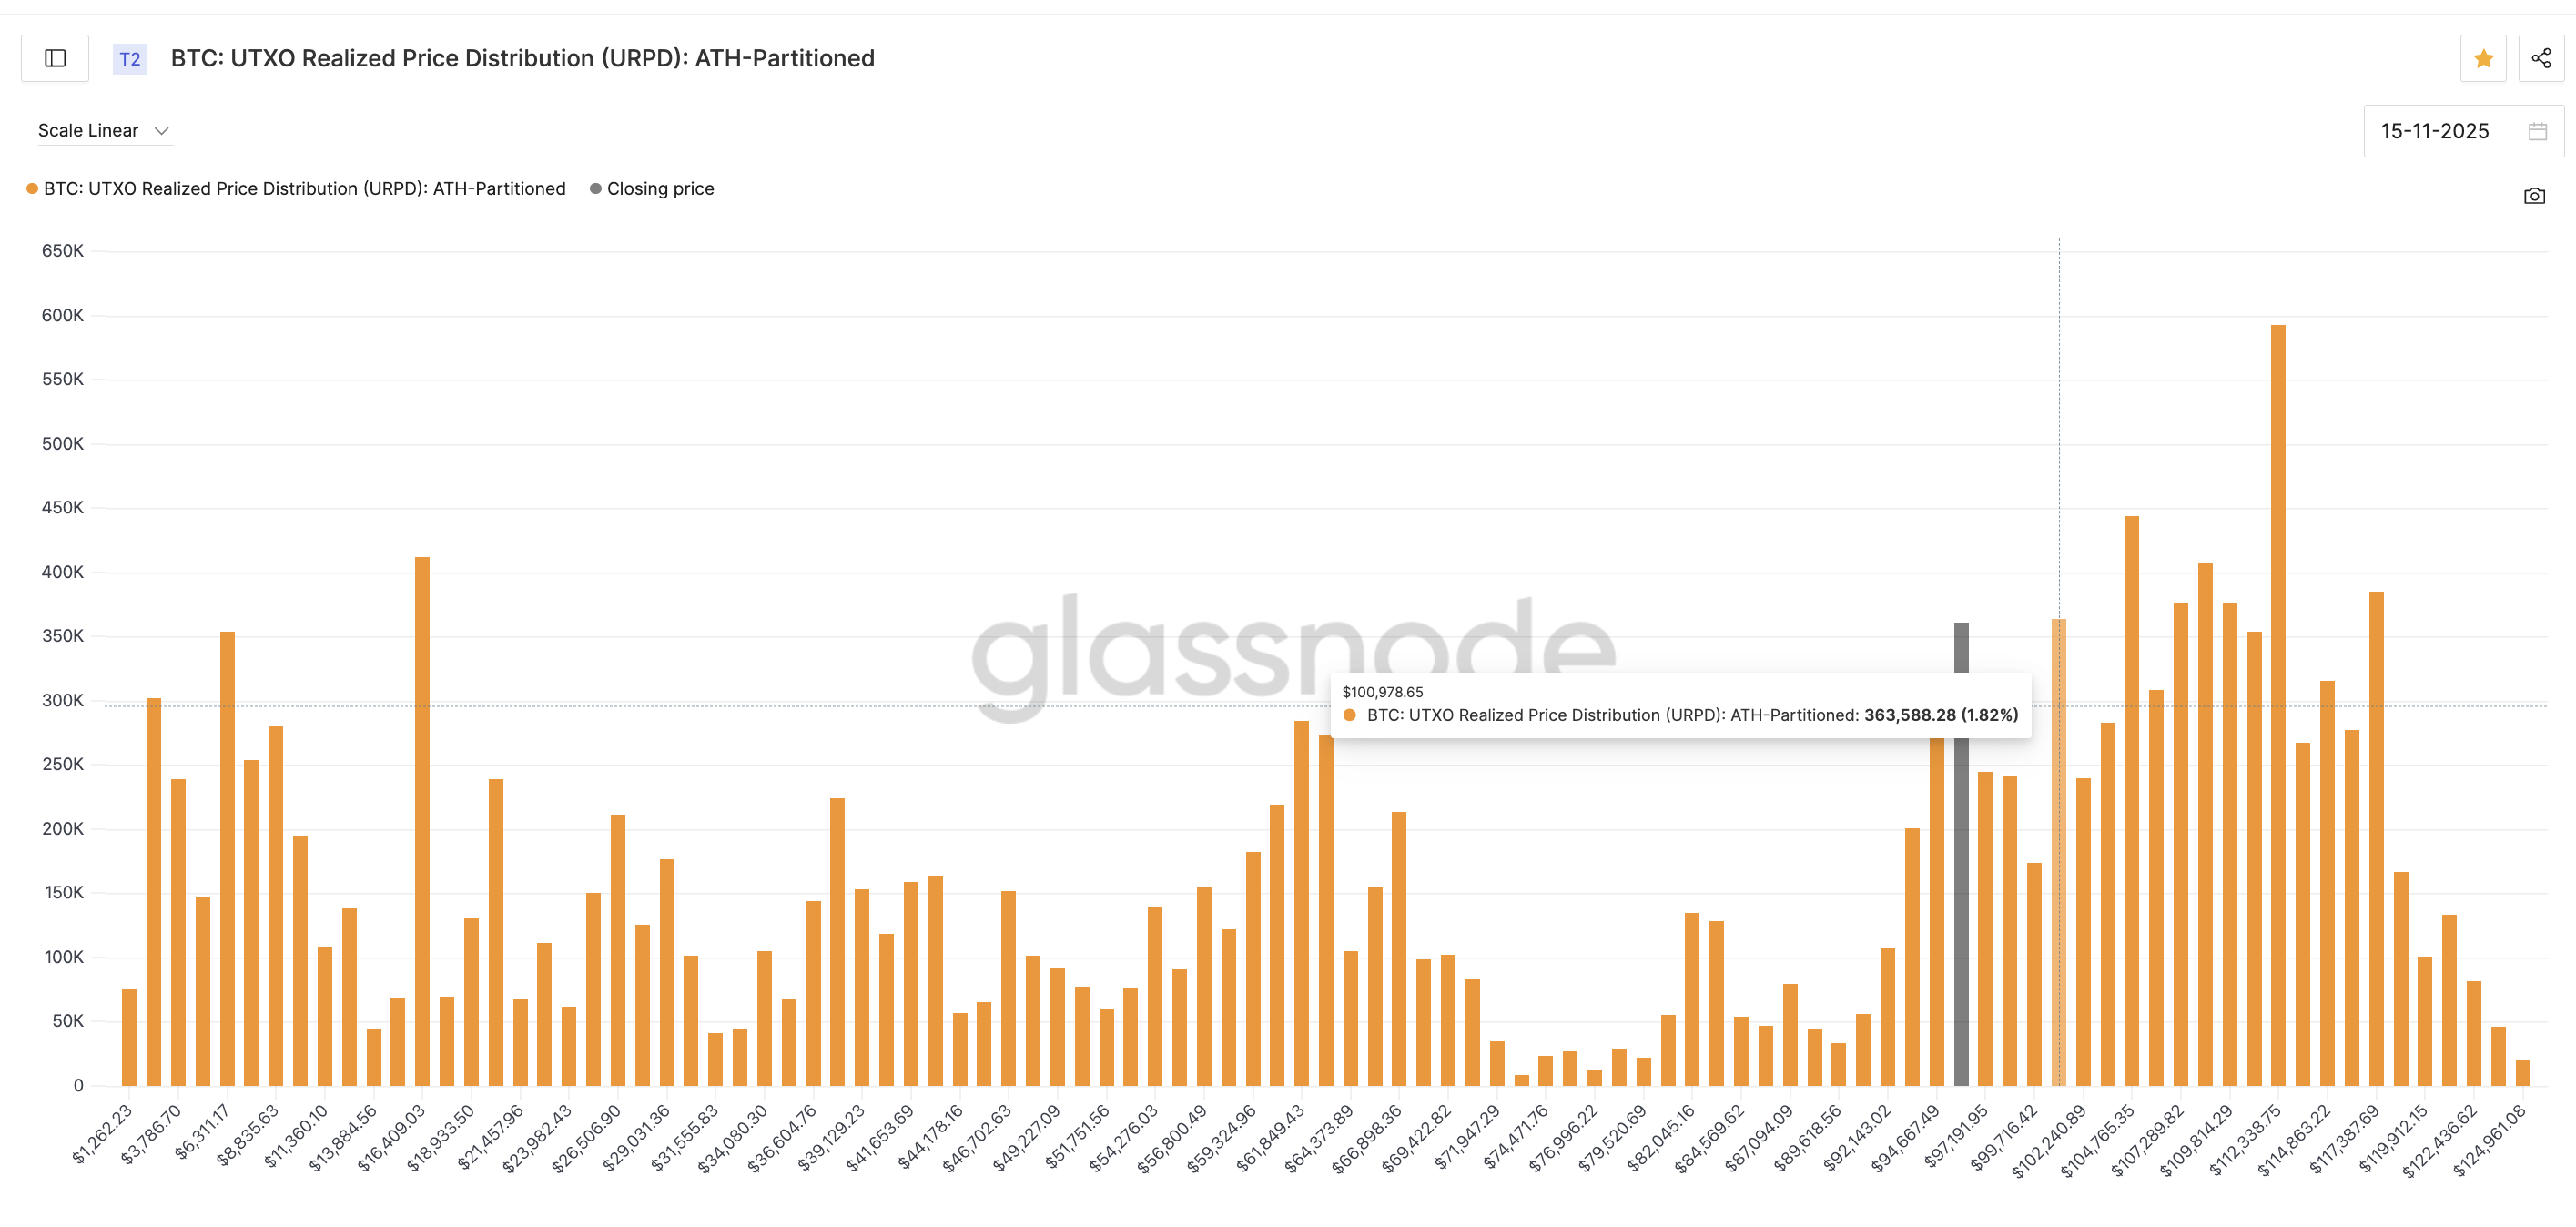
Supply data points to the same area on the chart. The UTXO Realized Price Distribution shows a large band of long-term Bitcoins created near the $100,900 zone.
When a cluster like this forms, it often becomes a significant decision point because a large portion of the supply is at the same cost basis. This cost-basis cluster falls near the resistance level highlighted on the RSI chart.
 Bitcoin Supply Zones:
Glassnode
Bitcoin Supply Zones:
Glassnode
This is why the momentum story only matters if the BTC price closes back above that region. Without that close, the divergence and oversold readings remain unconfirmed.
A One-Year Low in NUPL Keeps the Bottoming Case Alive
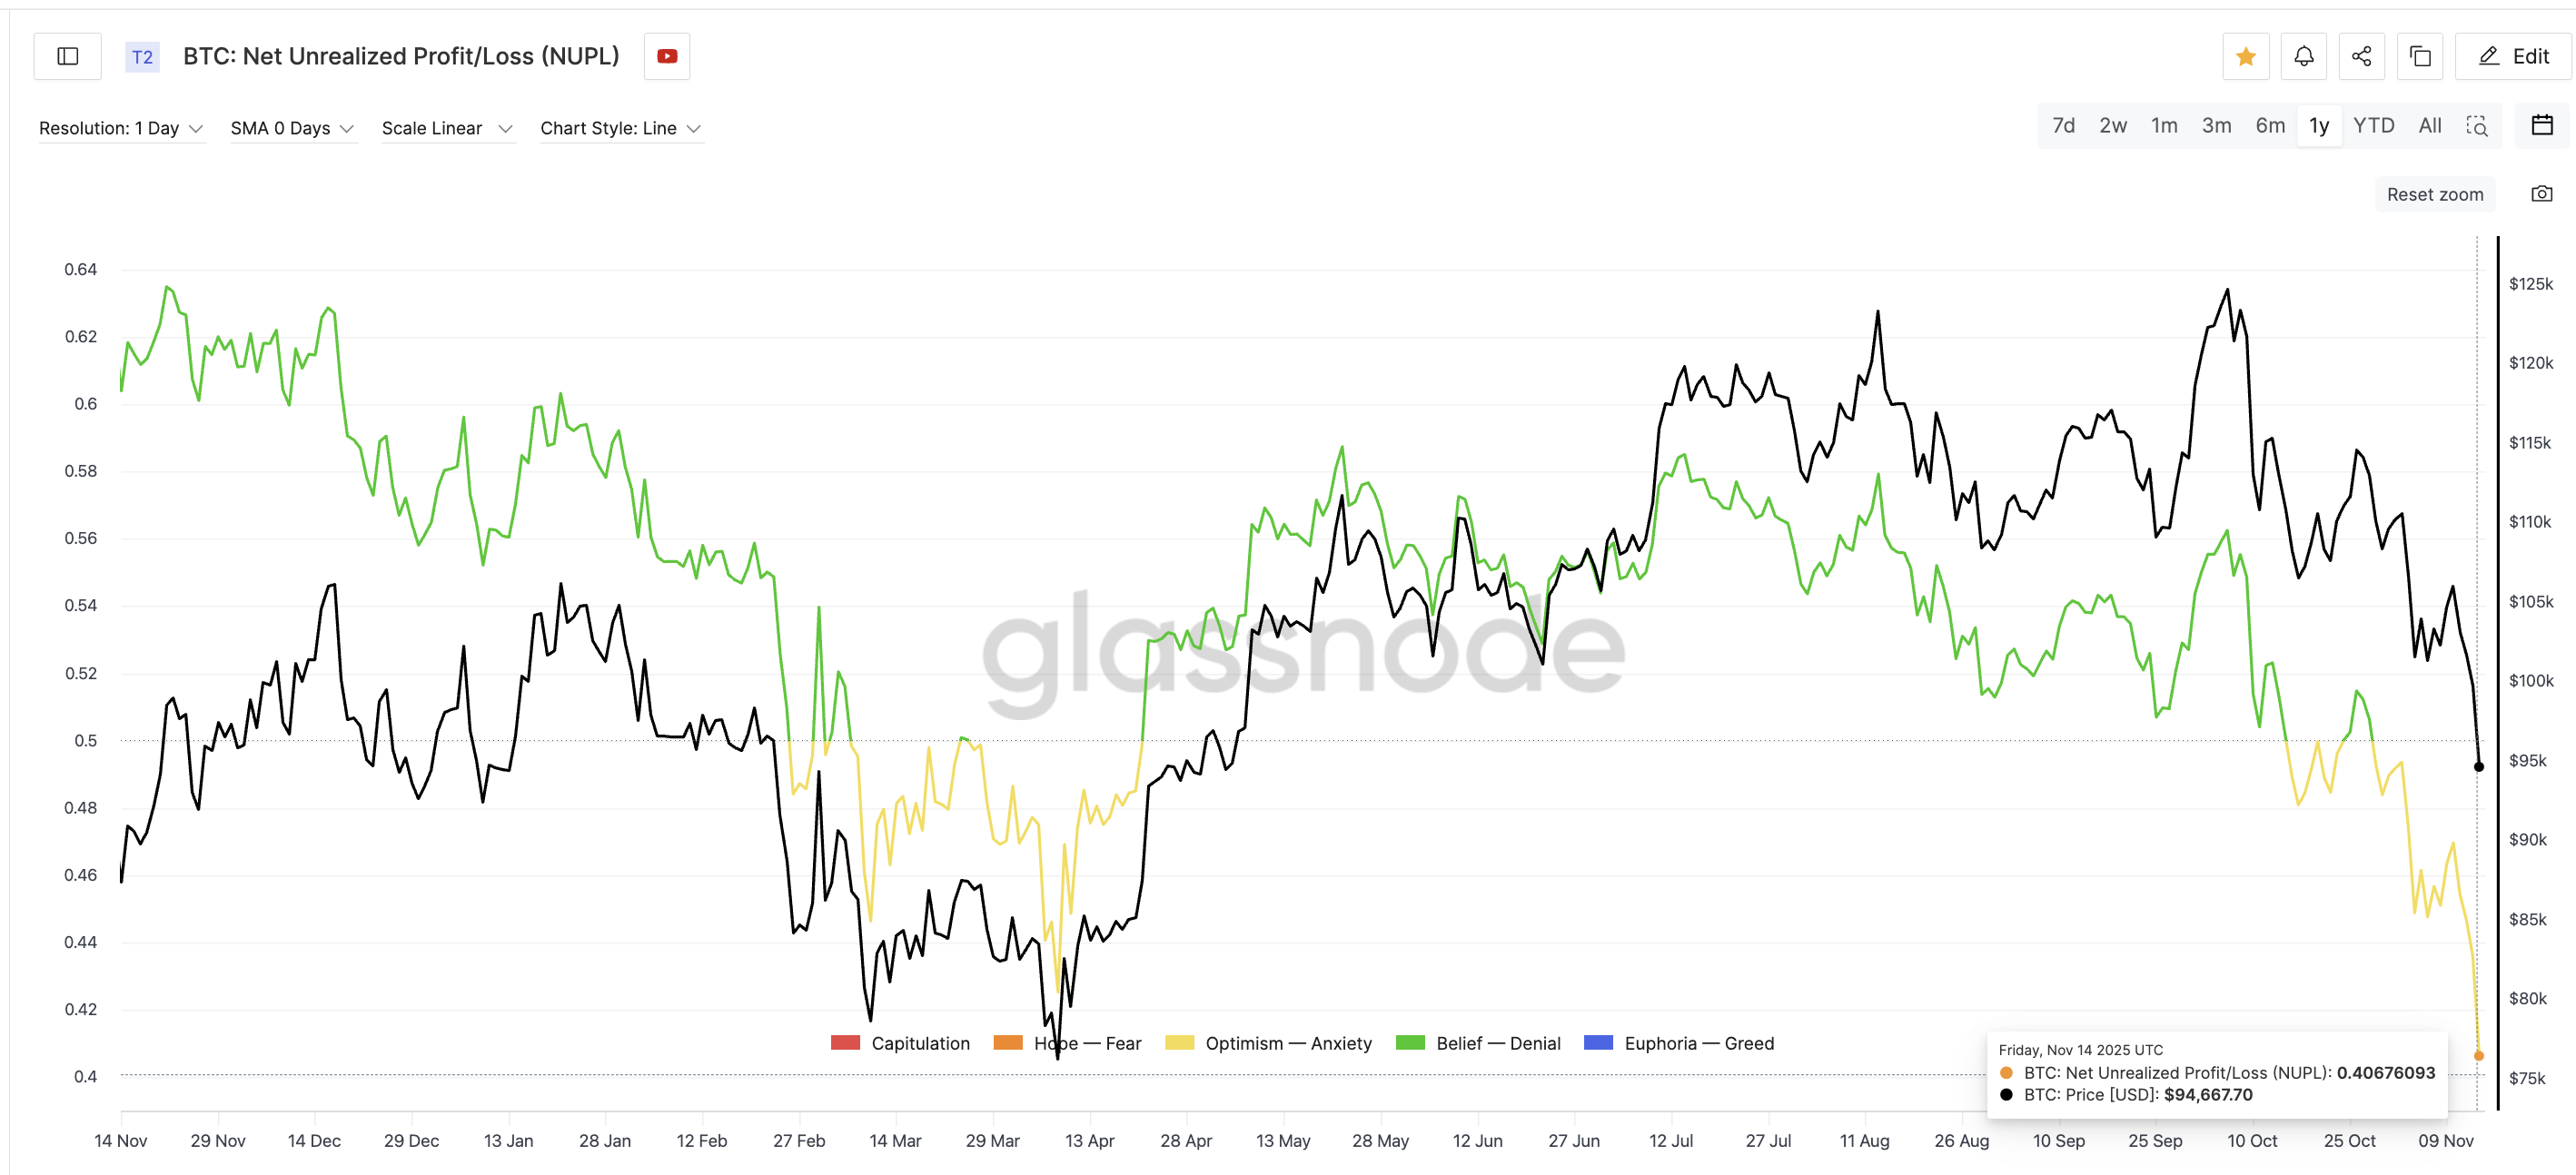
The second argument for a rebound comes from the Net Unrealized Profit/Loss metric.
NUPL has now dropped to 0.40, its lowest reading in a year. This means the market is back to holding very thin unrealized profits, similar to early-cycle periods.
The last time NUPL hit a comparable low was in April. From there, Bitcoin climbed roughly 46% in less than two months. While this does not guarantee a repeat, it shows the market is entering a familiar pressure zone where rebounds often form if the price can stabilize.
 Bottom Theory Remains Active:
Glassnode
Bottom Theory Remains Active:
Glassnode
But again, this indicator also depends on price reclaiming the same resistance band. Without that, the Bitcoin bottoming theory stays open but inactive.
Bitcoin Price Trades in a Falling Channel — With Two Critical Levels In Sight
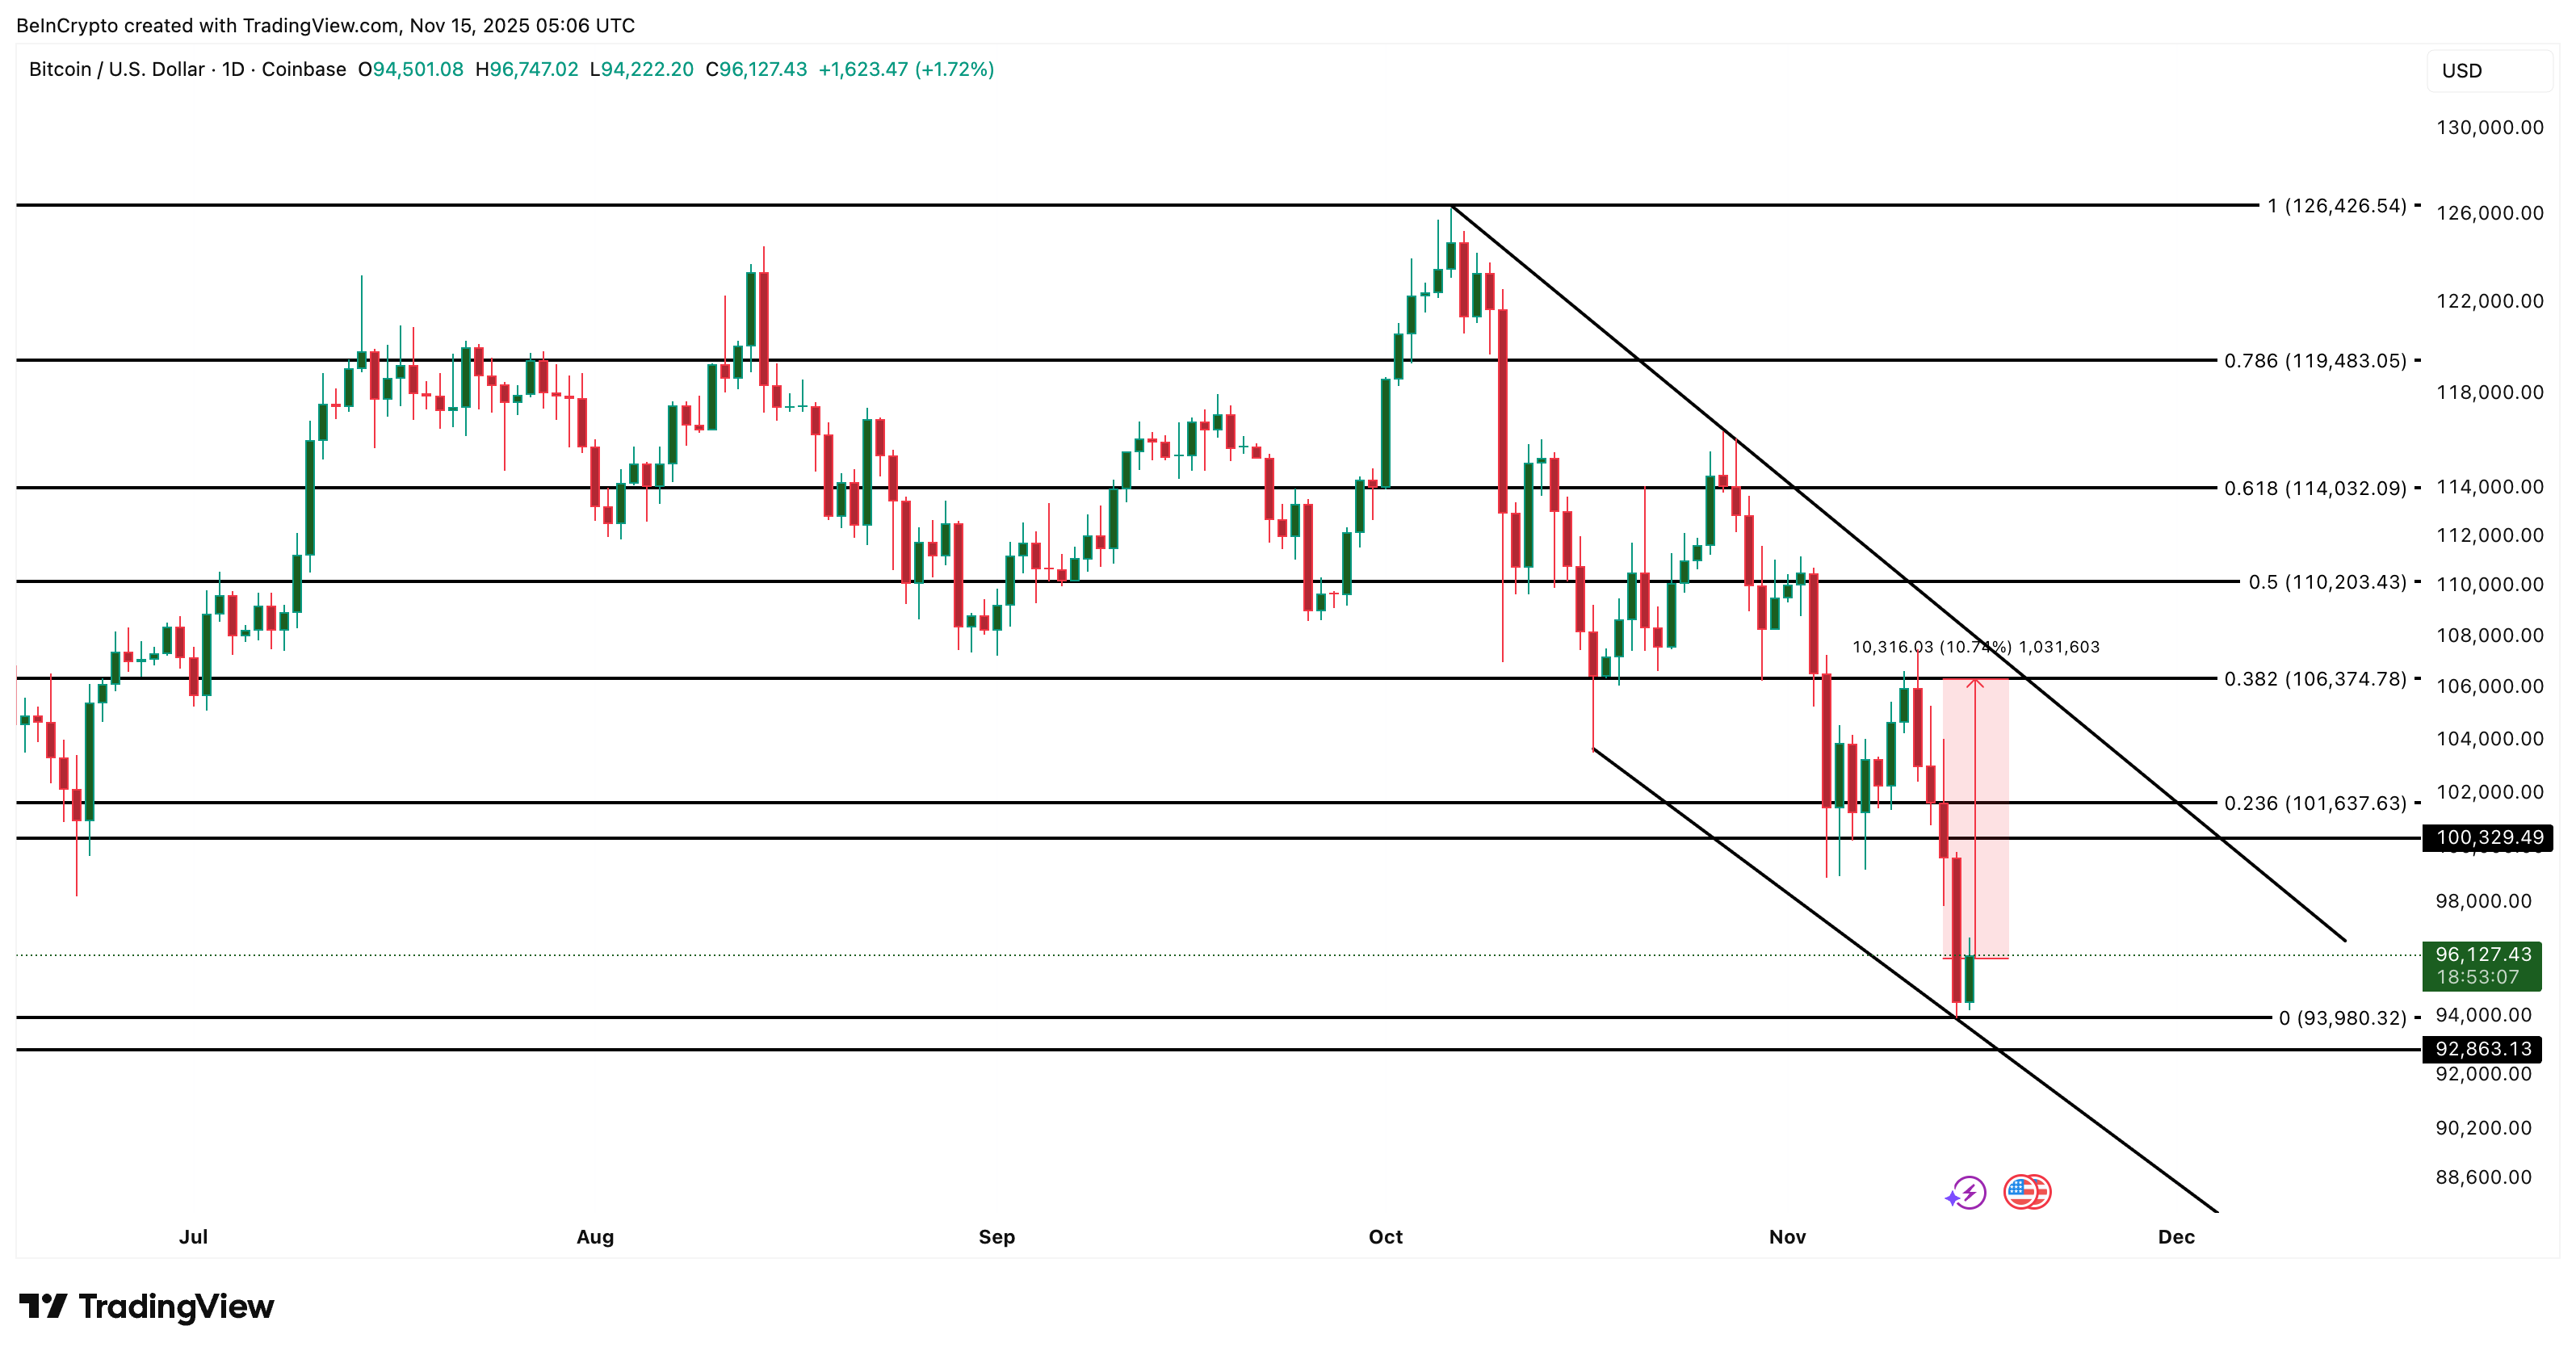
Bitcoin remains within a falling channel, maintaining a bearish short-term trend.
The first step out of it is simple: regain $100,300. A daily close above $101,600 strengthens the move and flips the old support back into support.
If that happens, the next important level sits near $106,300. Breaking above it would push Bitcoin out of the falling channel. That would shift the trend from bearish to neutral and could turn it bullish if momentum improves.
 Bitcoin Price Analysis:
TradingView
Bitcoin Price Analysis:
TradingView
The bust risk sits underneath. The lower band of the channel only has two clean touches, which makes it structurally weak. If Bitcoin loses $93,900–$92,800, the pattern opens deeper levels, and the “extended cycle” view becomes much harder to defend.
Right now, everything rests on one decision point. Above $100,300, the Bitcoin price stabilizes. Below $93,900, the slide can get much worse.
Read the article at BeInCryptoDisclaimer: The content of this article solely reflects the author's opinion and does not represent the platform in any capacity. This article is not intended to serve as a reference for making investment decisions.
You may also like
Bitcoin News Today: "As ETFs Experience Rapid Growth, Metaplanet Remains Steadfast in the Battle for Bitcoin Leadership"
- Metaplanet holds 30,823 BTC, aiming for 210,000 by 2027 via preferred shares. - MicroStrategy's market value discounts raise debt concerns despite CEO's confidence. - ETF growth and institutional interest shift Bitcoin's perception as a long-term asset. - Japan's $2T assets drive Metaplanet's Bitcoin-backed fixed-income strategy.

Bitcoin News Today: Bitcoin’s Plunge Below $96K Sparks Concerns Over a Bear Market Resurgence Similar to 2024
- Bitcoin fell below $96,000, erasing 2025 gains and triggering $44M in liquidations as ETF outflows hit $870M. - Market cap dropped 5.4% to $3.36T, with Ethereum and XRP hitting multi-month lows amid weak demand. - Chain metrics show 815,000 BTC sold by long-term holders, while Bull Score Index collapsed to 20 from 80. - Technical indicators warn of further declines below $93,500, testing 2024 bear market lows if support breaks. - MicroStrategy added $835M BTC despite criticism, but fear/greed index hit 1
Bitcoin News Today: Bitcoin ETFs See $870M Outflow as Long-Term Holder Selling Drives Price Near $80k
- Bitcoin’s price nears $80,000 as fear indices hit 16, signaling panic-driven capitulation. - $870M ETF outflows and 815,000 BTC sold by LTHs accelerate downward pressure since October. - Key technical levels breached: 365-day SMA broken, 50-week SMA at risk, bear market risks rising. - Ethereum faces 200-day EMA resistance; whales accumulate ETH despite $3.66B in ETF outflows. - STHs near 12.79% losses, 6-12M holder cost basis at $94,000 may offer temporary support.

Bitcoin News Update: Bitcoin ETF Sees $1.5 Billion Withdrawals While Institutional Investors Increase Their Holdings
- BlackRock's IBIT ETF saw $1.5B net outflows over 10 days as investors reassess Bitcoin exposure amid volatility. - Harvard University boosted IBIT holdings to $442.8M, surpassing its combined stake in major tech firms, while diversifying into gold . - Institutional ownership in IBIT rose to 29% QoQ, with UAE entities and sovereign wealth funds among key holders, signaling crypto's growing institutional acceptance. - KuCoin expanded institutional services as ETF outflows highlight market recalibration, wi