YFI has dropped 41.08% over the past year, experiencing fluctuating short-term movements.
- YFI fell 0.02% in 24 hours, 5.94% weekly, but rose 0.04% monthly amid 41.08% annual decline. - Price swings reflect mixed short-term stability and long-term fragility driven by macroeconomic factors. - Backtesting showed -2.15% average return post-41.08% annual drops, with no abnormal gains detected. - Market dynamics suggest prolonged consolidation rather than isolated events caused the sustained decline.
As of November 14, 2025, YFI slipped by 0.02% over the previous 24 hours, settling at $4,708. This marks a 5.94% drop over the last week. Although the asset managed a slight 0.04% gain over the past month, it has suffered a substantial 41.08% loss over the past year, highlighting a persistent pattern of underperformance despite some recent steadiness.
YFI’s price action demonstrates a blend of short-term steadiness and longer-term vulnerability. The marginal monthly rise and minor daily decrease point to some market optimism, but the declines over the week and especially the year reveal ongoing challenges in sustaining upward momentum. Such trends are typical among highly volatile assets, where brief recoveries can obscure deeper, ongoing issues.
There has been little significant news directly tied to YFI during this period, making it challenging to identify a single cause for its price movement. Still, the 41.08% annual drop hints at a wider market reevaluation or a shift in risk preferences. The lack of notable institutional moves, regulatory changes, or fundamental improvements suggests that broader economic conditions or shifts in investor sentiment have been the main drivers.
When assessing YFI’s performance, it’s important to weigh both macroeconomic factors and investor actions. The relatively stable 7-day and 1-month results contrast sharply with the 1-year decline, underscoring the limits of recent stability. This disparity indicates that, while the market may be waiting for recovery signals, it has yet to find enough reasons to reverse the longer-term downward trend.
YFI’s recent behavior mirrors patterns seen in other volatile assets, where a lack of strong fundamentals or clear market leadership can result in extended periods of stagnation or further losses. The 41.08% yearly decline, though significant, is part of a larger market trend that has not yet supported a sustained recovery.
The asset’s price changes, combined with the absence of direct news, suggest that broader economic signals or a general risk-averse mood are influencing the market, rather than any YFI-specific developments. This makes it hard to attribute the decline to a single cause, but it does highlight the impact of external factors on the asset’s direction.
Backtest Hypothesis
From a technical standpoint, YFI’s performance was analyzed using an event-driven backtesting approach covering January 1, 2022, through November 14, 2025. The focus was on periods where the asset dropped by at least 41.08% year-over-year, matching the recent annual result. During this timeframe, 497 such events were identified, showing that large annual declines have occurred frequently.
The backtest showed that, on average, YFI returned -2.15% over the 30 trading days following each major drawdown, which is worse than the -0.82% benchmark. This indicates that the market typically performs poorly immediately after significant annual losses. The success rate for achieving positive returns after holding for 30 days was just 34%, highlighting the difficulty of profiting after such events.
Importantly, no individual day within the 30-day period exhibited statistically significant abnormal returns at standard thresholds. This means the hypothesis that severe drawdowns are not followed by unusual performance cannot be dismissed. In other words, while short-term volatility may occur, there is no consistent pattern of excess returns after these declines.
Disclaimer: The content of this article solely reflects the author's opinion and does not represent the platform in any capacity. This article is not intended to serve as a reference for making investment decisions.
You may also like
Bitcoin Updates Today: Crypto's 2025 Slump: Hopefulness Versus Ongoing Vulnerability
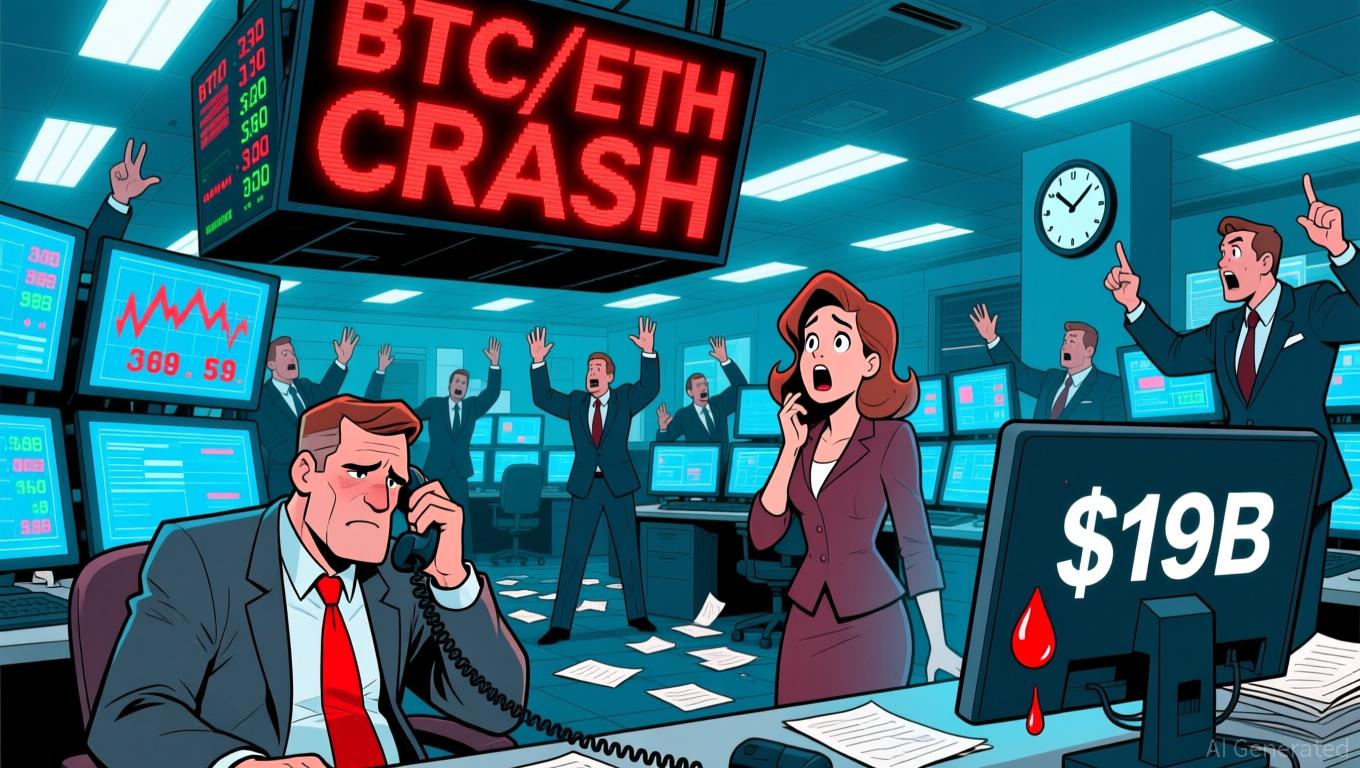
- The 2025 crypto bear market, marked by a $19B liquidation event, is deemed calmer than 2022’s collapses due to stable DeFi and no major institutional failures. - Trump’s 100% China tariff and export threats triggered sharp price drops, but Haseeb Qureshi highlights improved fundamentals and resilient infrastructure. - Critics like YQ question sustainability, citing weak small-cap liquidity and speculative assets, while Bloomberg notes bearish ETF flows and reduced institutional activity. - Macroeconomic
Ethereum News Update: Major Ethereum Holders Resist Market Decline: Leveraged Purchases Indicate Strong Belief in Price Floor
- Ethereum whales accumulate $1.33B ETH via leveraged DeFi tools like Aave amid market uncertainty. - Whale buying absorbs liquidity and reinforces support zones, countering ETF outflows and retail liquidations. - Upcoming Fusaka upgrade (Dec) aims to boost scalability, potentially driving revaluation post-volatility. - Mixed technical indicators show oversold RSI but bearish MACD, with key support at $3,250-$3,131. - Analysts debate whale accumulation's impact: some see bottom signals, others warn of leve

Corporate Sector Relies on Cash Reserves and Strategic Discipline to Steer Through an Unpredictable Financial Environment
- U.S. corporations are leveraging improved liquidity and disciplined strategies to boost growth, with energy, logistics, and tech firms reporting strong earnings and strategic investments. - Natural Gas Services Group raised 2025 EBITDA guidance to $78–$81M due to record fleet growth and Devon Energy collaboration, while Proficient Auto Logistics saw 24.9% Q3 revenue growth from operational efficiency. - Technology firms like TASE and Amdocs demonstrated resilience through 35% revenue growth and dividend

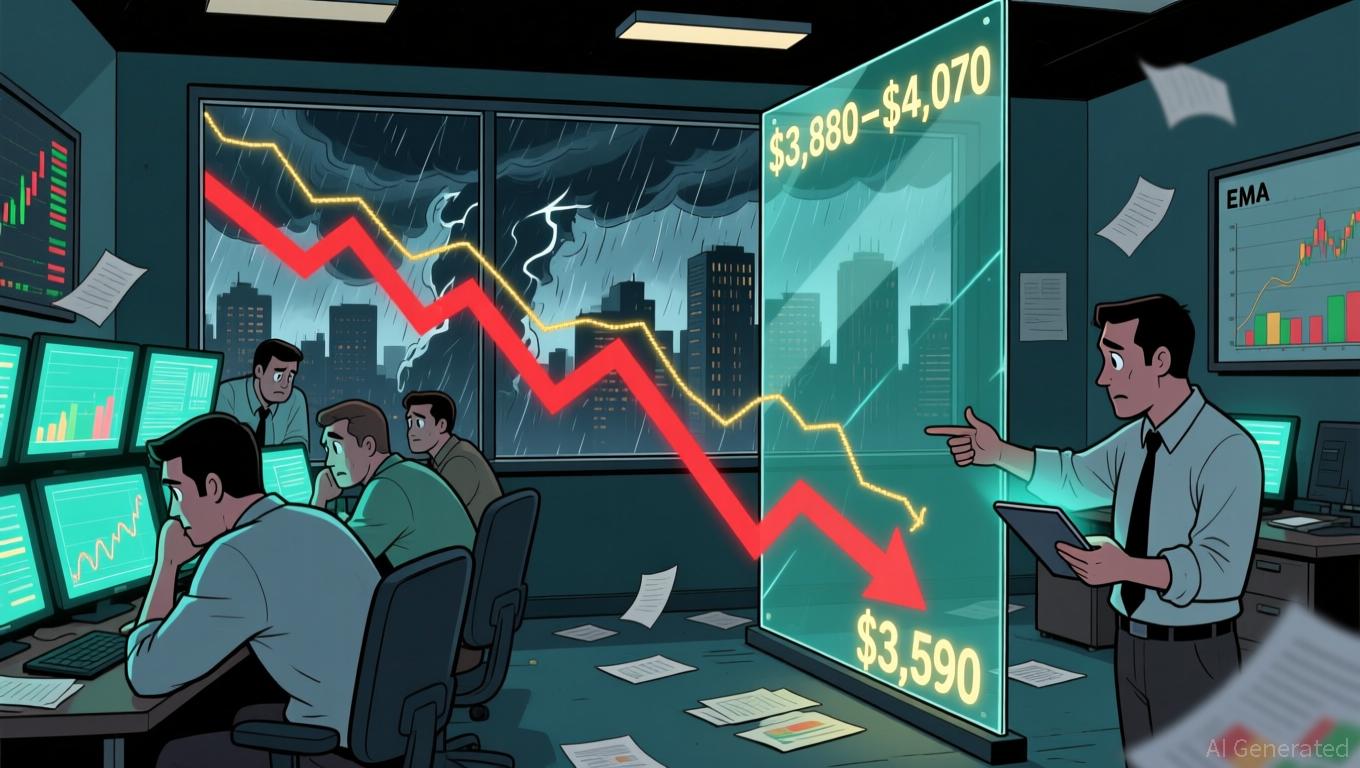
Ethereum News Update: While Ethereum Dominates with $201B in Tokenized Assets, Institutional Investments Grow Amid Price Challenges
- Ethereum leads tokenized assets with $201B, 64% of $314B market, driven by institutional AUM surging 2,000% since 2024. - ETH price struggles under $3,590 as technical indicators flag resistance at $3,880-$4,070 and rising exchange outflows. - Stablecoins ($18T annualized volume) and $12B RWA tokenize real-world assets, expanding Ethereum's utility beyond settlement. - Derivatives show $40.67B open interest but leveraged longs risk cascading liquidations if $4,070 resistance fails.