YFI drops 5.69% amid increasing short-term market fluctuations
- YFI fell 5.69% in 24 hours on Nov 8, 2025, but rose 7% in 7 days and 3.29% in 30 days amid heightened volatility. - The sharp drop triggered technical buying, while monthly gains suggest partial recovery after a 39.17% annual decline. - Analysts highlight critical support/resistance levels, with short-term reversal potential pending confirmation. - A backtest of historical 10%+ daily drops could assess if this pullback aligns with typical recovery patterns.
On November 8, 2025, YFI experienced a 5.69% decrease over a 24-hour period, falling to $4,877. Over the past week, YFI gained 7%, saw a 3.29% rise in the last month, but declined by 39.17% over the previous year. These movements highlight significant short-term fluctuations, even as the asset has shown some recovery in the past month. The notable drop within a single day points to possible selling pressure, which may have been caused by market corrections or changing investor sentiment.
Looking at the last seven days, the 7% increase suggests that the recent decline may have attracted buyers, including technical traders and long-term holders. The 3.29% growth over the past month indicates a degree of stabilization following the broader losses seen over the year. The contrast between weekly and monthly performance, despite the sharp daily fall, reveals a market that is optimistic in the short run but remains wary about the longer-term outlook.
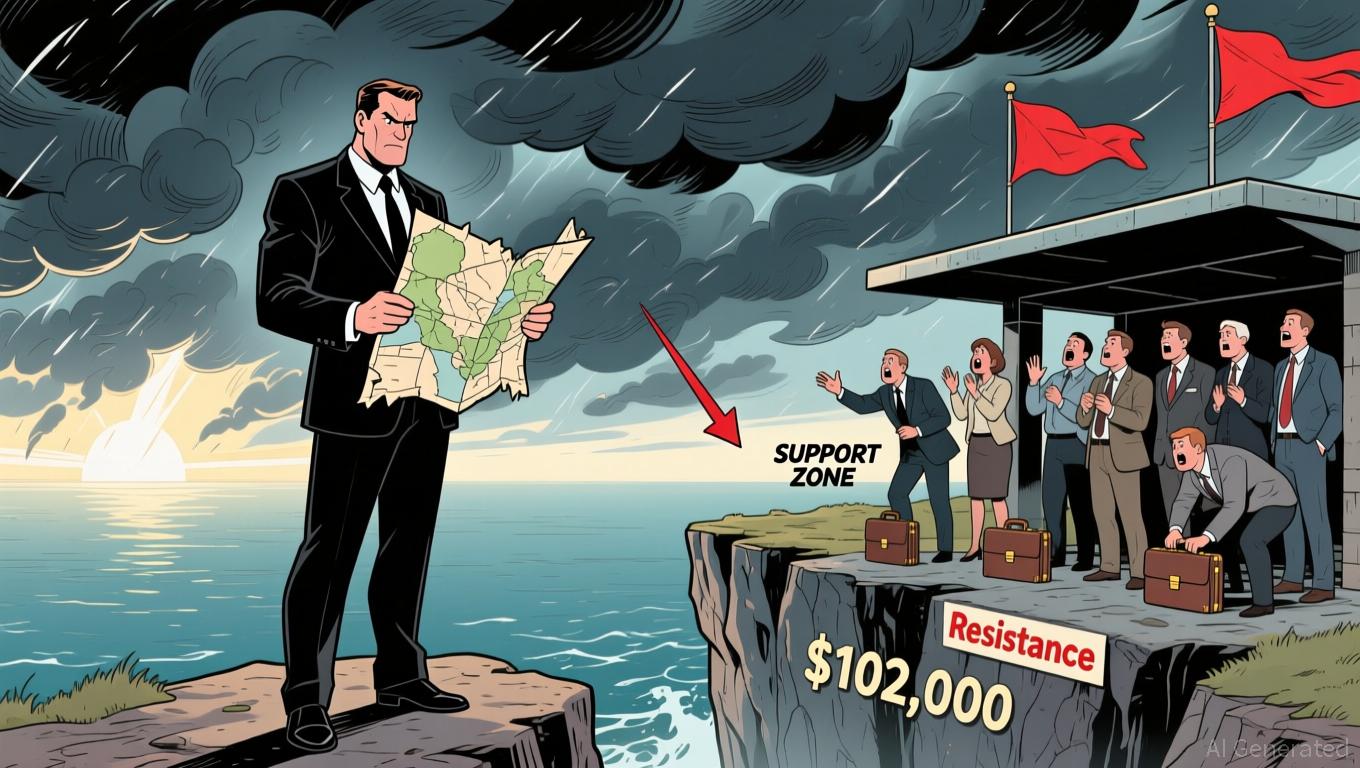
Technical experts have identified important support and resistance zones based on recent price movements. The recent short-term decline has brought YFI near a significant support level, raising uncertainty about whether the price will rebound or continue to fall. Meanwhile, the gains over the past week and month imply that the recent drop could be a temporary correction rather than the start of a larger downtrend. Monitoring these levels will be crucial for forecasting the asset's direction in the coming weeks.
Backtest Hypothesis
To assess the probability of a short-term rebound following the 5.69% decrease, a technical backtest can be conducted using relevant price history. This would involve searching for instances where YFI experienced a daily drop of 10% or more and then recovered within three to five days. Such a study would clarify whether the current decline fits historical patterns of volatility recovery or signals a more extended downward phase.
Disclaimer: The content of this article solely reflects the author's opinion and does not represent the platform in any capacity. This article is not intended to serve as a reference for making investment decisions.
You may also like
Polymarket's Regulatory-Focused Beta Poses a Challenge to Leading U.S. Prediction Market Platforms
- Polymarket relaunched its U.S. trading platform in beta after CFTC settlement and acquiring QCX, a licensed derivatives exchange. - The platform partners with Yahoo Finance and raised $205M, positioning itself as a compliance-focused rival to Kalshi Inc. - Blockchain integration enables instant settlements, while regulatory alignment and user trust remain critical for industry credibility. - Early traction shows expanded market offerings beyond sports/politics, challenging traditional prediction market d

SUI News Today: SUI Holds at $2.02—Will This Level Trigger a Surge Toward $20?
- Sui's SUI token consolidates near $2.02 support, with bullish analysts projecting potential $2.50-$20 moves following Mysticeti v2 upgrades and Beep Protocol liquidity injections. - Technical indicators show re-accumulation patterns between $1.6-$2, while partnerships with Crypto.com and Bluefin boost institutional exposure and network efficiency. - Risks include a $103M token unlock in 2026 and market volatility, though 35% improved network efficiency and growing developer activity strengthen long-term

Circle’s native cryptocurrency seeks to transform how digital money is managed online
- Circle plans to launch a native token on its Arc blockchain to boost network participation and decentralization, following a 66% revenue surge to $740M in Q3 2025. - The Arc Network, designed for stablecoin transactions with sub-second finality, has attracted 100+ participants including Goldman Sachs and Visa since its October testnet launch. - USDC circulation hit $73.7B (up 108% YoY), while analysts project its supply could triple by 2027, though regulatory challenges loom over tokenized governance mod

Bitcoin Updates: Optimistic ETFs Face Off Against Market Swings as Bitcoin Encounters Key Support Level
- Bitcoin fell 0.9% on Nov 11, 2025, testing $102,000 support amid heavy selling and lower highs. - ETF inflows ($524M) favored Bitcoin over Ethereum (-$107M), but weak post-shutdown inflows raised sustainability concerns. - On-chain data showed 23% higher spot volume and rising whale activity (EWR 0.55), suggesting accumulation. - Analysts debated $102,000's resilience, with potential targets at $107,400 or $100,500 depending on institutional buying.