Author: Yuuki, Deep Tide TechFlow
TL;DR
Recent market downturns are due to temporary macro headwinds, the industry black swan event on 10.11, and capital competition among the US, South Korea, and China stock markets. In the long term, the Federal Reserve's precautionary rate cuts and mild liquidity injection have not generated enough buying pressure to outweigh the selling pressure from new crypto asset issuances and token unlocks. This is reflected in the growth of the total crypto market cap but the decline in most token prices, resulting in a perceived bear market for secondary market investors. In the short term, pay attention to the US government reopening and the effective date of the Fed's balance sheet reduction ending (December 1); in the long term, focus on the pace of rate cuts and the capital competition between the crypto market and other risk markets.
1. The total crypto market cap grows in sync with liquidity easing, but massive asset supply leads to poor price performance
1. Over the long term, the growth of the total crypto market cap is highly correlated with the growth of global risk markets
The release of macro liquidity affects mainstream global risk assets. Comparing the total crypto market cap with the US stock market cap, it is not difficult to see that the two have a high correlation in their long-term up and down cycles.
The chart below shows the past year:
Red line: total crypto market cap;
Green line: total market cap of altcoins excluding BTC and ETH;
Blue line: S&P 500 index trend;
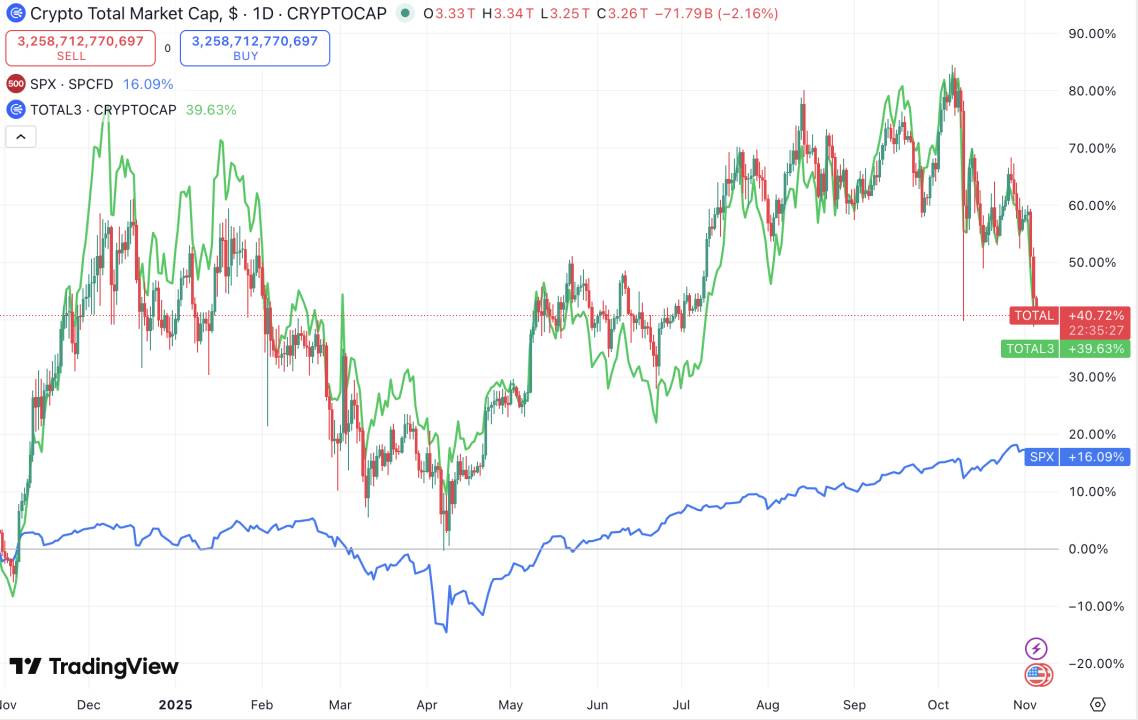
2024.11-2025.11 Total, Total3 & SPX
Data source: TradingView
Several phenomena are clearly visible:
1. Crypto market cap growth outpaces US stocks
2. The three basically oscillate in sync, bottom out, and restart upward (recently, due to the 10.11 crypto black swan, the ups and downs are not synchronized, which will not be discussed further here)
2. Massive asset supply leads to rising altcoin market cap but falling token prices
Growth in total market cap does not mean investors are making money. Over the past year, the crypto market has seen a large number of new asset issuances, and many projects (especially public chains, DeFi, and AI sector tokens launched in the 2021-2023 cycle) have entered peak unlock periods, bringing sustained supply pressure to the market. According to Tokenmist data, about $30 billion in new token unlocks have occurred in the past three months.
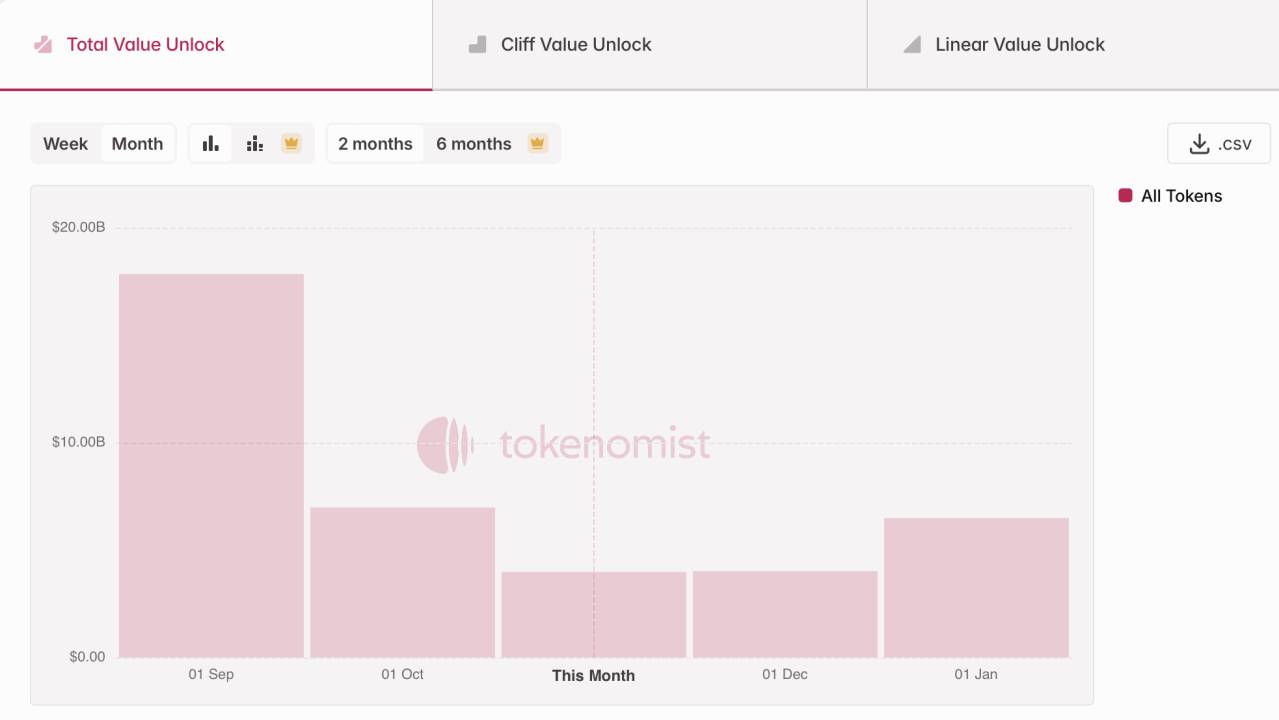
About $30 billion in token unlocks in the past three months
Data source: Tokenmist
In summary, the Federal Reserve's current precautionary and mild rate cuts, and the mild buying pressure from liquidity injection, have not outweighed the selling pressure from new crypto asset issuances and token unlocks. This is reflected in the growth of the total crypto market cap but the decline in most token prices, resulting in a perceived bear market for secondary market investors.
2. In the short term, macro liquidity is facing temporary headwinds
In the long run, we are still in a historical process of monetary and fiscal easing; but in the short term, the US government shutdown, the TGA account's inflows without outflows causing fiscal liquidity headwinds, and the Fed's slower-than-expected rate cuts causing monetary liquidity headwinds cannot be ignored. At the same time, the global risk appetite decline caused by US-China tensions continues to affect the market.
(Note: The TGA account, or Treasury General Account, can be understood as the US Treasury's bank account. The Treasury deposits funds from bond issuance and tax revenue into this account for fiscal spending, such as payroll or infrastructure. Therefore, a rising TGA balance means fiscal funds are locked in the account and have not flowed into the economy, causing short-term fiscal liquidity tightening. This situation has been amplified by the recent US government shutdown.)
1. Fiscal side: TGA account "inflows only, no outflows" locks up funds.
Long-term deadlock in congressional budget appropriations and a record-breaking US government shutdown have led to fiscal funds only flowing in, not out, forming a temporary liquidity drain. As of October 29, 2025, the TGA account balance has grown to $957.8 billion, and on November 4, the US government conducted another $274 billion short-term debt auction;
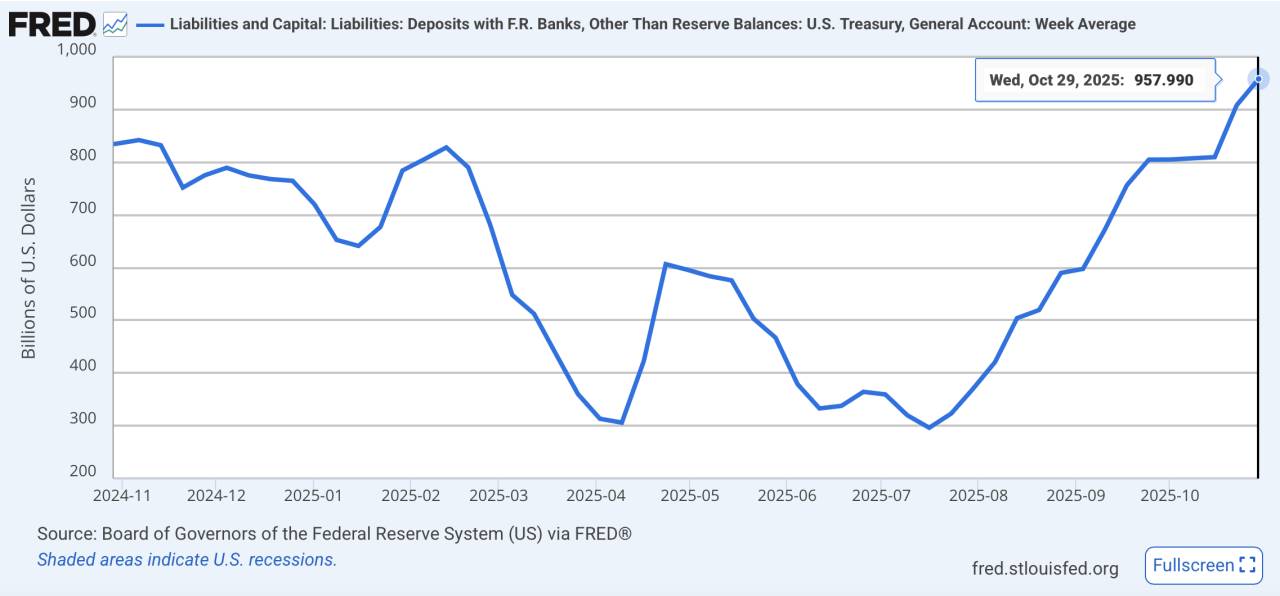
TGA balance climbs to a one-year high
Data source: FRED
2. Monetary side: Rate cut pace lags expectations.
Although we are currently in a Fed rate-cutting cycle, the pace of rate cuts is far below market expectations; real interest rates remain relatively high. In particular, Powell's recent remarks at the FOMC meeting did not commit to a rate cut in December, further dampening market confidence; at the same time, this precautionary rate cutting also reflects concerns about a potential recession.
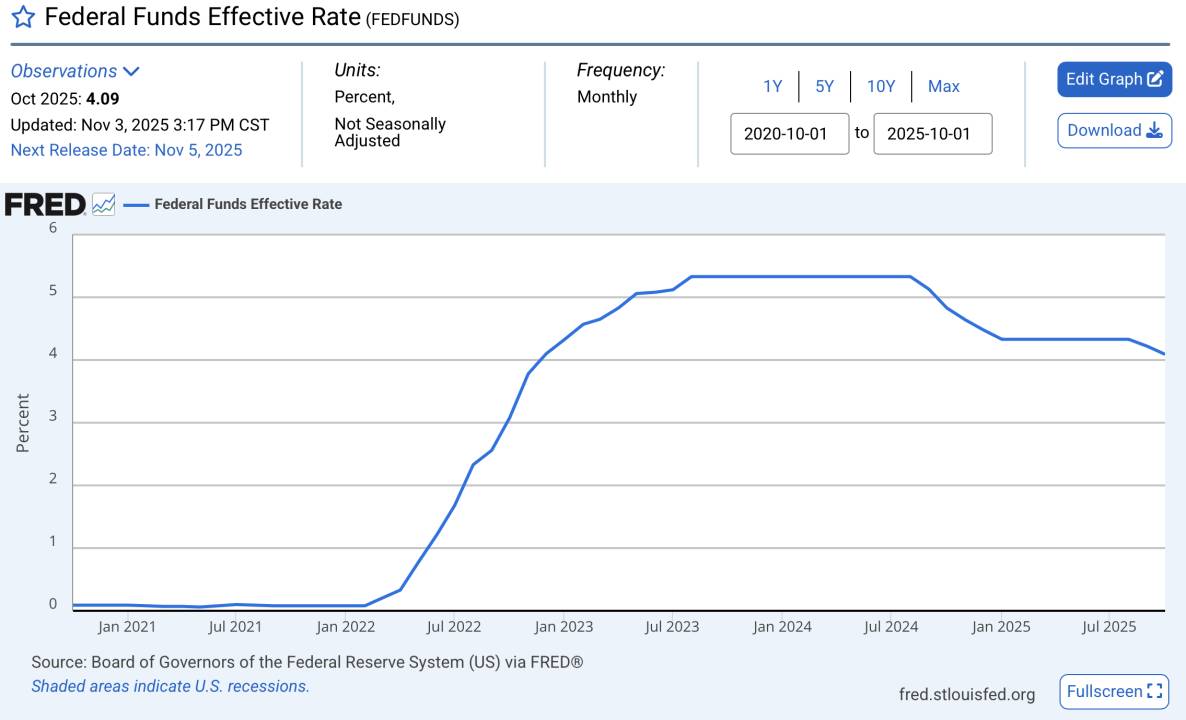
Interest rates remain at historically high levels
Data source: FRED
3. US-China friction leads to lower risk appetite, suppressing risk asset prices.
Recently, events such as China's rare earth export restrictions and the US reimposing tariffs have increased risk aversion, with the US dollar index and US stock volatility index rising in tandem, reflecting heightened global risk aversion.
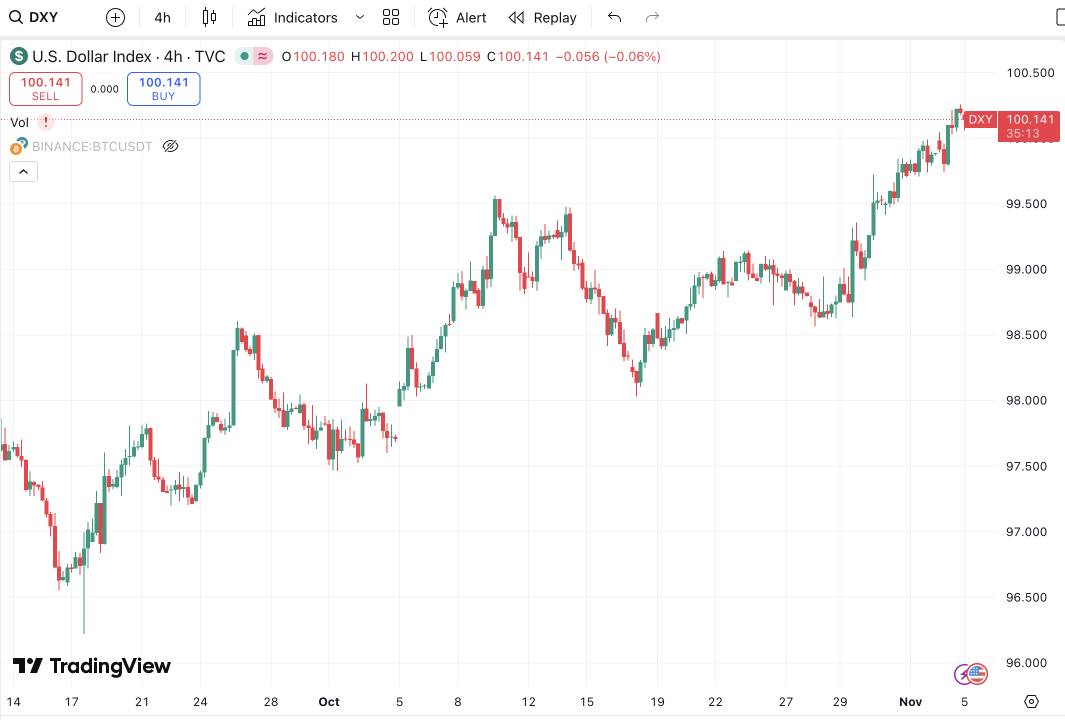
US dollar index continues to rise
Data source: TradingView
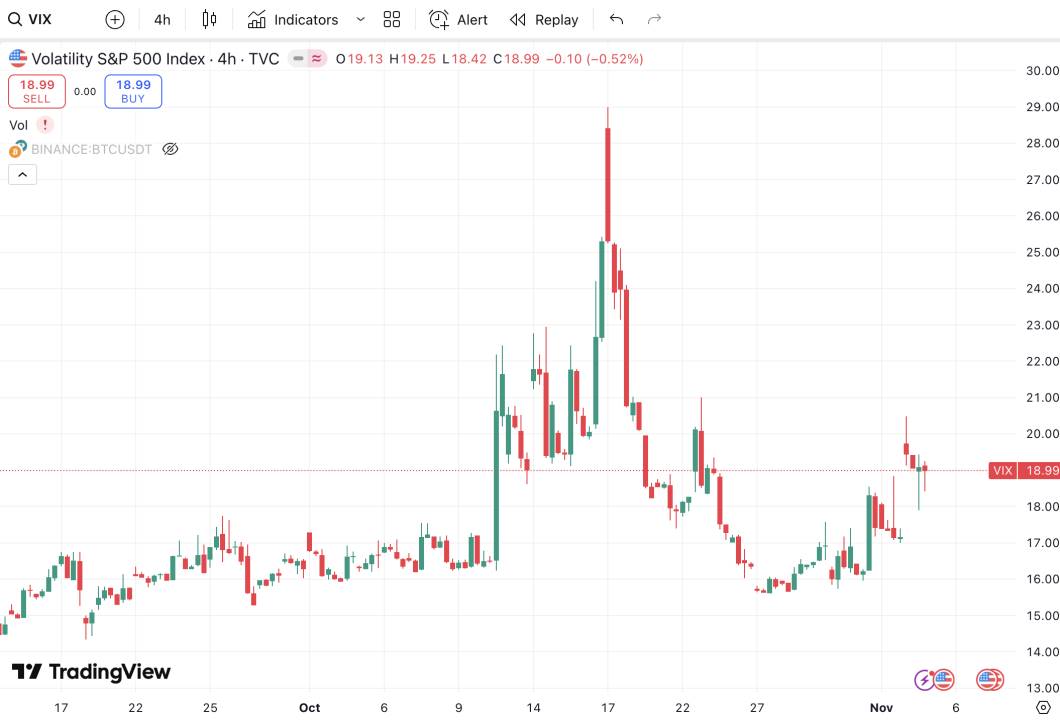
US stock volatility expands
Data source: TradingView
3. The stock markets of the US, China, and South Korea continue to rise, strongly attracting risk capital and siphoning funds from the crypto market
When talking about bull markets, the market always compares to 2021. In the 2021 bull market, while quantitative easing rapidly expanded liquidity, the stock market suffered severe EPS losses due to the pandemic (i.e., company revenues fell sharply due to the pandemic, and stock market fundamentals were so poor that secondary traders were not incentivized to buy). The abundant liquidity had nowhere to go and fueled a wild crypto bull run, with the total crypto market cap soaring from $300 billion to over $3 trillion in a year, altcoins outperforming BTC, and countless small-cap tokens multiplying a hundredfold.
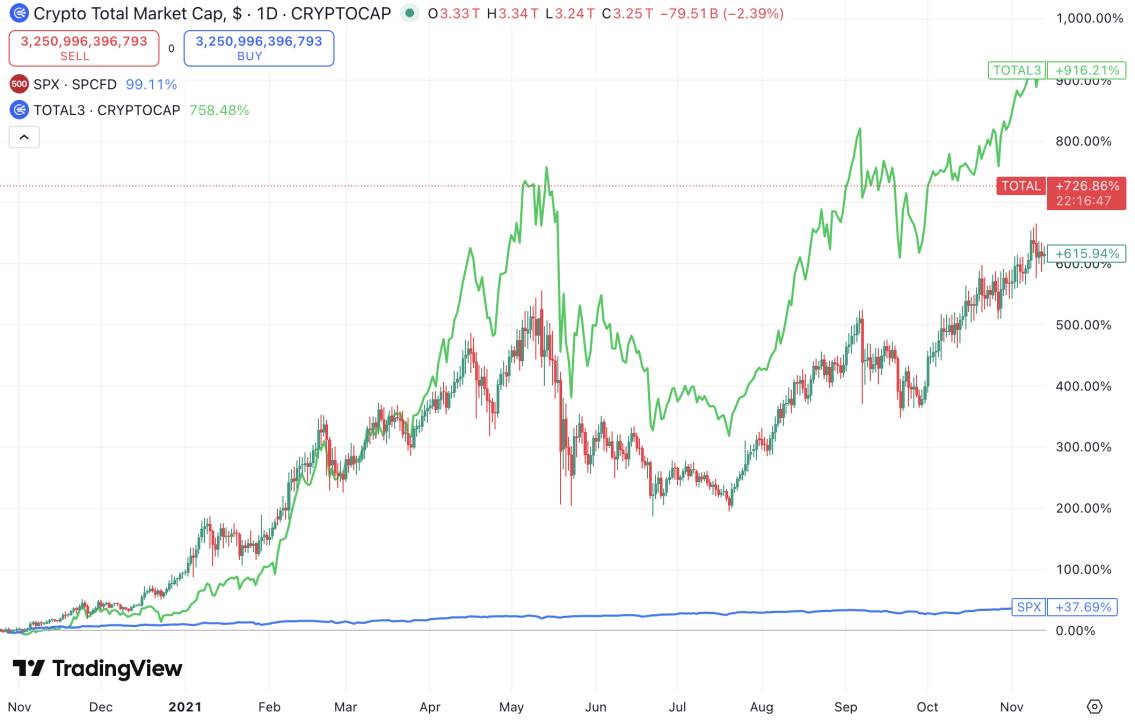
2020.11-2021.11 Total, Total3 & SPX
Data source: TradingView
But now, the stock markets most relevant to crypto—those of the US, China, and South Korea—are all rising. US stocks keep hitting new highs driven by AI, A-shares have broken through 4,000 points on policy support and liquidity recovery expectations, and South Korea is showing a strong trend due to the recovery of semiconductor exports. The KOSPI index has risen nearly 70% so far in 2025, making it the best-performing major stock index this year.
The limited high-risk capital in the market is being absorbed by assets with higher certainty, significantly diverting funds that could have entered the crypto market.
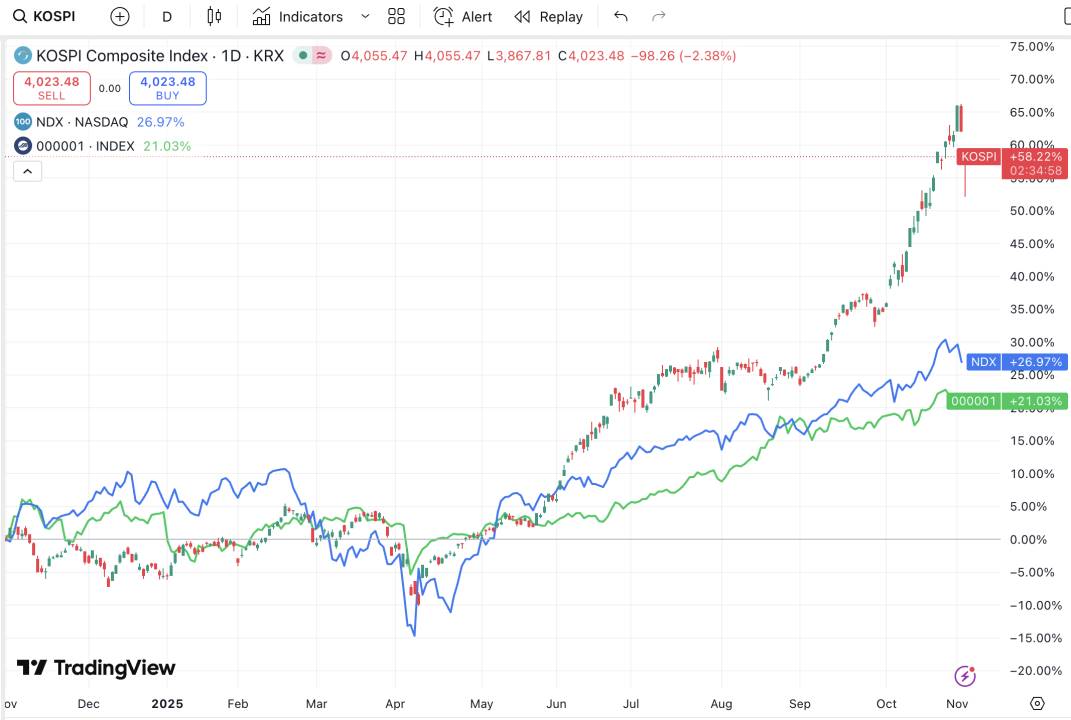
Stock market gains in South Korea, US, and China over the past year
Data source: TradingView
Therefore, in the long run, if the global stock market uptrend continues and the Fed's liquidity injection remains mild, the crypto market may continue to be "marginalized" in terms of capital, generally reflected in total market cap growth but weak token price performance due to massive asset issuance. In the short term, the key is to watch for the US government reopening and the effective date of the Fed's balance sheet reduction ending (December 1), which may bring marginal liquidity improvement.