What To Expect From Stellar (XLM) Price In November 2025

The Stellar (XLM) price enters November in a fragile state — steady for now, but technically weak beneath the surface. Historical data and current charts reveal a market torn between fading momentum and early signs of fresh money inflows. Whether XLM breaks above $0.37 or slips under $0.27 could define its entire month.
The Stellar (XLM) price has entered November on a quieter note, trading flat near $0.30 after a volatile October. Last month was rough, with prices falling about 17%, but Stellar managed to hold steadier than most peers — limiting weekly losses to just above 6%.
On paper, November has historically been a strong month for Stellar. But this time, things look less convincing. The charts and on-chain data show mixed signals — a weak, larger trend, yet faint signs of a short-term rebound trying to form underneath.
Past Novembers Show Why Stellar’s Setup Looks Fragile
Historically, November has been unpredictable for Stellar. The token’s average gain of +58% looks impressive, driven by massive rallies like +470% in 2024 and +159% in 2020.
But the median return tells the real story — (-5.67%), meaning most Novembers have actually ended lower.
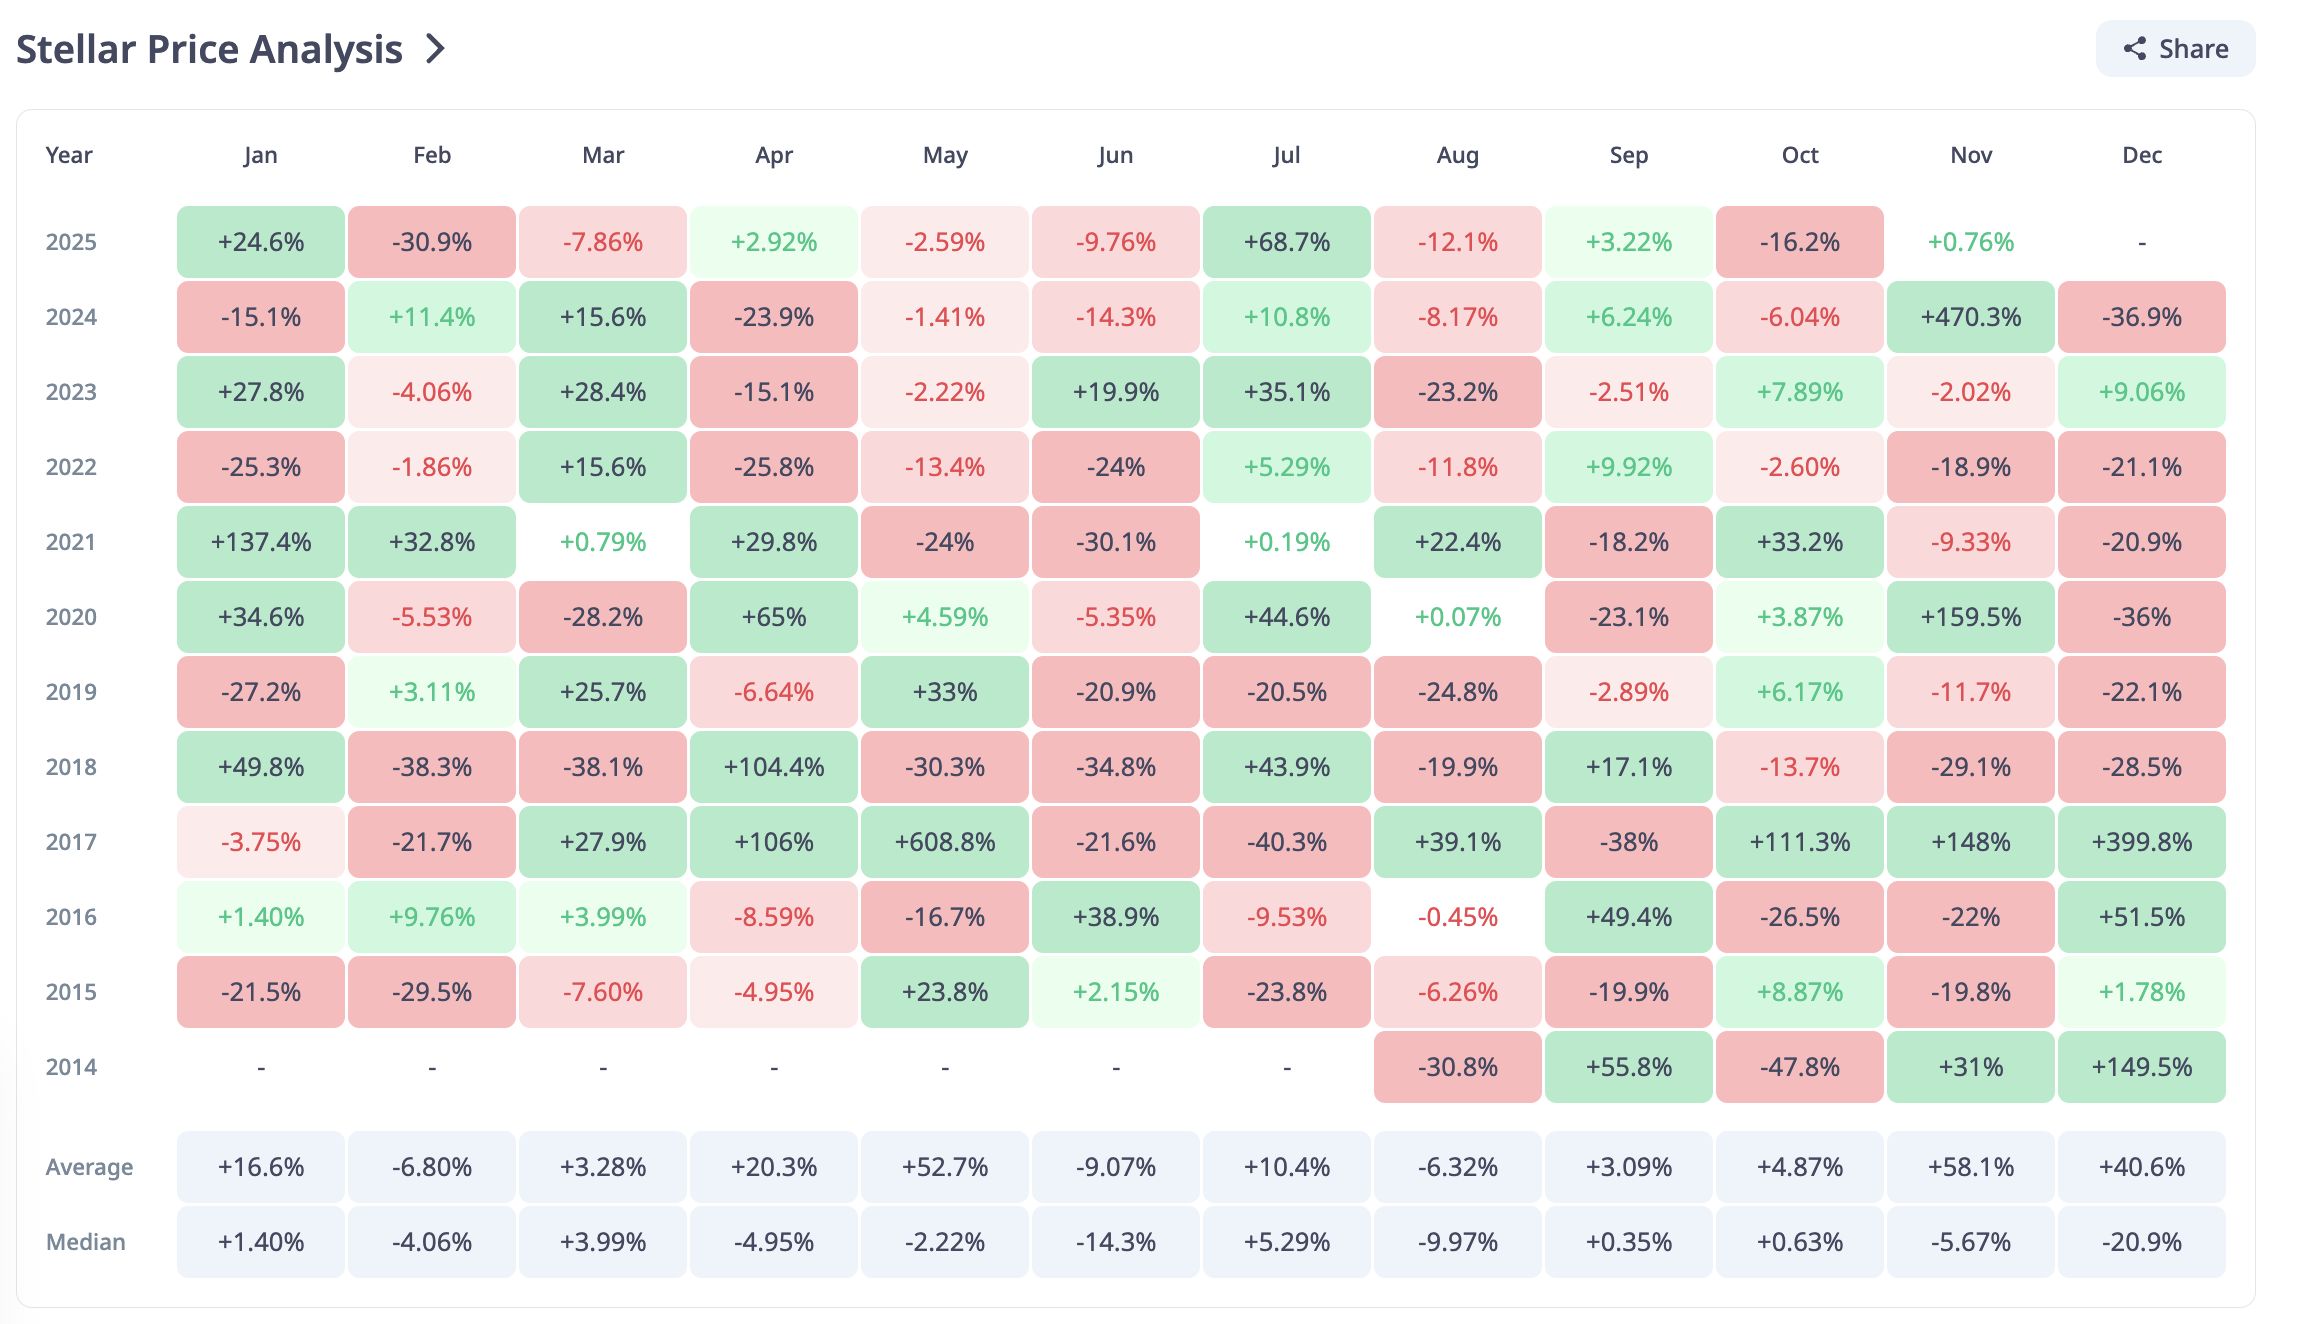 Stellar Price History:
CryptoRank
Stellar Price History:
CryptoRank
Want more token insights like this? Sign up for Editor Harsh Notariya’s Daily Crypto Newsletter here.
That inconsistent pattern is also visible on the short-term XLM price chart today. Between October 31 and November 2, the Stellar price has been forming lower highs, showing hesitation each time buyers push upward.
Meanwhile, the Relative Strength Index (RSI) — a metric that measures the balance between buying and selling strength on a scale of 0 to 100 — has made higher highs during the same period.
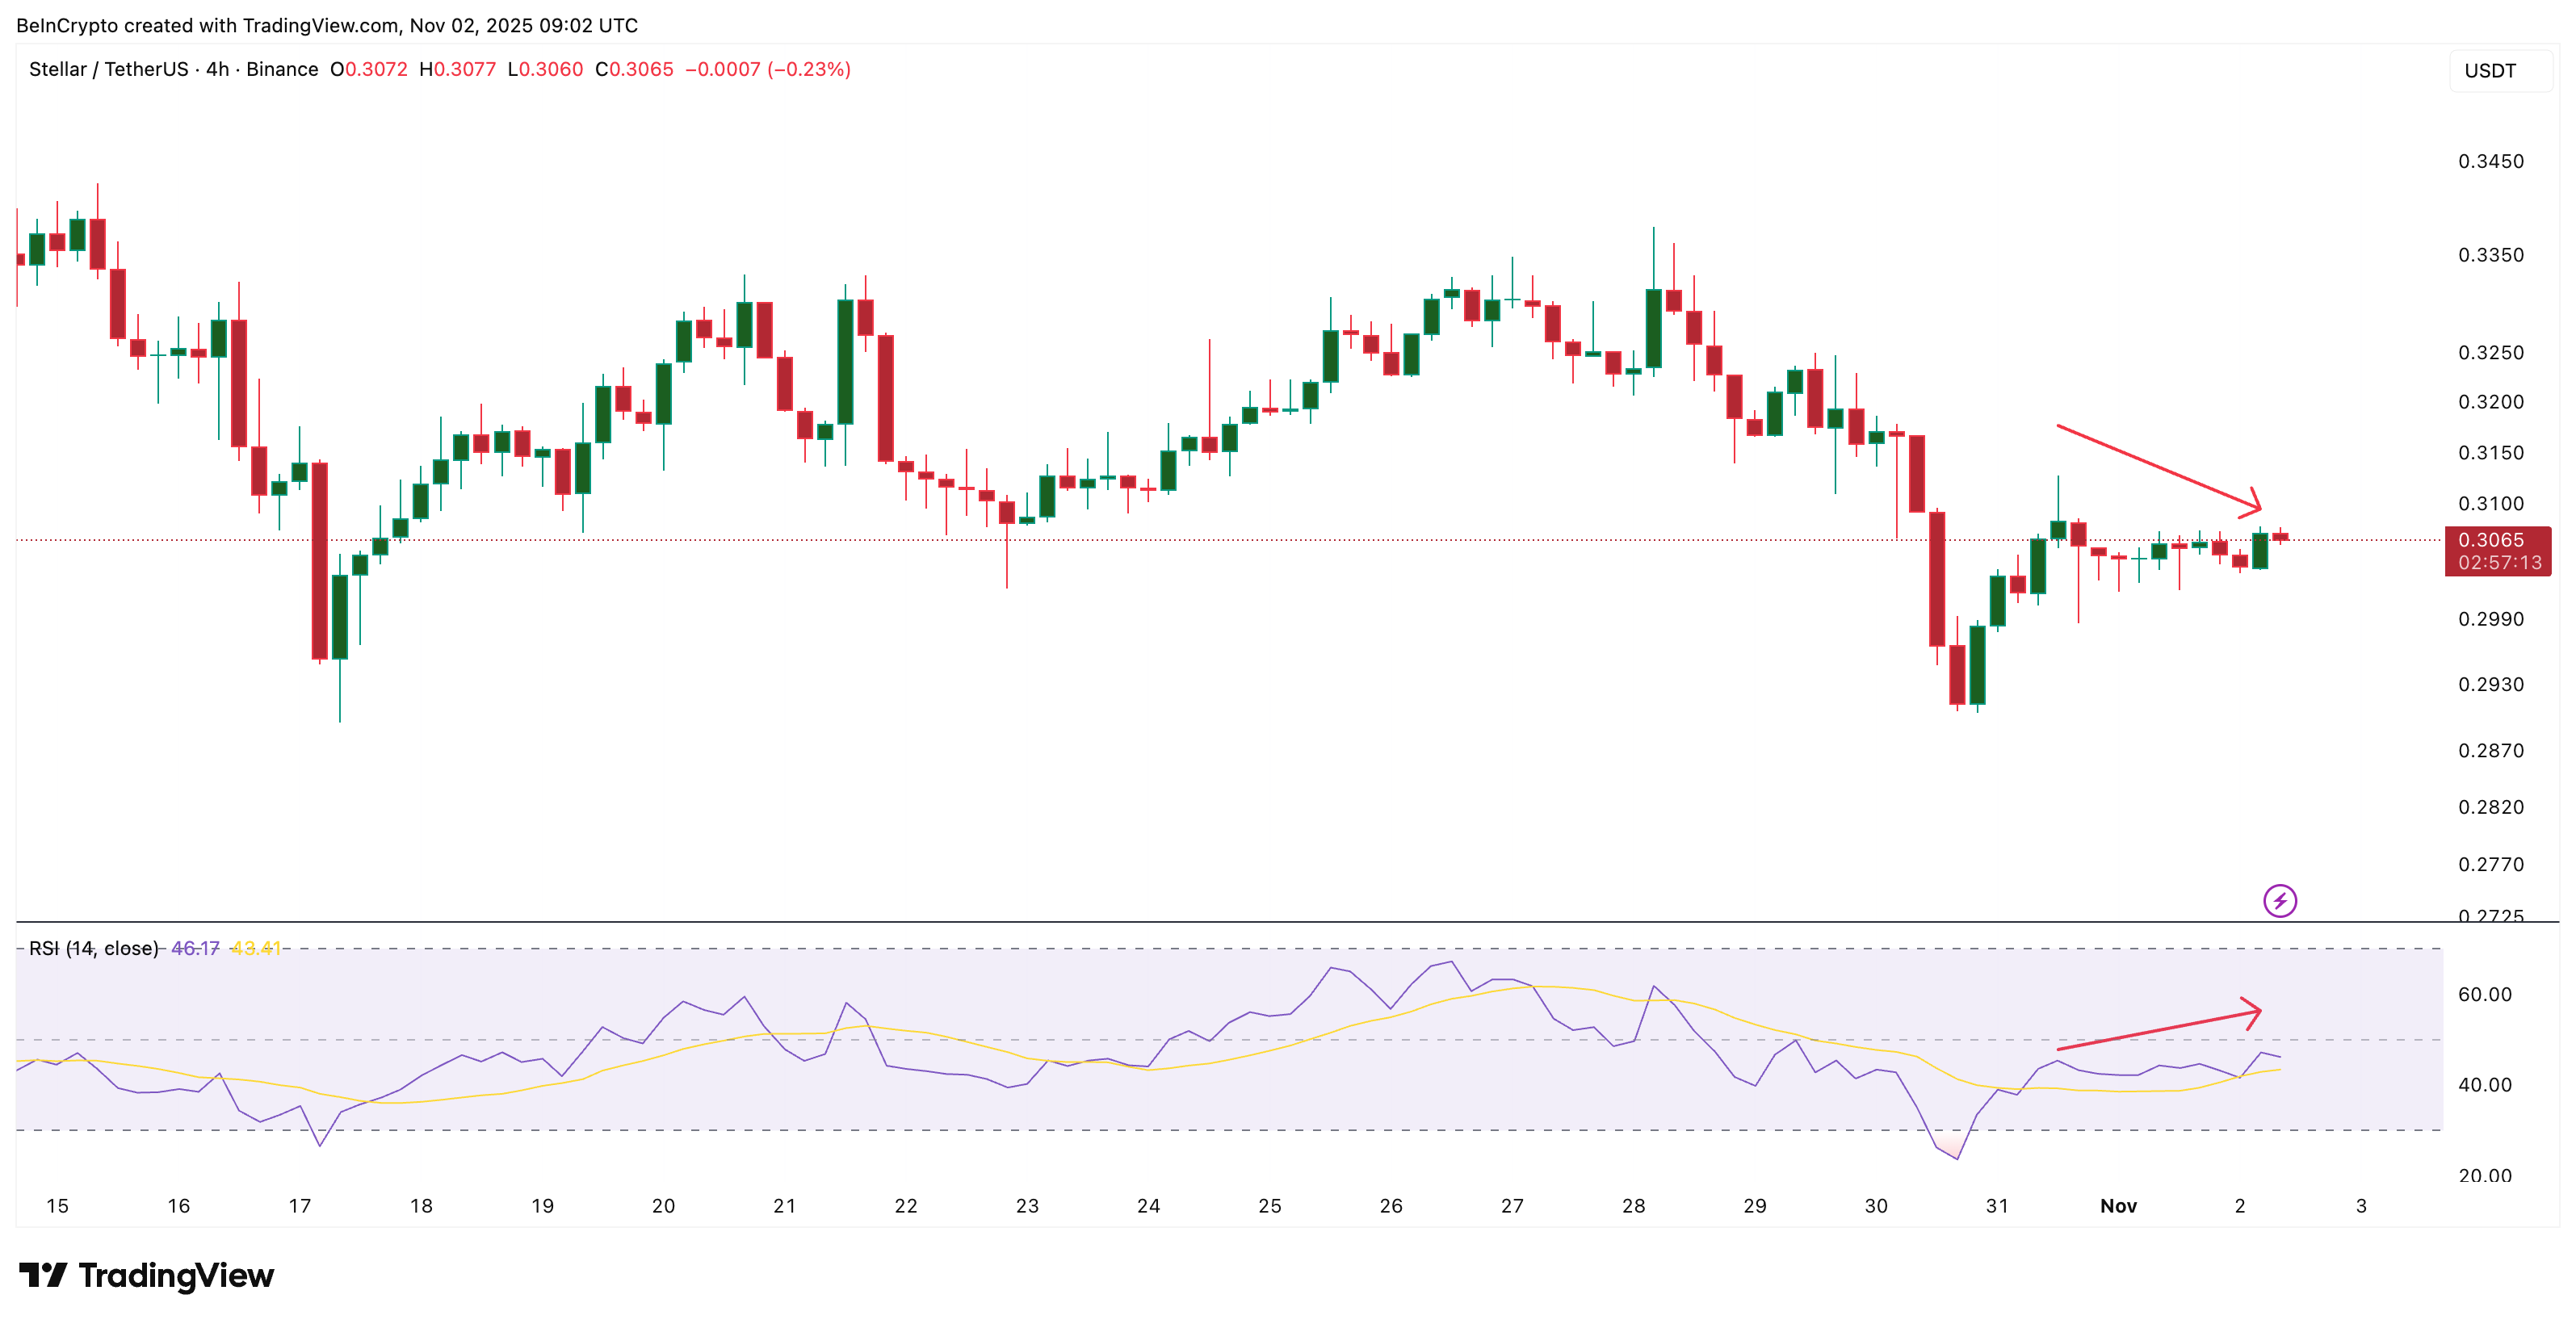 Short-Term Price Chart Shows Weakness:
TradingView
Short-Term Price Chart Shows Weakness:
TradingView
This mismatch between price and RSI is known as a hidden bearish divergence. It usually means buyers are losing energy even as Stellar prices appear stable, hinting at potential downside ahead.
Unless Stellar regains stronger momentum, this fragile setup could persist through early November.
Short-Term Money Flows Show Hope, But Big Investors Are Still Quiet
One positive sign appears in the money flow data. The Chaikin Money Flow (CMF) — an indicator that tracks whether funds are entering or leaving the market — has turned slightly positive on shorter time frames, currently around +0.04.
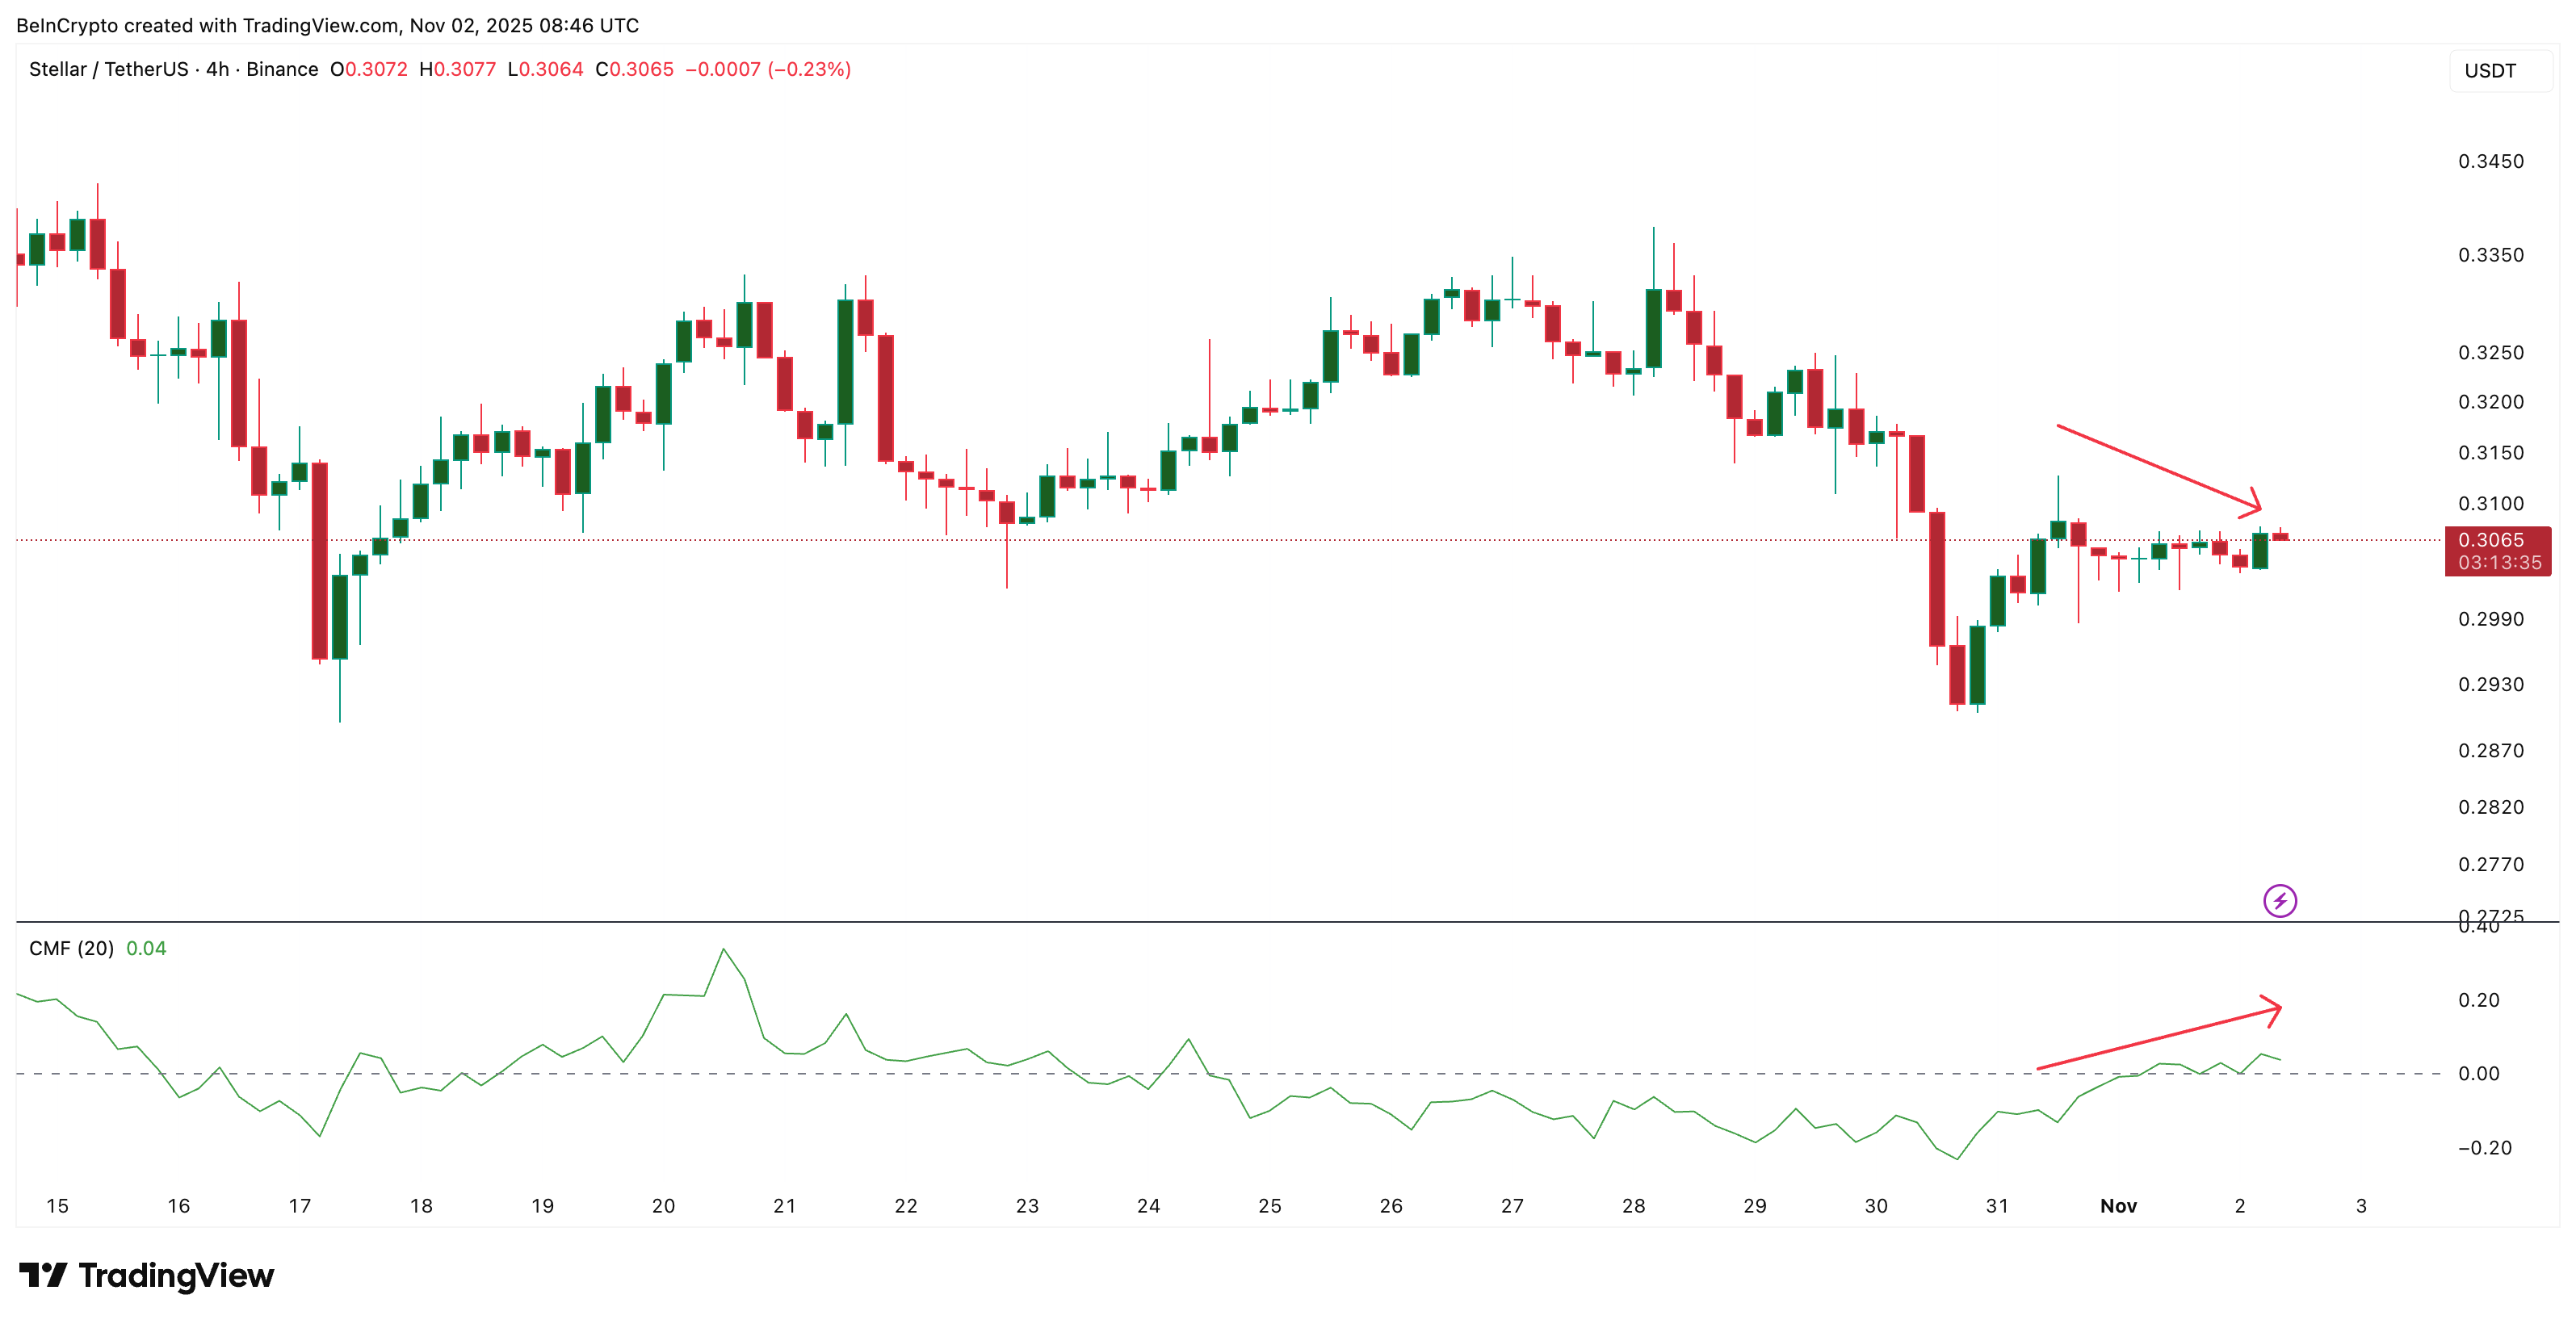 Short-Term Money Flow Trends Up:
TradingView
Short-Term Money Flow Trends Up:
TradingView
A positive CMF means more money is moving into Stellar than out of it, suggesting that short-term whales might be returning. This doesn’t confirm a trend reversal, but it often hints that selling pressure is slowly meeting some buying. More so as the short-term CMF is rising while the prices correct.
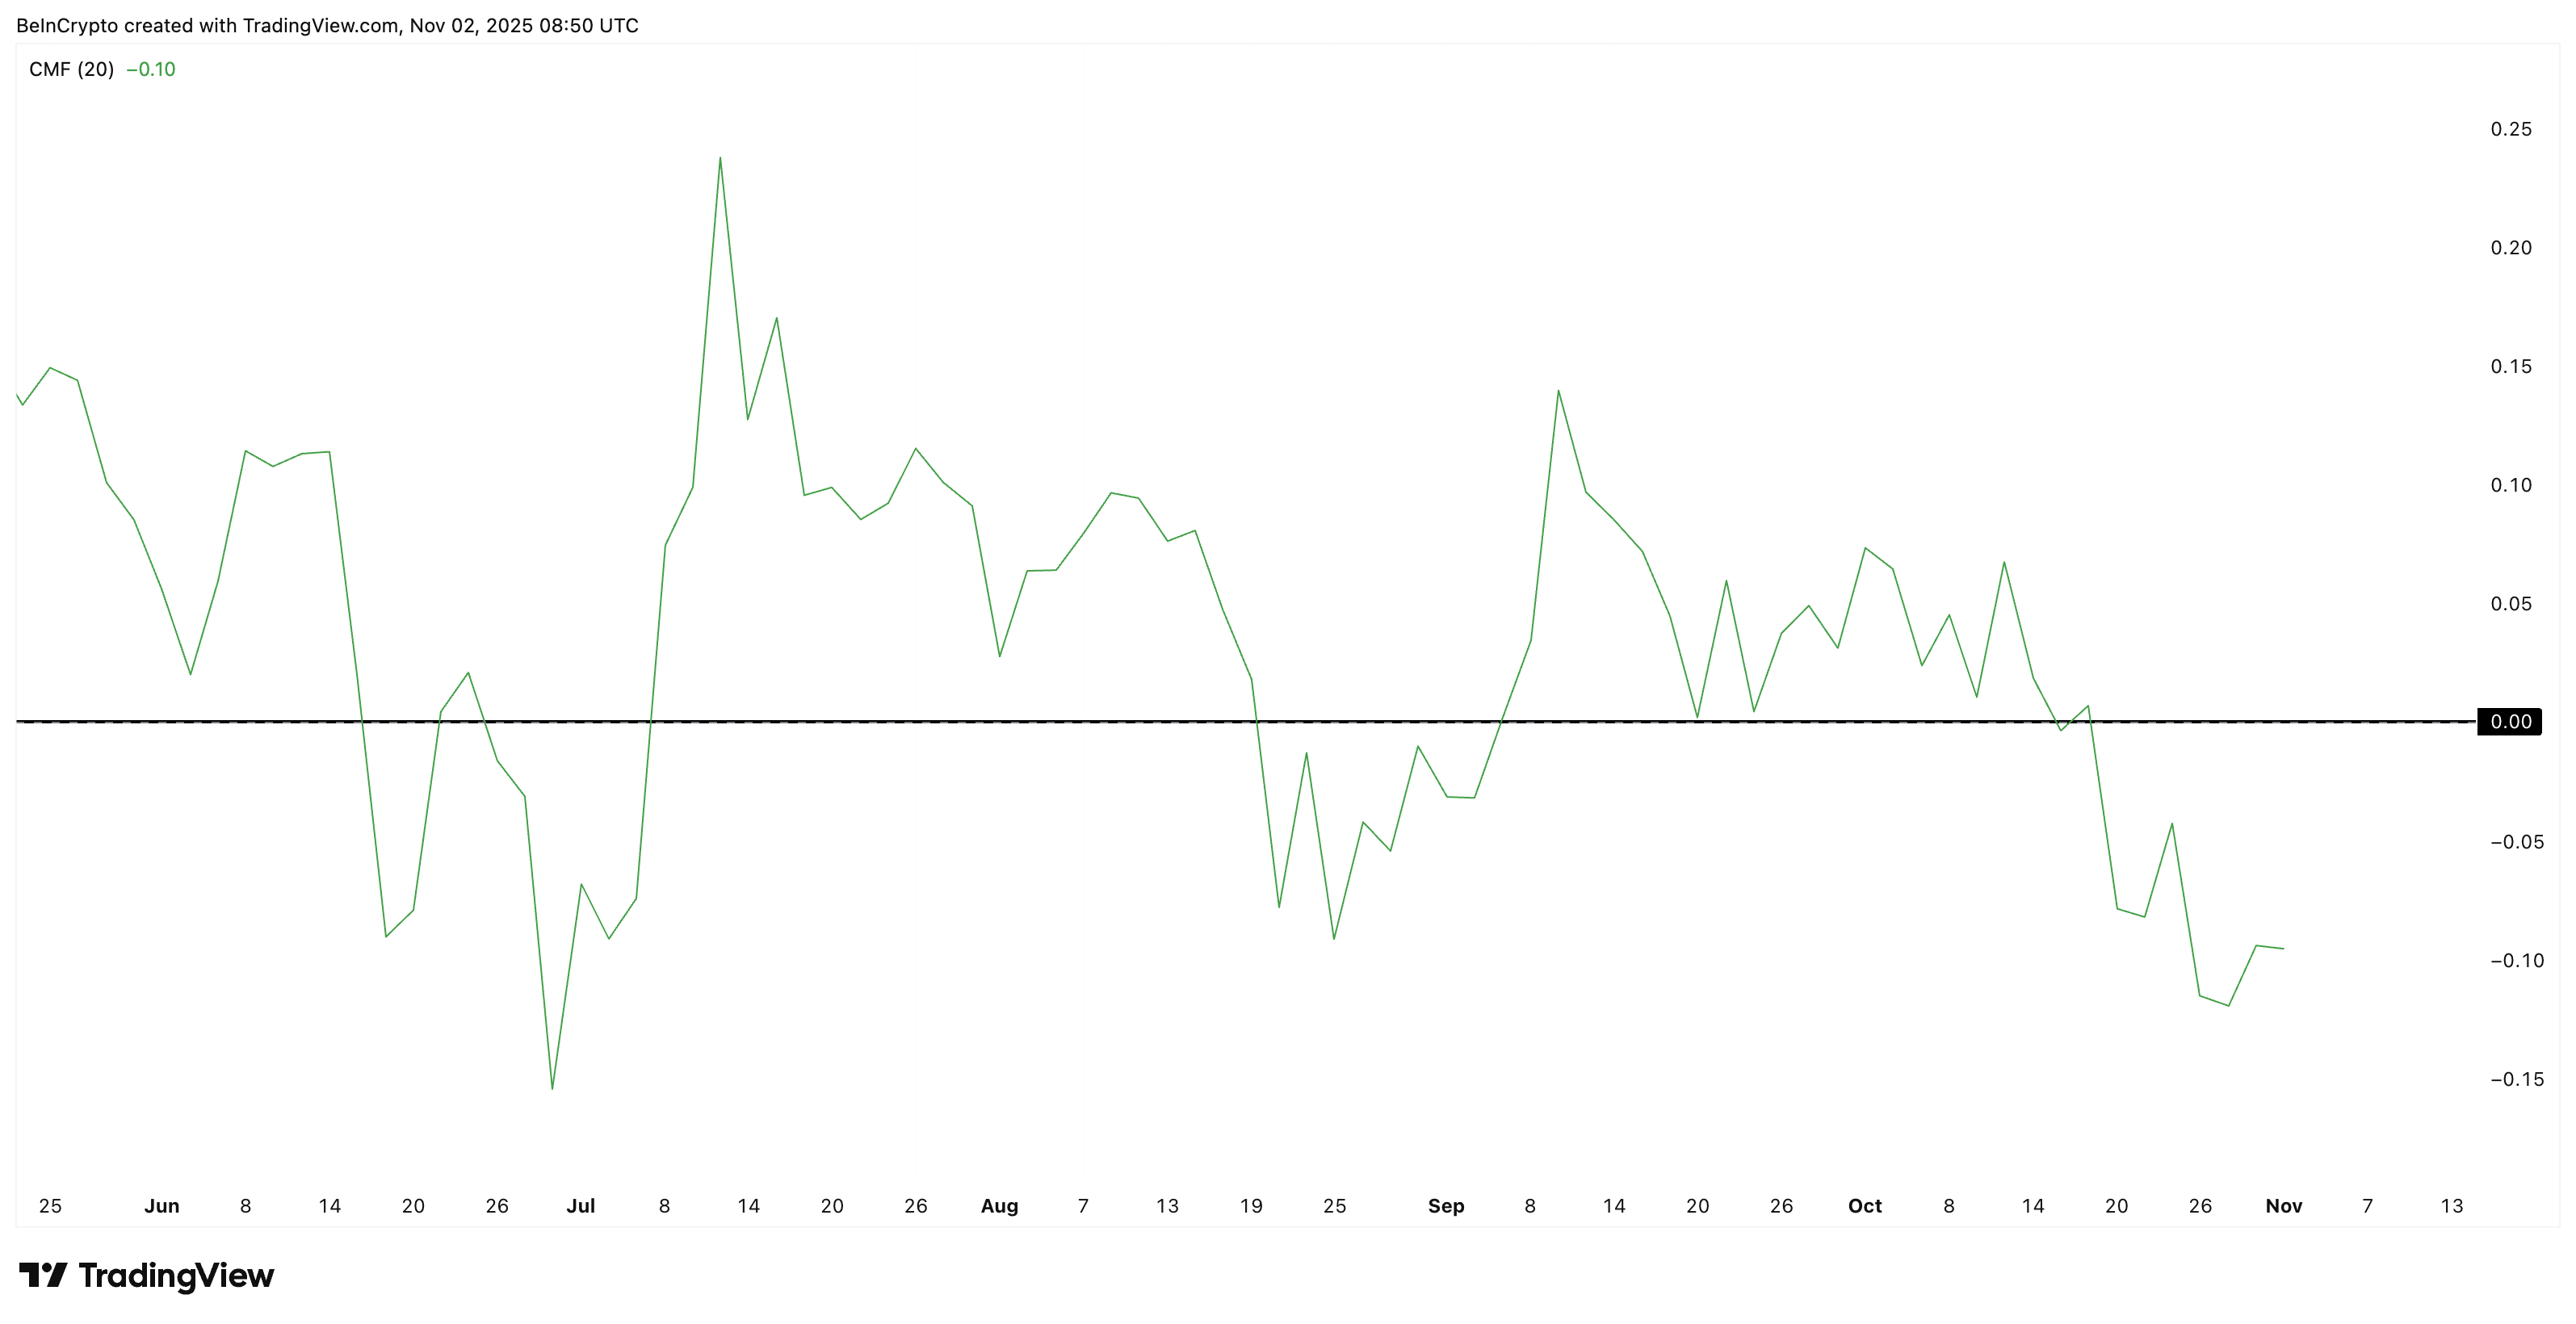
However, when zooming out to the two-day chart, the CMF still sits near -0.10, indicating that large holders and possibly institutions have not yet returned in force.
Until that flips above zero, any recovery is likely to remain brief, despite the short-term inflows.
 Larger Timeframe And XLM Money Flows:
TradingView
Larger Timeframe And XLM Money Flows:
TradingView
Another factor adding tension is the 7-day derivatives data from Bybit. The exchange shows approximately $7.9 million in short positions compared to $4.3 million in long positions — a nearly 84% gap.
This imbalance suggests a short squeeze could happen if prices climb slightly. That would force short traders to buy back and might briefly drive the Stellar price higher.
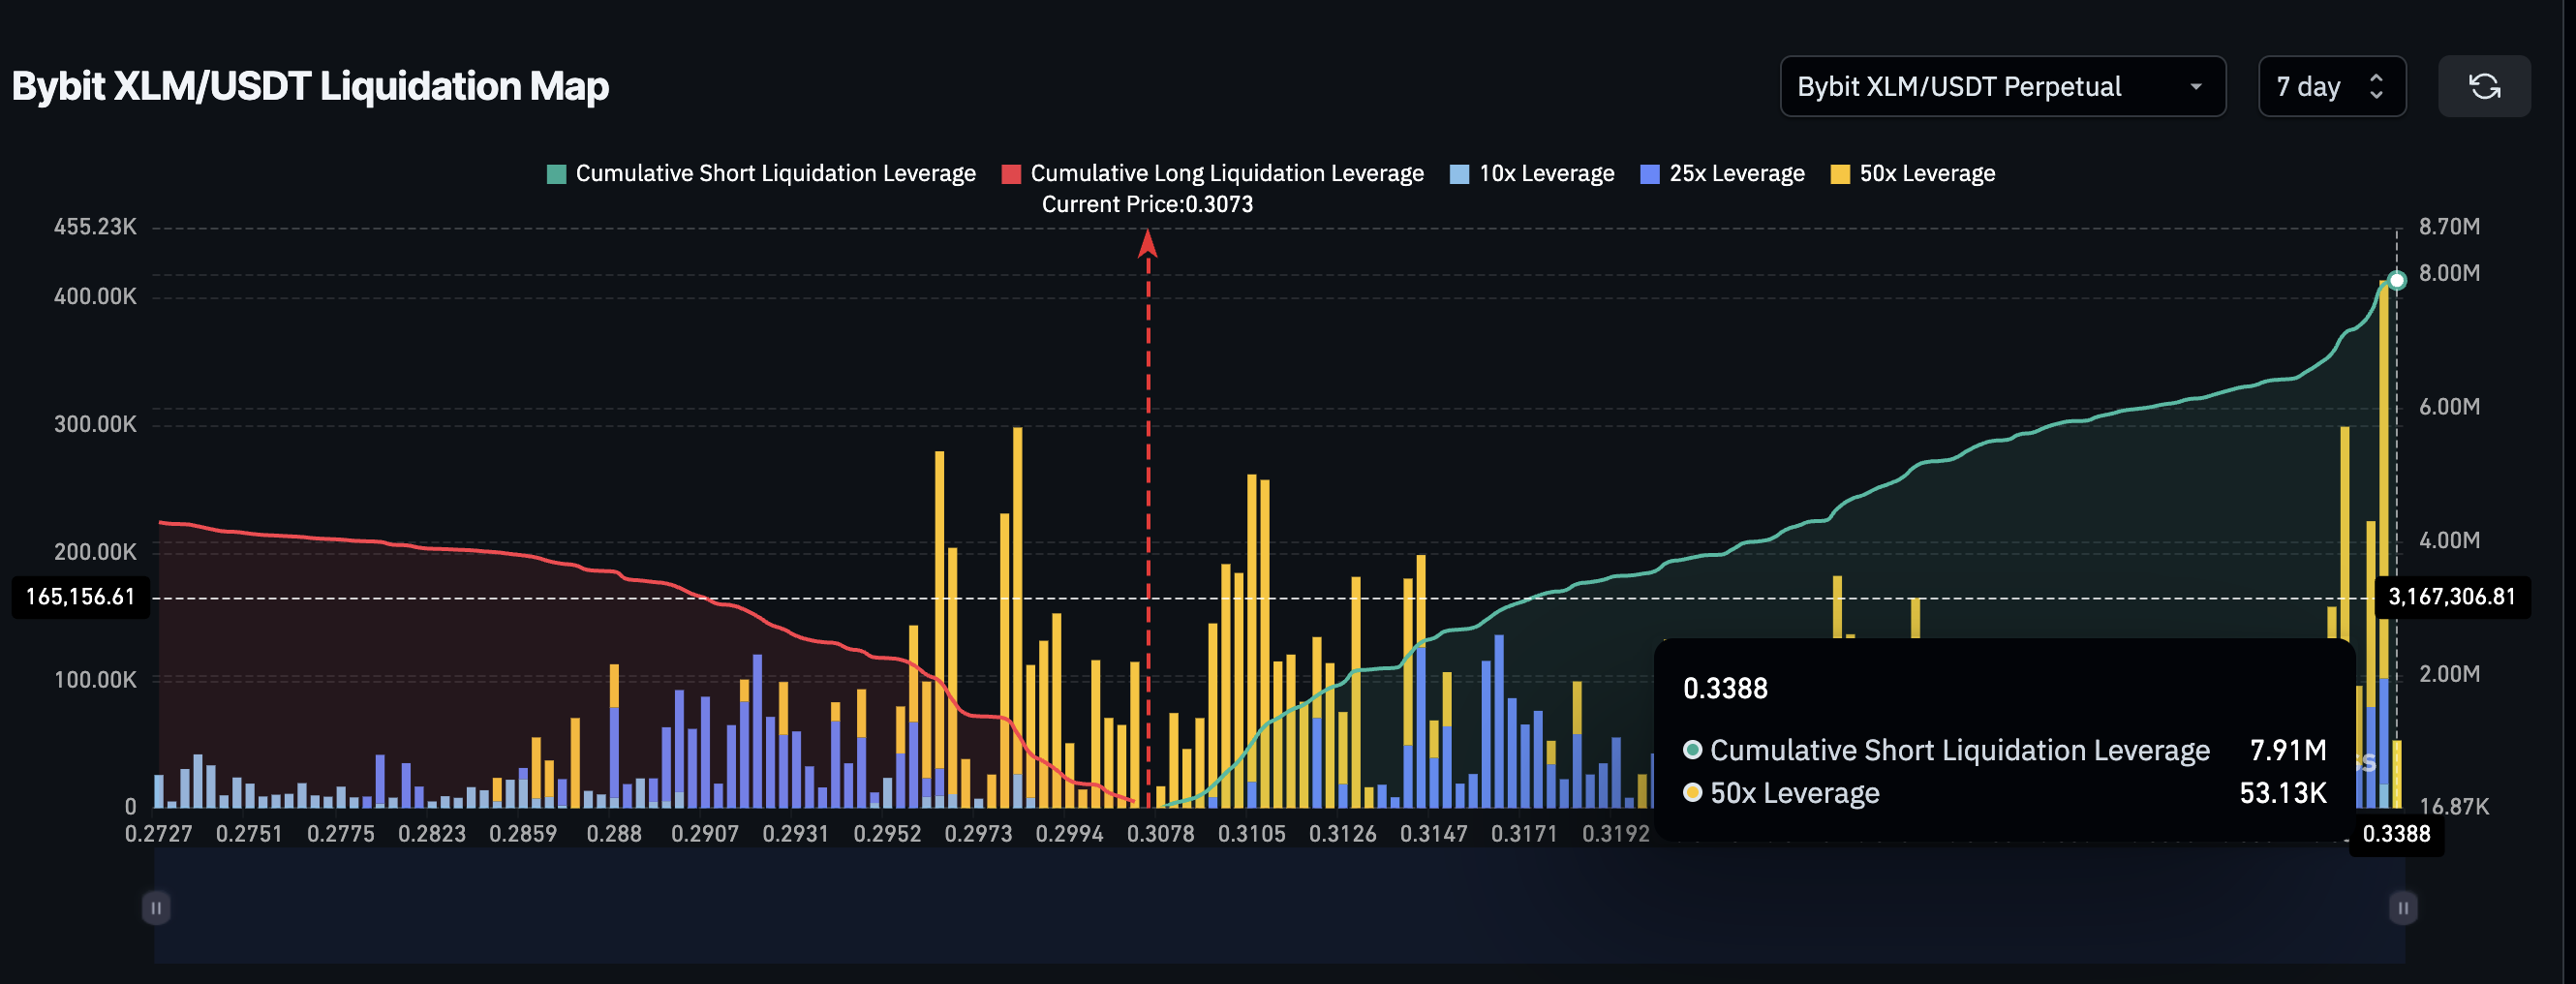 Stellar Liquidation Map:
Coinglass
Stellar Liquidation Map:
Coinglass
But for now, that bounce setup depends entirely on short-term money inflows — and doesn’t change the larger, cautious picture.
Stellar Price Chart Shows Tight Range and Key Levels
On the 2-day chart, Stellar trades inside a symmetrical triangle, a structure that forms when buyers and sellers move in balance but neither side takes control. Prices have stayed within $0.27 to $0.35 for days, showing hesitation.
If Stellar breaks and closes below $0.27, the lower trendline of this triangle could give way, opening the path toward $0.21 and possibly $0.19. That would confirm that October’s weakness still dominates.
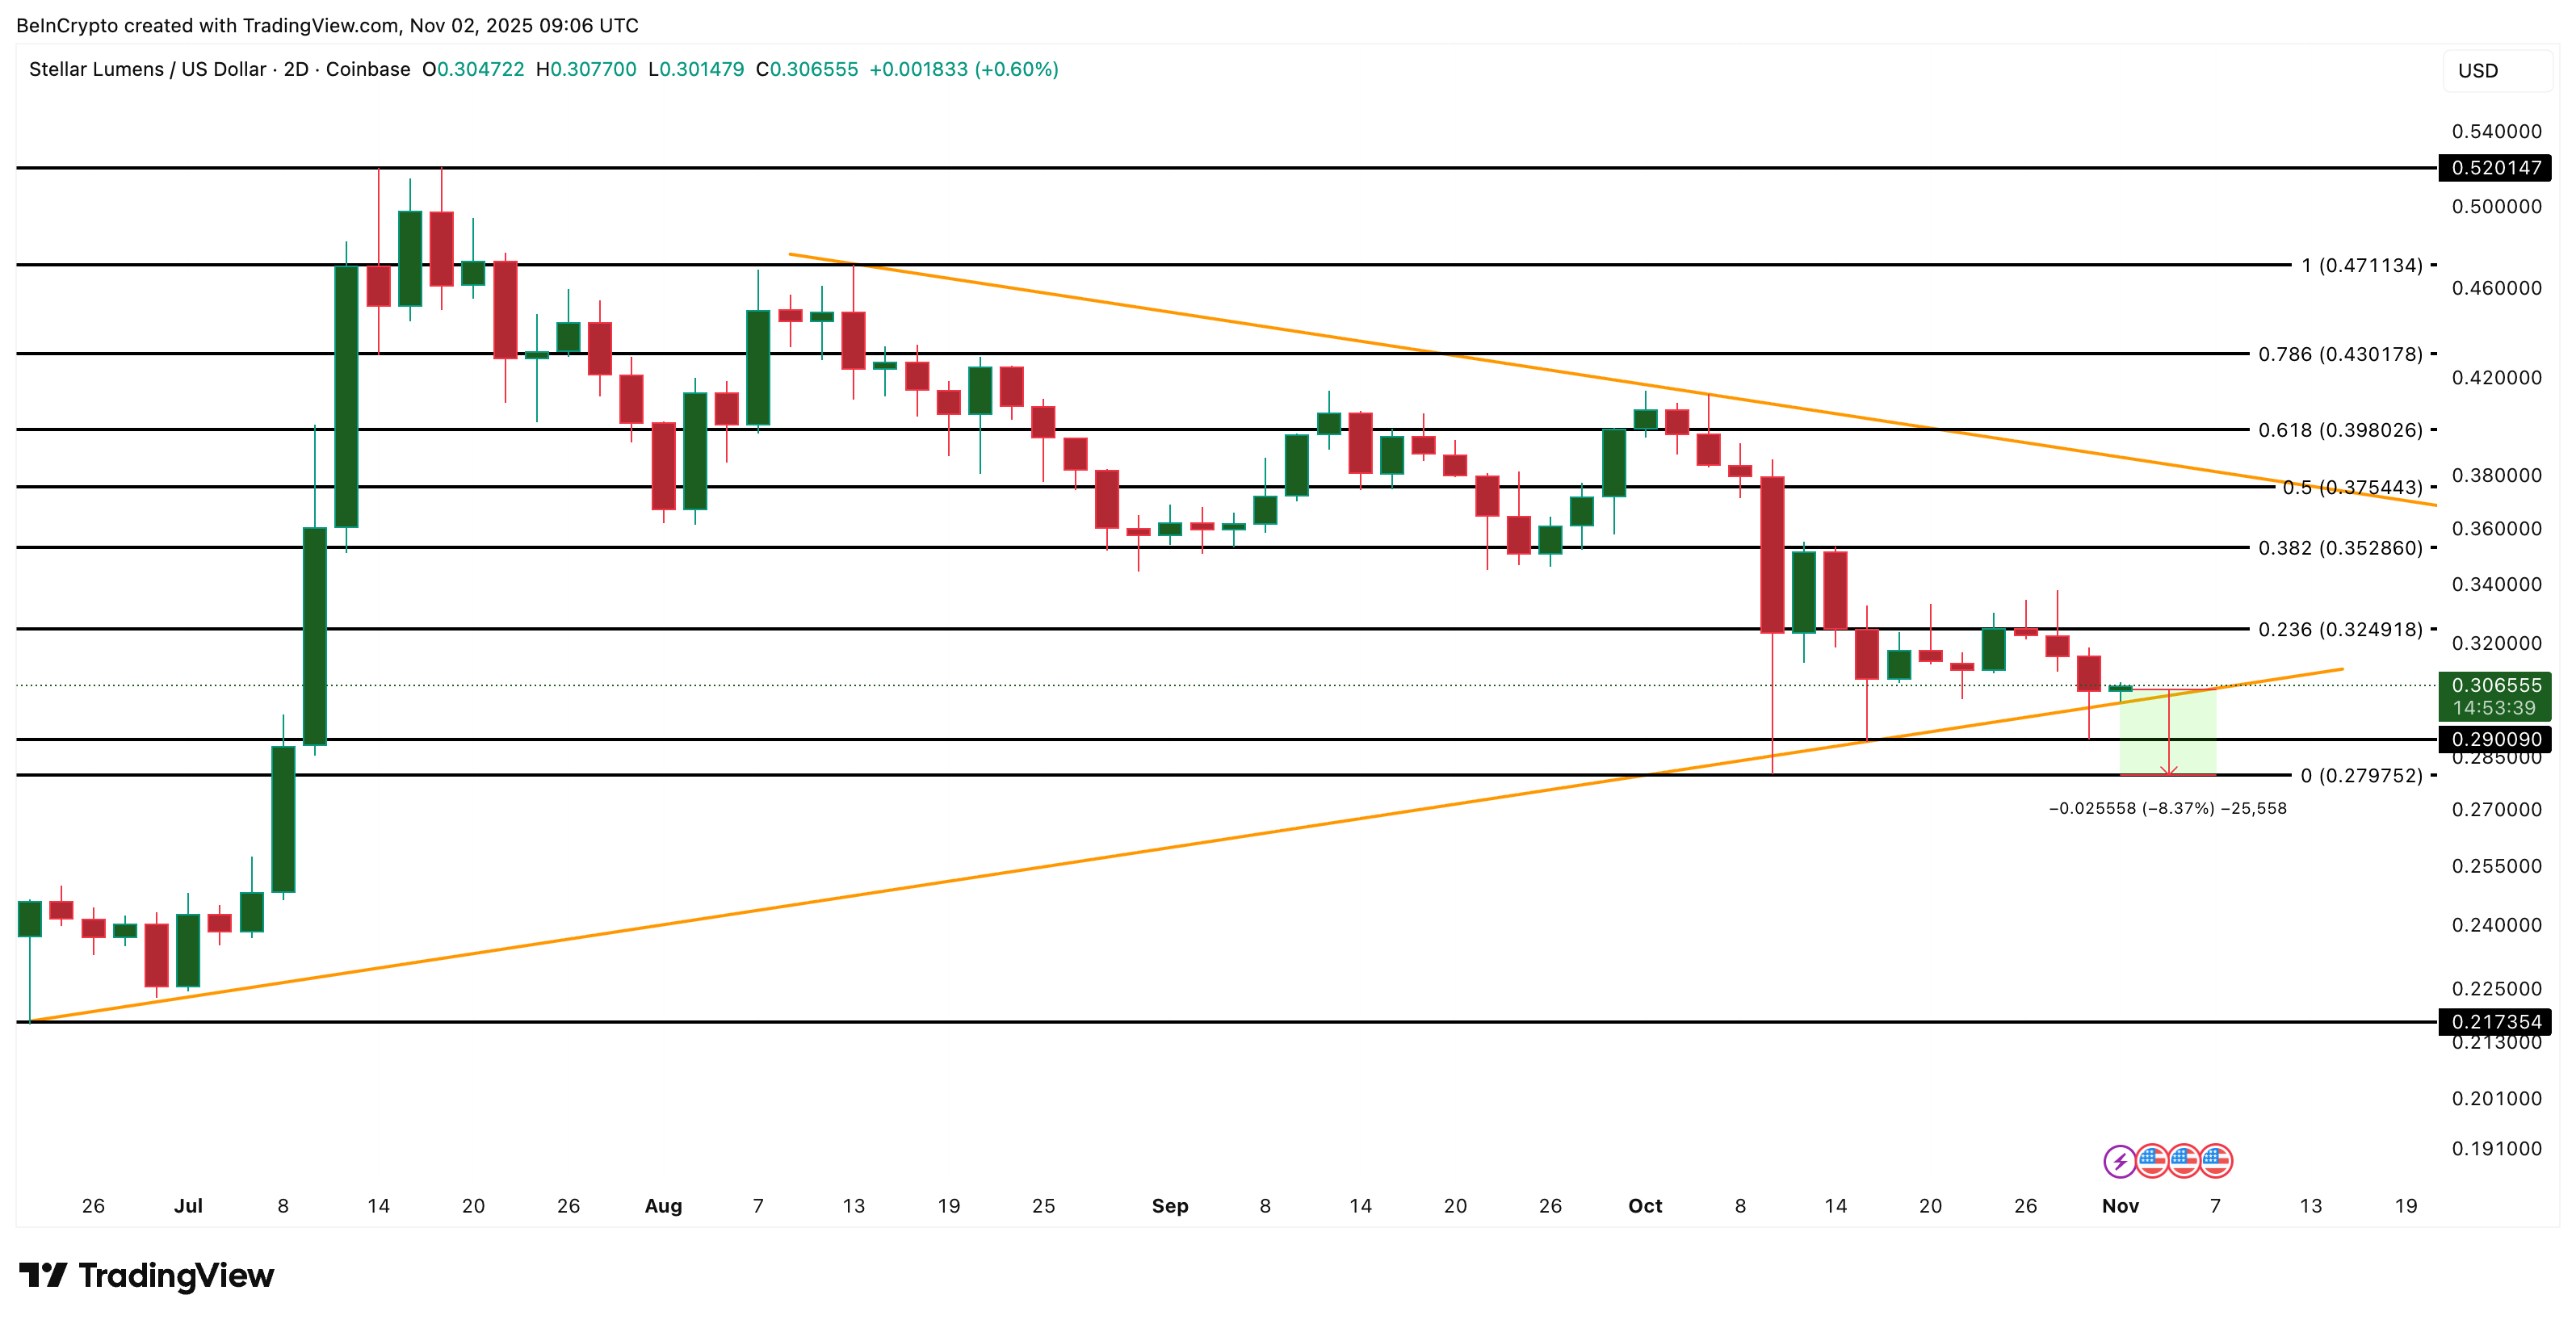 Stellar Price Analysis:
TradingView
Stellar Price Analysis:
TradingView
If the XLM price manages to stay above $0.35 and close past $0.37, it could retest the upper range and attempt to reach $0.47. Sustained strength beyond that could even push toward $0.52. Yet, the short-term RSI still signals limited momentum to support such a move.
Overall, Stellar price direction in November depends on which trendline is breached first. The weak RSI-led momentum shows that the lower one is at risk, at least for now.
Disclaimer: The content of this article solely reflects the author's opinion and does not represent the platform in any capacity. This article is not intended to serve as a reference for making investment decisions.
You may also like
CZ builds a position in ASTER, is he really going to defeat Hyperliquild this time?
After BNB, Changpeng Zhao publicly disclosed for the first time that he has built a position in ASTER worth over $1.9 million.

Why do more and more people feel that the crypto market is becoming boring?
The reason why cryptocurrency is boring is that too many unresolved questions have already been answered.


x402 Besides trading Meme coins, what other projects are worth paying attention to?
A comprehensive overview of the x402 ecosystem, including protocols, infrastructure, and applications.