- The Federal Reserve ended its quantitative tightening, sparking debate on Bitcoin’s next major move.
- Bitcoin rebounded after a sharp dip, forming bullish signals like an inverse head-and-shoulders pattern.
The Federal Reserve’s decision to end its quantitative tightening program has placed Bitcoin at a decisive point, with traders watching whether the move will revive its bullish momentum or trigger a repeat of the 2019 post-policy decline.
Federal Reserve Chair Jerome Powell confirmed on Tuesday that the central bank would halt balance sheet reductions, signaling the end of its tightening phase. However, his accompanying remarks dampened market optimism after he dismissed expectations for another rate cut in December, despite a 25-basis-point reduction at the October meeting.
The hawkish tone strengthened the U.S. dollar and added pressure to risk assets, including cryptocurrencies. The process is bullish for risk assets, such as Bitcoin, Peter Chung, head of research at Presto Research, noted. The Fed’s pivot, however, could be a double-edged sword.
Trade Optimism Fails to Lift Bitcoin
Following a meeting between U.S. President Donald Trump and Chinese President Xi Jinping, markets received assurances of renewed agricultural imports and progress on rare-earth issues. Yet, the relief failed to translate into risk appetite. Traders remained cautious, viewing the development as insufficient to offset broader economic concerns.
Bitcoin’s price briefly plunged to $106,200 before rebounding 4% to above $110,000, forming what analysts described as a “shakeout and rebound” pattern. The move, they said, might have reset short-term sentiment rather than signaling another sustained downturn.
Technical Indicators Point to Potential Reversal
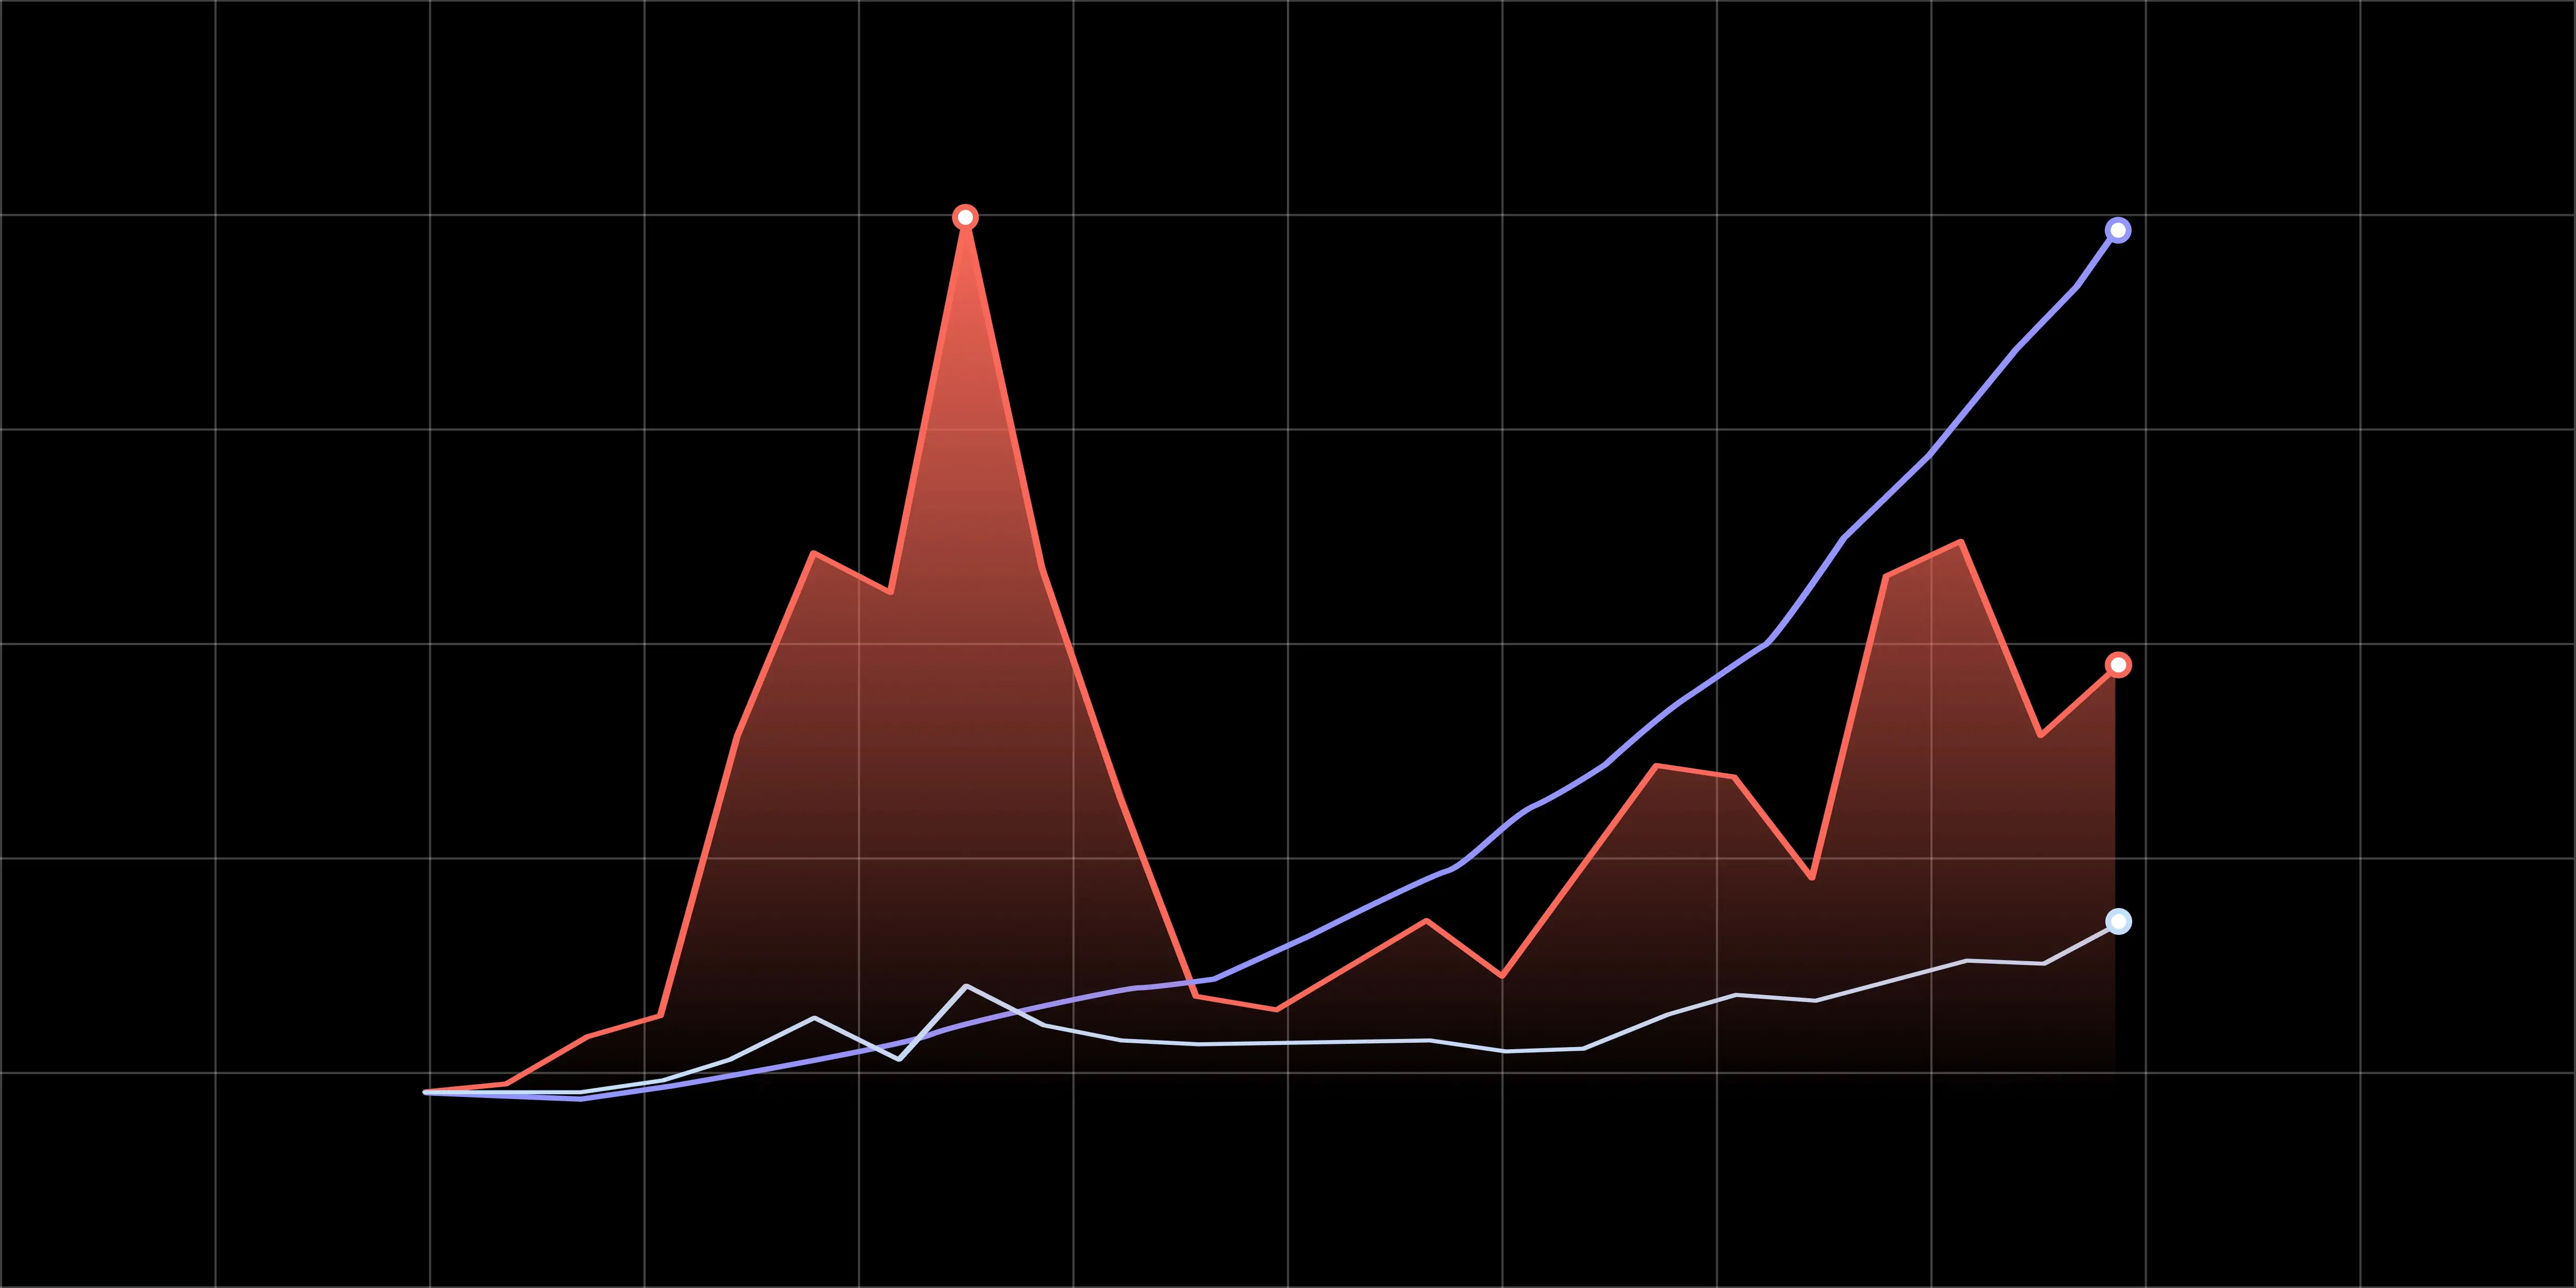
Several market metrics indicate that the recent pullback could have exhausted selling pressure. Bitcoin’s Relative Strength Index (RSI) formed a bullish divergence as prices fell, often interpreted as a sign that sellers are losing control. An emerging inverse head-and-shoulders formation —a classic reversal setup —that could trigger an upside breakout if Bitcoin breaches $116,400.
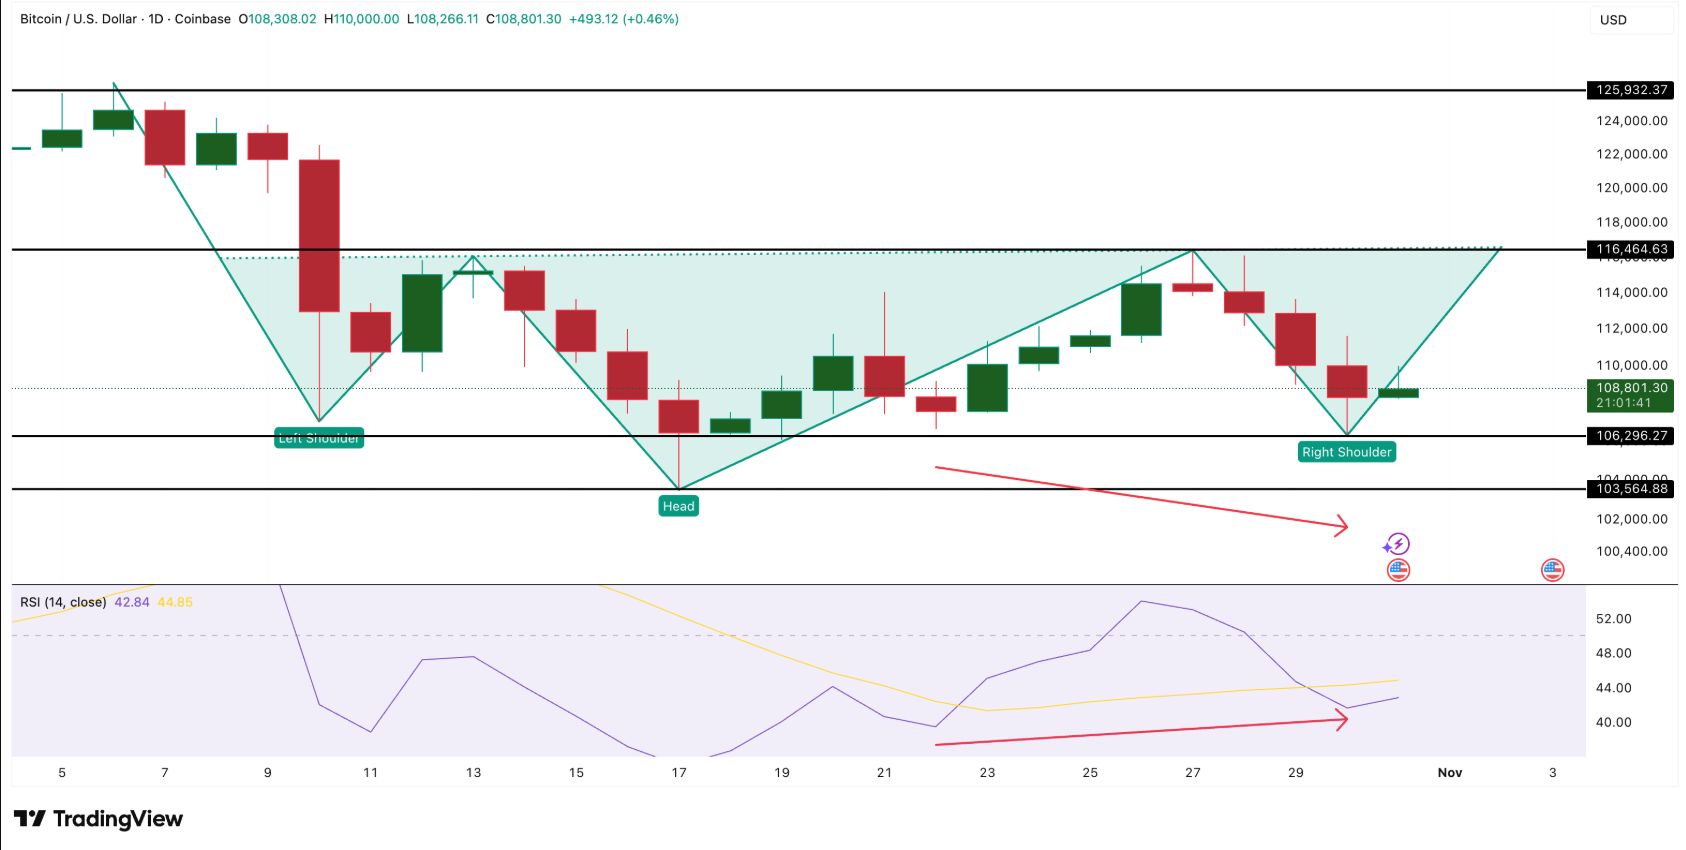 Source: Trading View
Data from Glassnode’s Net Unrealized Profit/Loss (NUPL) metric also supports a stabilization narrative. The metric dropped to 0.483, among its lowest levels in six months. Historically, such readings coincide with accumulation phases, where weaker hands exit, and stronger investors remain.
The last similar reading, on October 17, preceded a 7.6% rally, suggesting that renewed accumulation could be underway.
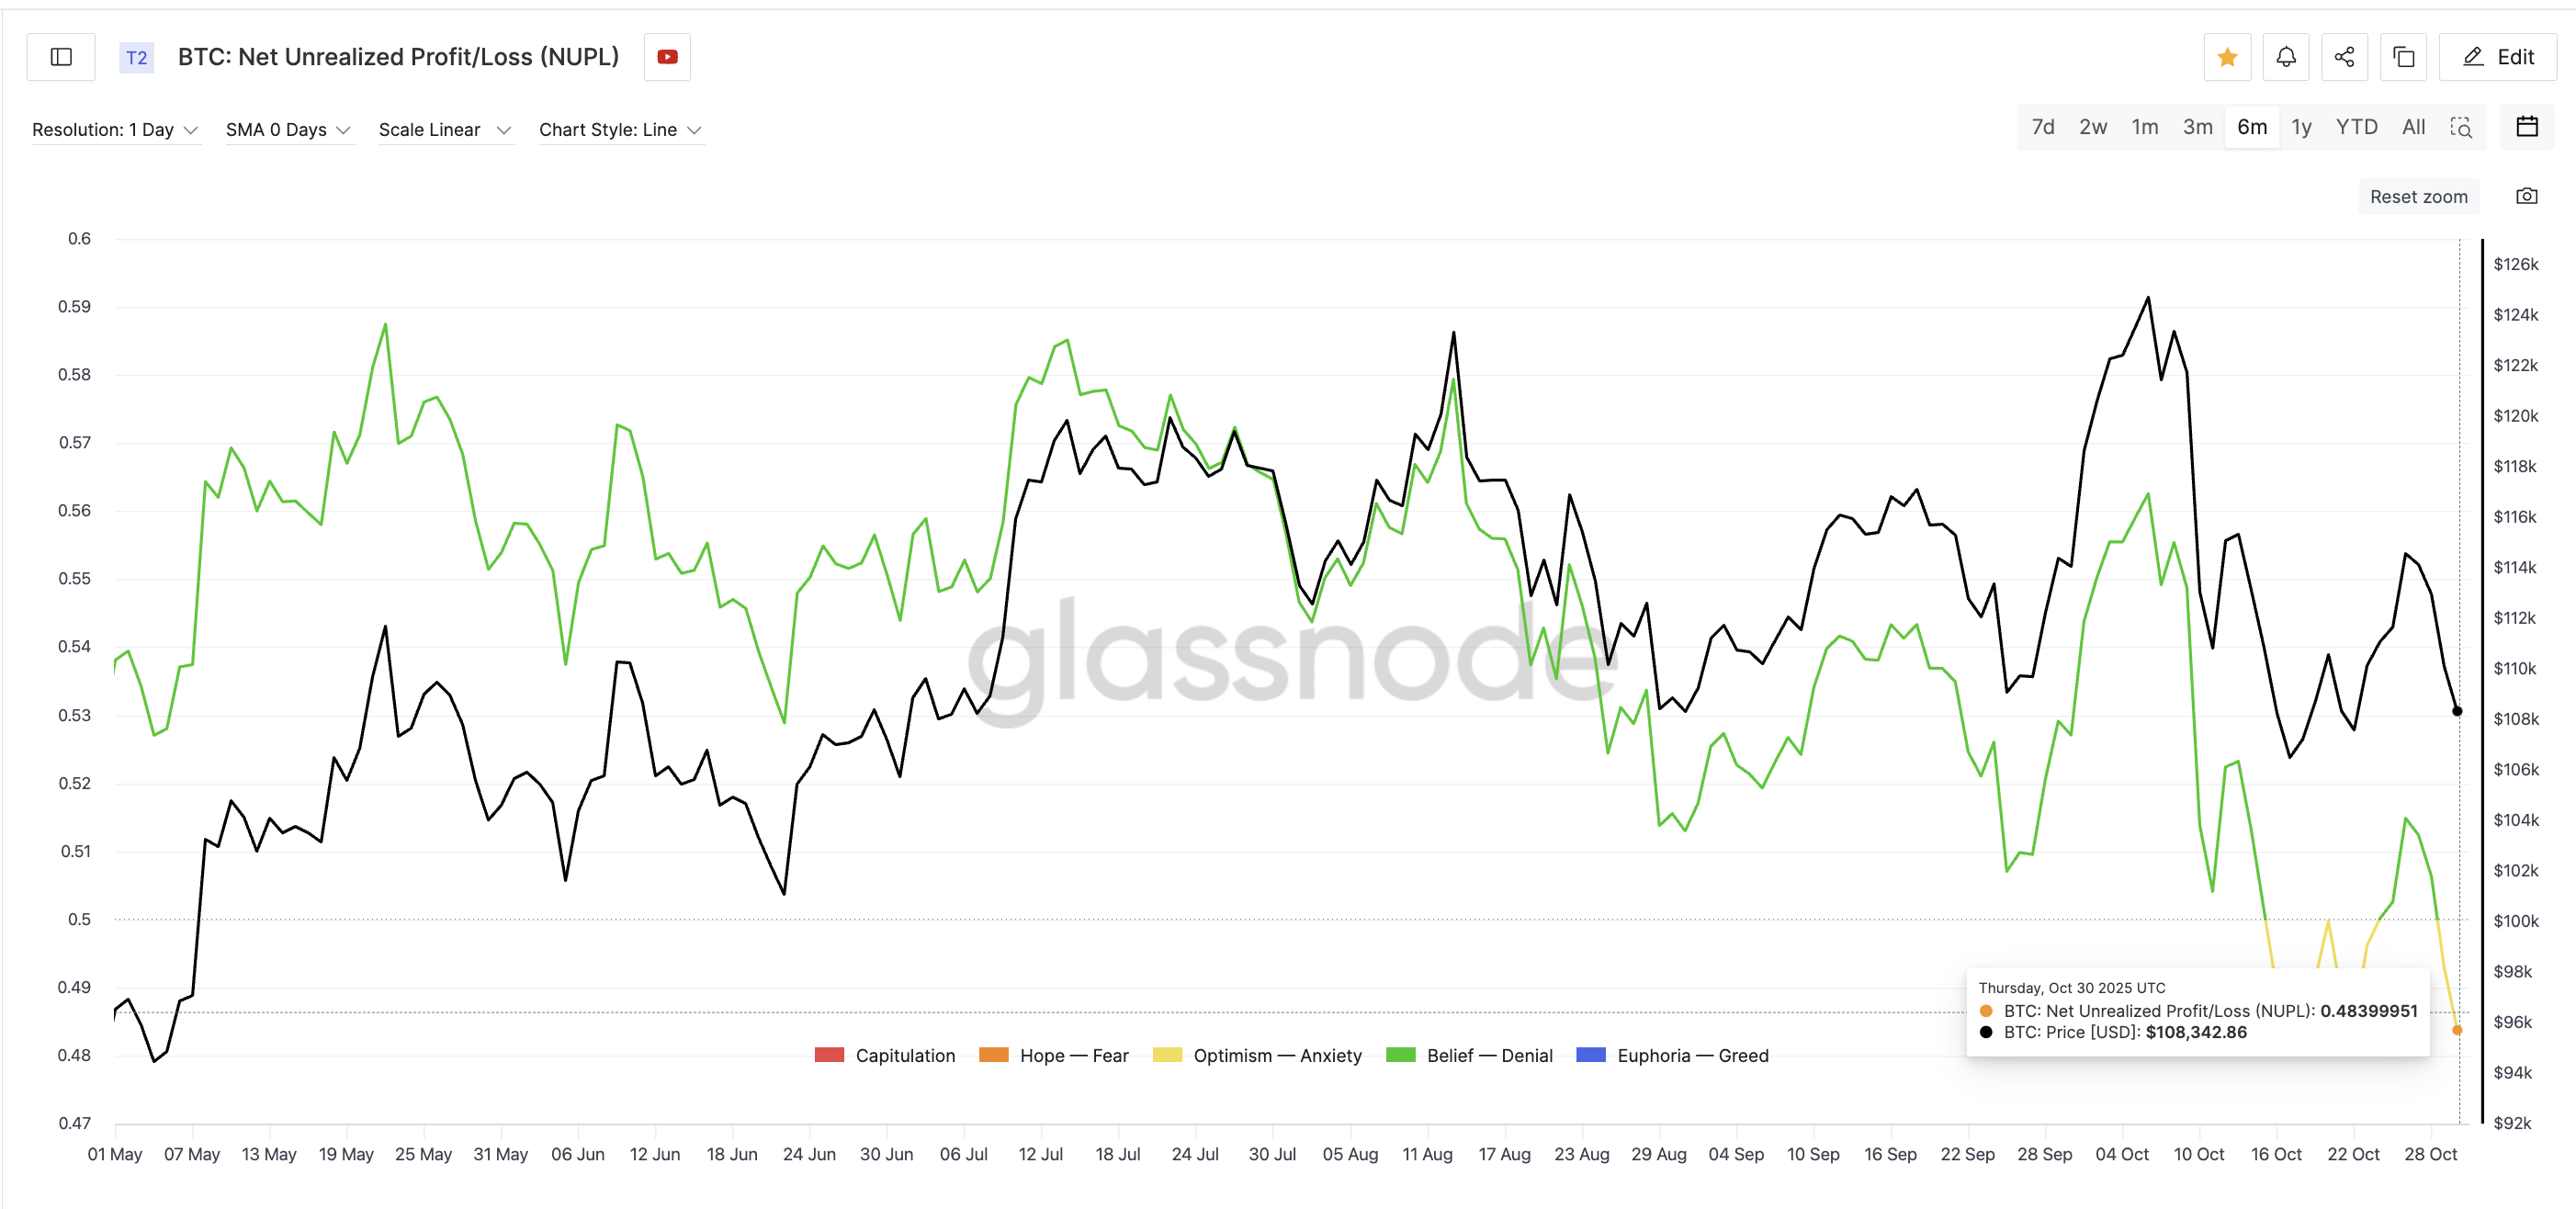 Source: Glassnode
Key Resistance Lies Near $111,000
The next pivotal test for Bitcoin lies between $111,000 and $111,400. According to TradingView’s Cost-Basis Heatmap, around 172,700 BTC, worth $18.8 billion, were accumulated in this range, making it a significant resistance zone. A sustained break above could confirm renewed buying momentum and pave the way for higher targets.
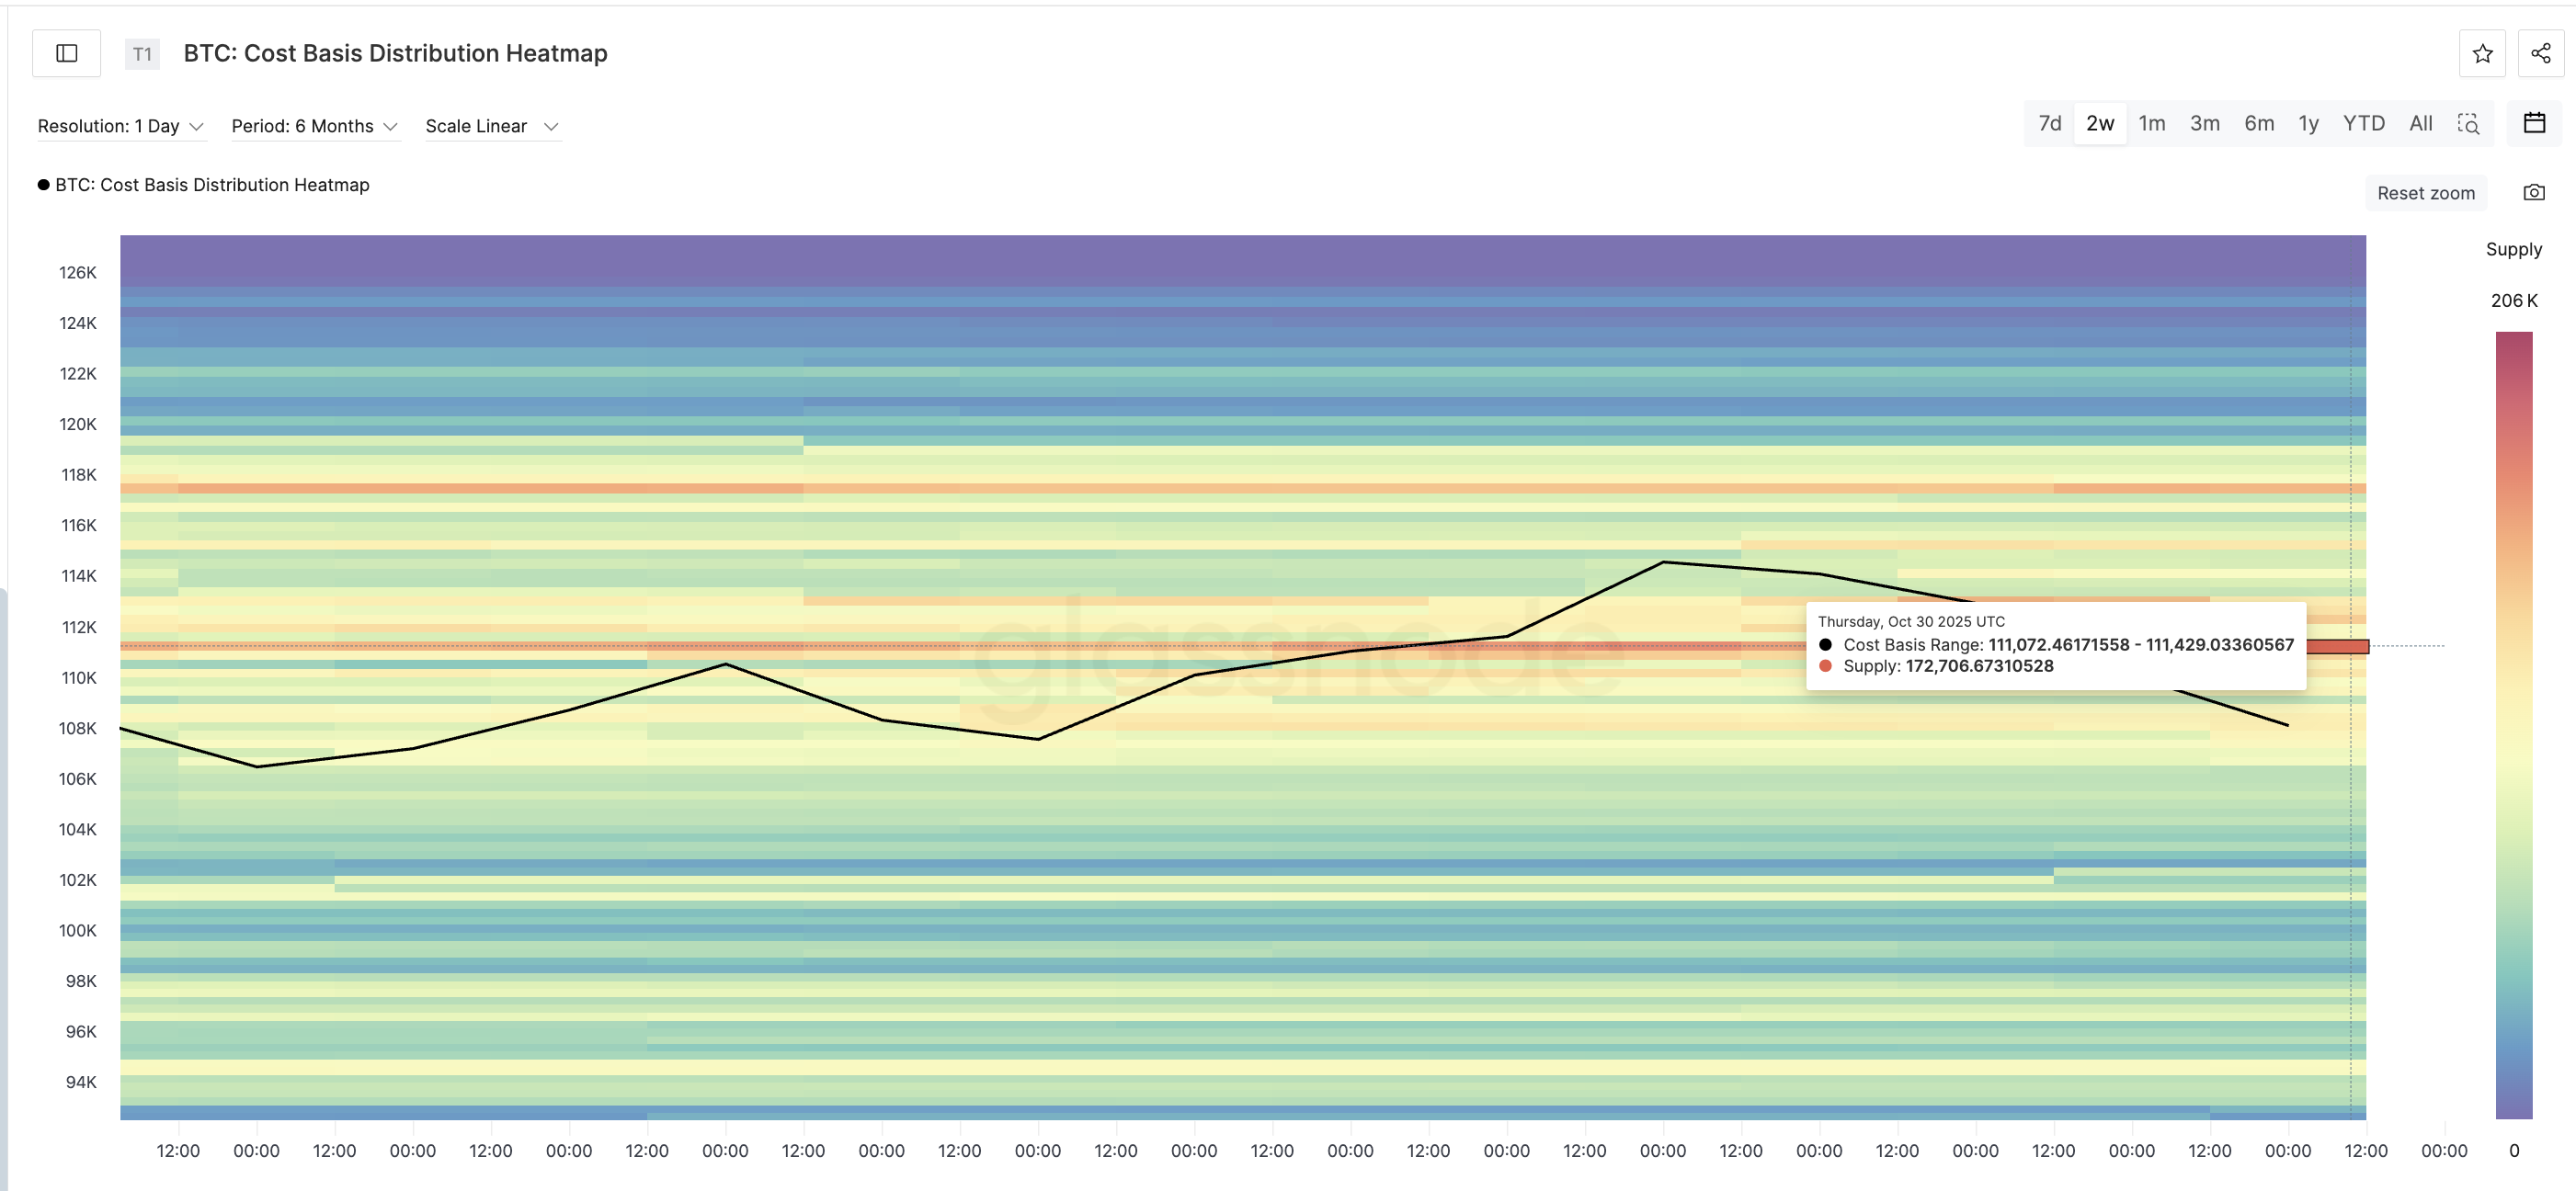 Source: Glassnode
Analyst Michael van de Poppe described the ongoing correction as “standard,” adding that as long as Bitcoin maintains support near $112,000, the broader uptrend remains intact.
Meanwhile, analyst Ali Martinez suggested that a breakout above $120,000 could lead Bitcoin to new all-time highs, potentially targeting $143,000 before entering a new accumulation phase.
Bitcoin $BTC must reclaim $119,000 to keep bullish momentum alive! Otherwise, the Pricing Bands signal a correction toward $96,530. pic.twitter.com/I7IGhKcXjX
— Ali (@ali_charts) October 15, 2025
Bitcoin’s near-term direction will likely depend on how markets interpret the Fed’s policy shift. If easing resumes in early 2026 amid slowing growth, analysts project Bitcoin could revisit the $200,000 mark by the third quarter of that year.