
Top 3 Price Prediction: Bitcoin, Gold, and Silver Stabilize as FOMC Sparks Flight to Safety

With the Federal Reserve cutting rates by 25 basis points and officially ending quantitative tightening, traders are eyeing fresh opportunities across Bitcoin, gold, and silver.
After the much-anticipated FOMC interest decision, Bitcoin, the colloquial digital gold, and commodity safe havens like gold and silver seek footing after turbulence.
Markets are moving past policymakers’ decision to cut interest rates by a quarter percentage point to focus on other drivers, including earnings and geopolitics.
What Next for Bitcoin, Gold, and Silver After FOMC Interest Rate Decision?
BeInCrypto reported the Fed’s decision to cut interest rates by 25 basis points (bps), effectively ending its balance sheet reduction. The move, which aligned with economists’ expectations, has inspired momentum for Bitcoin, Gold, and Silver prices.
Bitcoin May Only Be Attractive To Buy Past $112,926
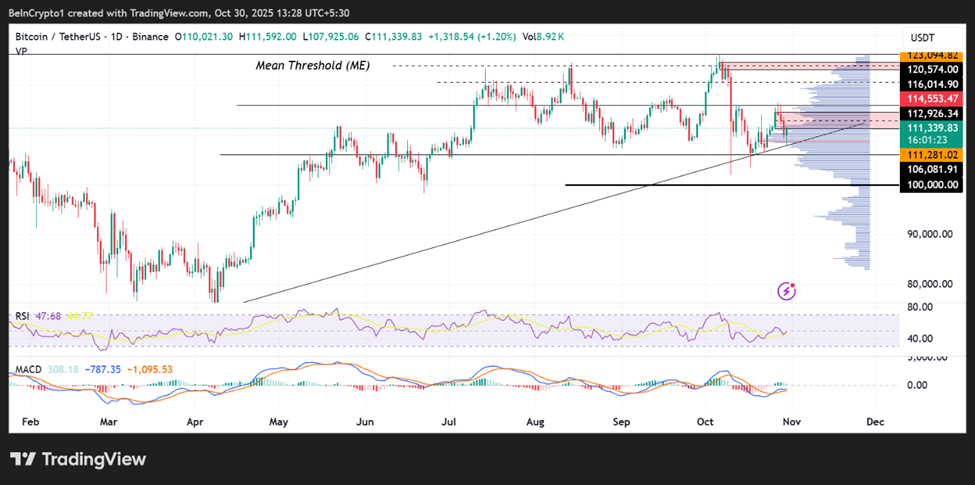
While policymakers’ decision to cut interest rates is bullish, Bitcoin may only be attractive to buy after crossing $112,926.
A decisive daily candlestick close above this level (the mean threshold or midline) of the supply zone between $111,281 and $114,453 would confirm that bulls have overpowered selling pressure from this order block.
If the Bitcoin price continues to hold above the ascending trendline, such a breach would be inevitable. This trendline has been a longstanding support level for the pioneer crypto since early April.
Bulls waiting for confirmation, however, should consider opening long positions above $114,553. Based on the volume profiles (blue horizontal bars), many bulls are waiting to interact with the BTC price above this level. After all, BTC’s Sharpe Ratio suggests a cycle toward a low-risk period.
Based on the Sharpe Ratio, Bitcoin $BTC tends to cycle between high and low risk periods. After reaching high-risk territory, a shift toward low risk now looks imminent. pic.twitter.com/9WI1LweQKg
— Ali (@ali_charts) October 30, 2025
The $116,014 level is also critical for the pioneer crypto. It is a support level that has turned resistance and continues to cap further upside. A breach and successful retest of this supplier congestion level could prime BTC price to $120,574.
Nevertheless, the Bitcoin price will have a shot at reclaiming its all-time high above $126,199 when it successfully breaks and closes above $123,917. This level is the midline of the supply zone between $123,094 and $124,630. Such a move would denote an 11.33% move above current levels.
 Bitcoin Price Performance. Source:
TradingView
Bitcoin Price Performance. Source:
TradingView
Conversely, on-chain analyst Ali says the TD sequential signals an imminent sell-off for the Bitcoin price. If the Bitcoin price falls below the ascending trendline, the ensuing selling momentum could see it roll over. It could find immediate support at $106,081.
In a dire case, the downtrend could extend for BTC to collect sell-side liquidity around $102,000, where the October 10 trading session bottomed out.
The MACD (Moving Average Convergence Divergence) is in negative territory, suggesting momentum favors sellers. Similarly, the RSI position below 50 accentuates this outlook.
Until Gold Breaks $4,048, Bears Have the Say!
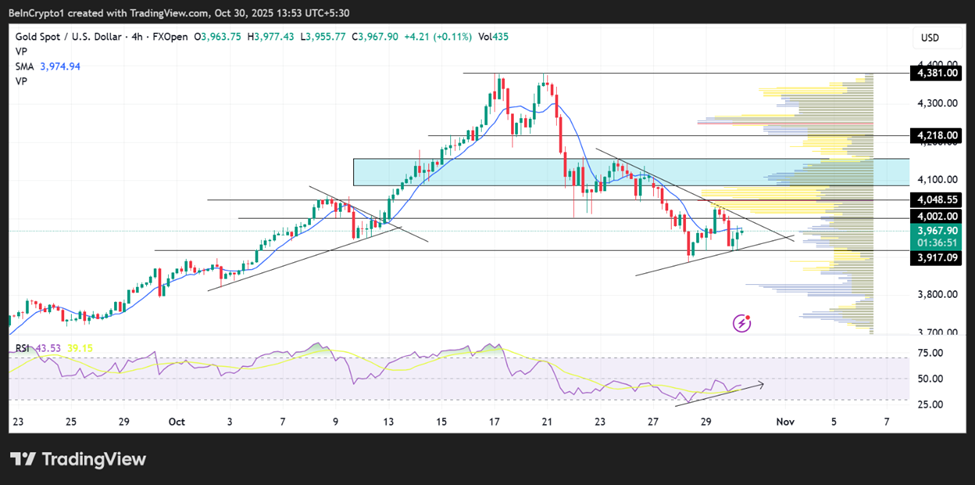
Gold is also attempting a recovery after the FOMC, with the RSI showing rising momentum. However, much remains on the balance because of the overhanging seller congestion levels.
The 9-day SMA (Simple Moving Average) continues to track gold from above at $3,975, limiting its upside potential.
The yellow horizontal bars (bearish volume profiles) also show many sellers waiting to book profits once the gold price reaches between $4,002 and $4,086.
 Gold (XAU) Price Performance. Source:
TradingView
Gold (XAU) Price Performance. Source:
TradingView
However, a breakout may be imminent, as the gold price is filling up a symmetric triangle on the four-hour timeframe.
In this regard, traders looking to open short positions for the precious metal should consider a decisive candlestick close below $3,917, which could see the XAU price dip toward $3,800. Such a move would constitute a 5% drawdown below current levels.
This Pattern Could See Silver Price Rise to $51.34
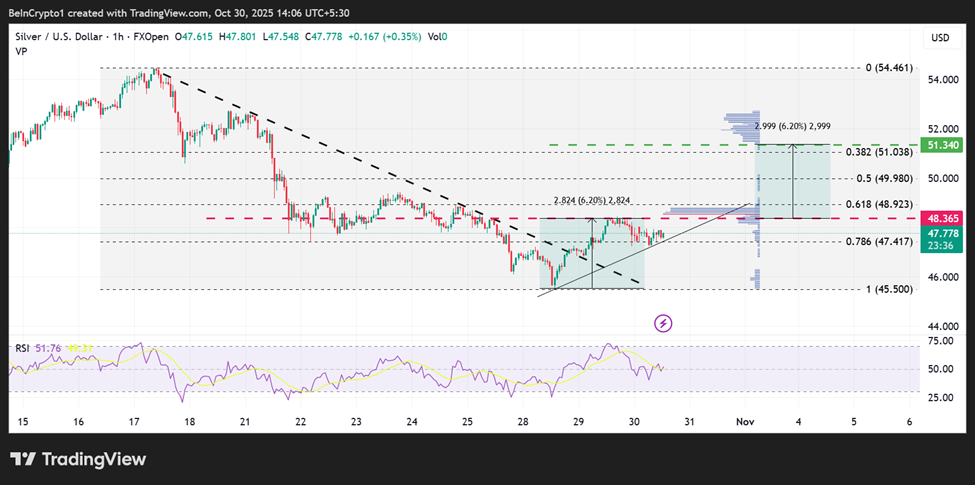
Like Bitcoin and gold, silver is also staging a recovery on the one-hour timeframe. However, while it consolidates along an ascending trendline, the resistance level at $48.36 remains a crucial barricade.
The resultant technical formation is an ascending triangle, a bullish continuation pattern that could catapult the silver price 6.20% up to $51.34.
This target objective is determined by measuring the triangle’s height and superimposing it at the expected breakout point. To support this thesis, the bullish profiles (grey horizontal bars) show a large volume of bulls waiting to interact with XAG above the $43.36 roadblock.
Key entry points beyond $43.36 include $48.92 and $49.98, earmarked by the 61.8% and 50% Fibonacci retracement levels, respectively.
 Silver (XAG) Price Performance. Source:
TradingView
Silver (XAG) Price Performance. Source:
TradingView
On the flipside, this bullish technical formation for the silver price could be invalidated if the price falls below $47.41, which coincides with the 78.6% Fibonacci retracement level. A candlestick close below this level on the one-hour timeframe could see XAG price drop toward $45.50, almost 5% below current levels.
Disclaimer: The content of this article solely reflects the author's opinion and does not represent the platform in any capacity. This article is not intended to serve as a reference for making investment decisions.
You may also like
x402 "Doers" List: Who Is Really Driving x402?
Farewell to empty talk—these x402 "infrastructure pioneers" and "pragmatists" are driving the development of the x402 protocol.

Why the x402 protocol didn’t fade after the PING hype, and what’s driving the second wave
Why can’t Ethereum hold $4K? ETH recovery in doubt as data leans bearish
Fed signals ’end of QT’: What does it mean for Bitcoin price?