Bitget App
Trade smarter
Buy cryptoMarketsTradeFuturesEarnSquareMore
Is Ethereum (ETH) Poised For A Bullish Rally? This Fractal Setup Saying Yes!

Is Ethereum (ETH) Poised For A Bullish Rally? This Fractal Setup Saying Yes!

CoinsProbeCoinsProbe2025/10/23 18:57
By:Nilesh Hembade

Date: Thu, Oct 23, 2025 | 03:10 PM GMT

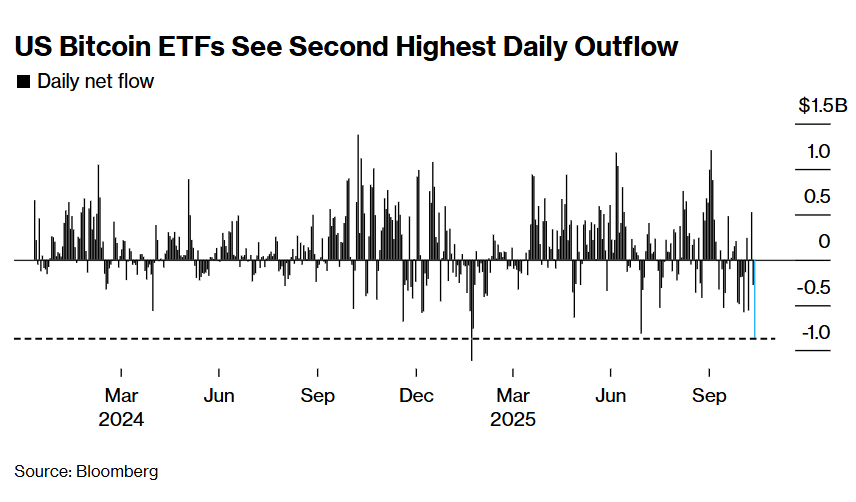
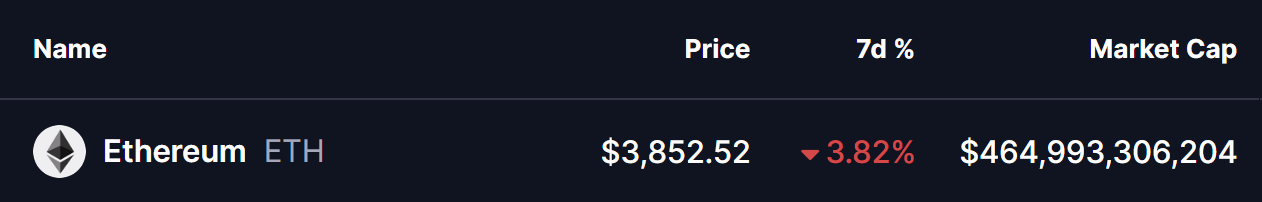
The broader cryptocurrency market remains in choppy momentum following the historic $19 billion liquidation event on October 10, which was triggered by escalating tariff tensions. The sell-off dragged Ethereum (ETH) from around $4,300 to a low of $3,404, before bouncing back to its current price near $3,850, still reflecting a 3.82% weekly decline.

However, beyond the red candles and cautious sentiment, Ethereum’s latest price action is beginning to mirror a familiar fractal pattern that previously appeared in Bitcoin (BTC) — and if history rhymes again, ETH could be gearing up for a major bullish continuation.

Is Ethereum (ETH) Poised For A Bullish Rally? This Fractal Setup Saying Yes! image 0 Source: Coinmarketcap

Fractal Setup Hints at a Bullish Continuation

According to crypto analyst CryptoBullet , Ethereum’s current structure is closely tracking Bitcoin’s February–December 2024 breakout fractal — a setup that preceded one of BTC’s strongest rallies after a prolonged corrective phase.

Back then, Bitcoin experienced a deep sell-off during the Yen Carry Trade crisis, but what followed was a remarkable 123% rally from its crash low as sentiment flipped bullish and momentum accelerated.

Is Ethereum (ETH) Poised For A Bullish Rally? This Fractal Setup Saying Yes! image 1 
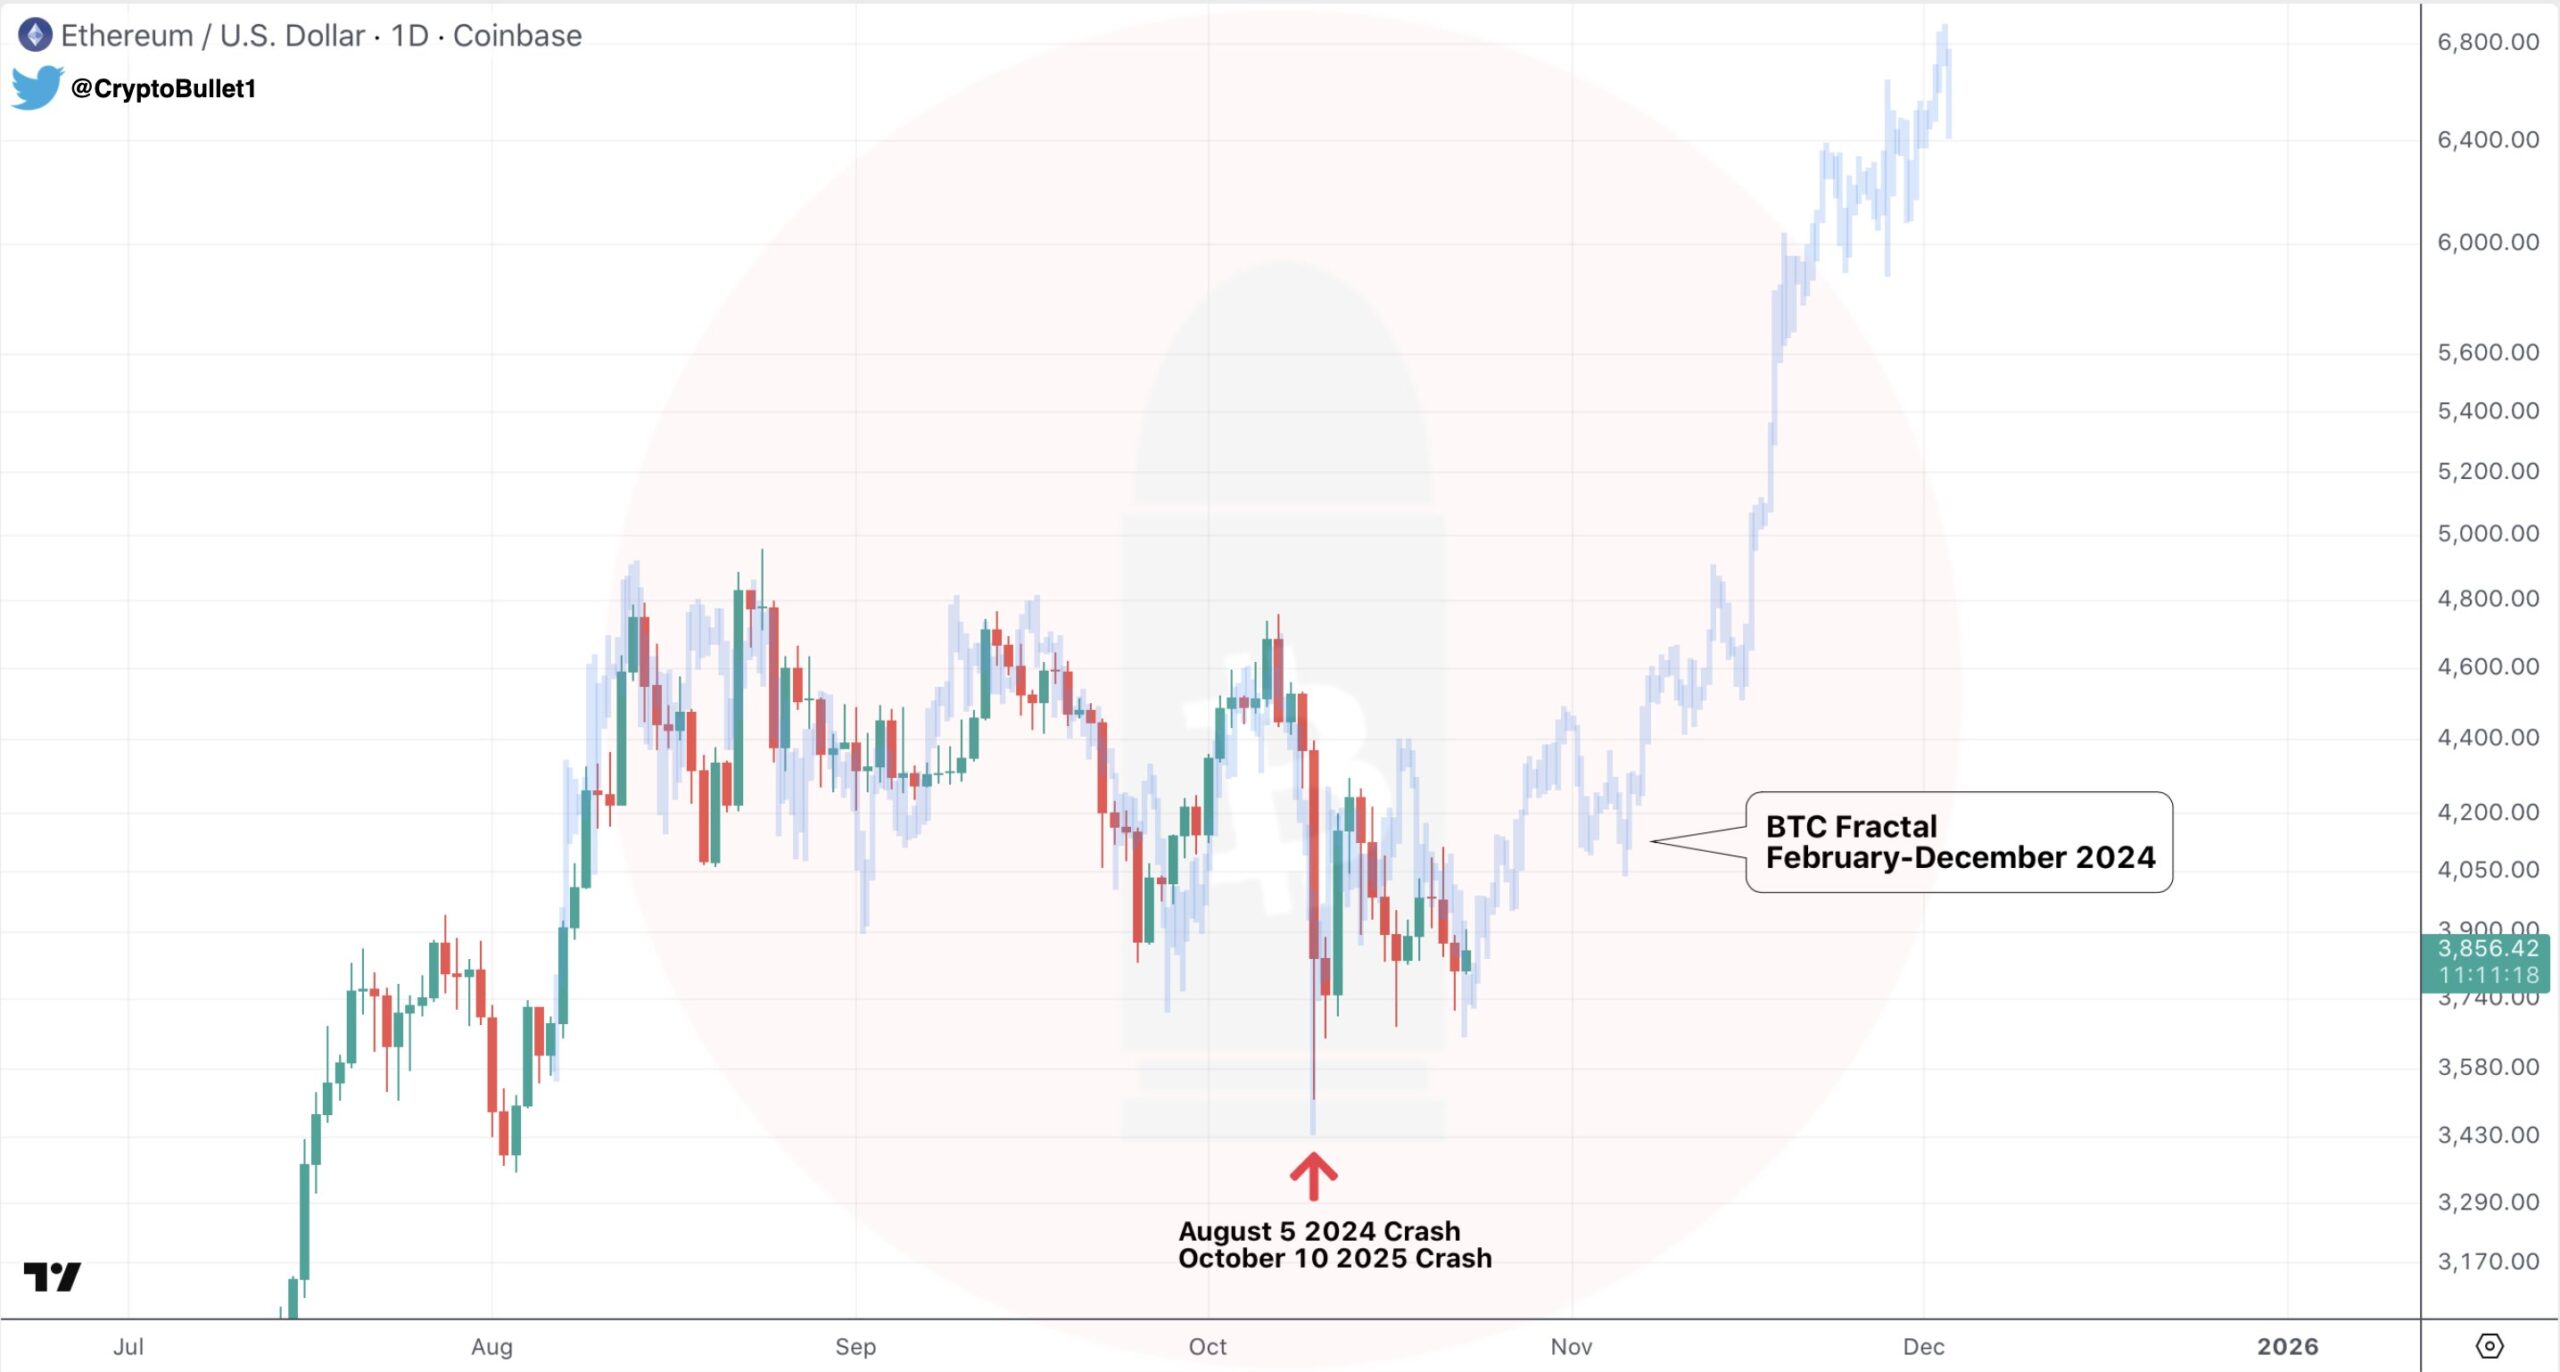
BTC and ETH Fractal Chart/Credits: @CryptoBullet1 (X)

Now, Ethereum appears to be following a strikingly similar trajectory. The October 10 “tariff crash” pushed ETH down to around $3,400, forming a significant local bottom before buyers returned with confidence. Since then, ETH has recovered to $3,850, moving steadily toward its key resistance zone between $4,050 and $4,150 — the same structural region that marked Bitcoin’s confirmed reversal during its 2024 recovery phase.

What’s Next for ETH?

If this fractal pattern continues to play out, Ethereum could soon reclaim the $4,050–$4,150 resistance zone, confirming a breakout structure similar to BTC’s historical move. A decisive close above this level could pave the way for a powerful continuation rally, potentially lifting ETH toward the $6,800 region — a level that would mirror the BTC fractal projection overlayed on the current chart.

That said, fractal patterns are not guarantees — they serve as a visual map of repeating market behavior rather than a forecast.

For now, the pattern suggests Ethereum’s recovery momentum remains intact, with the next few days likely to determine whether ETH confirms its fractal-driven bullish breakout or pauses for a deeper retest.

0

Disclaimer: The content of this article solely reflects the author's opinion and does not represent the platform in any capacity. This article is not intended to serve as a reference for making investment decisions.

PoolX: Earn new token airdrops
Lock your assets and earn 10%+ APR
Lock now!

You may also like

As economic cracks deepen, bitcoin may become the next liquidity "release valve"

The US economy is showing a divided state, with financial markets booming while the real economy is declining. The manufacturing PMI continues to contract, yet the stock market is rising due to concentrated profits in technology and financial companies, resulting in balance sheet inflation. Monetary policy struggles to benefit the real economy, and fiscal policy faces difficulties. The market structure leads to low capital efficiency, widening the gap between rich and poor and increasing social discontent. Cryptocurrency is seen as a relief valve, offering open financial opportunities. The economic cycle oscillates between policy adjustments and market reactions, lacking substantial recovery. Summary generated by Mars AI. The accuracy and completeness of this summary are still being iteratively updated by the Mars AI model.

MarsBit2025/11/14 12:23
As economic cracks deepen, bitcoin may become the next liquidity "release valve"

The wave of cryptocurrency liquidations continues! US Bitcoin ETF sees second highest single-day outflow in history

Due to the reassessment of Federal Reserve rate cut expectations and the fading rebound of the U.S. stock market, the crypto market continues to experience liquidations, with significant ETF capital outflows and options traders increasing bets on volatility. Institutions warn that technical support for bitcoin above $90,000 is weak.

Jin102025/11/14 12:16
The wave of cryptocurrency liquidations continues! US Bitcoin ETF sees second highest single-day outflow in history

When traditional financial markets fail, will the crypto industry become a "pressure relief valve" for liquidity?

As long as the system continues to recycle debt into asset bubbles, we will not see a true recovery—only a slow stagnation masked by rising nominal figures.

深潮2025/11/14 11:14
When traditional financial markets fail, will the crypto industry become a "pressure relief valve" for liquidity?