
The era of Fed's Permanent Quantitative Easing is approaching, where do opportunities lie for the common person?

When central banks around the world begin unrestricted money printing, we have no choice but to hold assets they cannot print: gold and Bitcoin.
Original Article Title: Why QT is Dead and QE is Coming
Original Article Author: James Lavish, CFA
Original Article Translation: Golem, Odaily Planet Daily
"The Federal Reserve may stop shrinking its balance sheet in the coming months," a statement by Fed Chairman Powell last week sparked various speculations in the market. The hidden signal behind this statement is that "quantitative tightening (QT) is about to transition to quantitative easing (QE), and at a faster pace than most people expect."
But is this just a symbolic move by the Fed, or does it carry extraordinary significance? Most importantly, what is Powell implying about the current state of the financial system? This article will delve into the Fed's liquidity strategy, the liquidity crisis it faces today compared to 2019, and why the Fed will embark on a permanent quantitative easing policy (QE).
Looming Liquidity Crisis
Reverse Repurchase Agreement (RRP) Has Become Ineffective
RRP was previously a massive reservoir of excess liquidity, with its savings peaking in 2022 at around $2.4 trillion, but now it is essentially empty. As of this week, RRP has only a few billion dollars left, shrinking by over 99% from its peak.
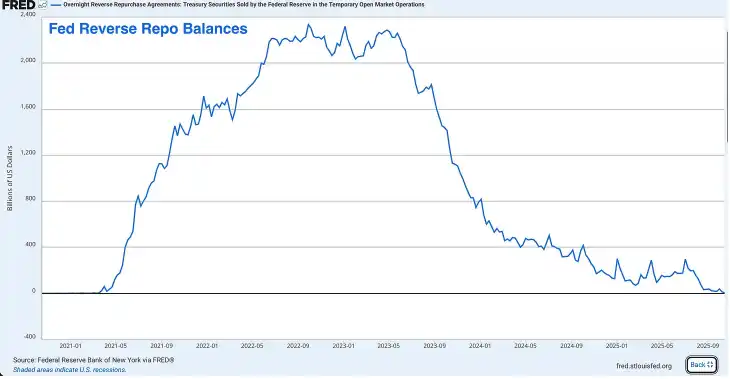
Although RRP was initially created as a tool to help the Fed manage short-term interest rates, in recent years it has become a pressure release valve for excess liquidity and a shock absorber for the entire financial system.
During the COVID-19 pandemic, the Fed and the Treasury injected trillions of dollars into the financial system, with this cash ultimately being deposited into RRP through money market funds. Later, Treasury Secretary Janet Yellen came up with a clever trick to deplete the RRP funds by issuing attractive short-term Treasury bills.
Money market funds withdrew their cash from RRP (earning the Fed's RRP rate) and instead purchased higher-yielding Treasury bills. This allowed the Treasury to fund the government's massive deficit without injecting large amounts of long-term U.S. Treasury bonds into the market.
While this was a brilliant strategy before RRP was depleted, it is no longer effective today.
Bank Reserve Levels Now at Stage Two Alert
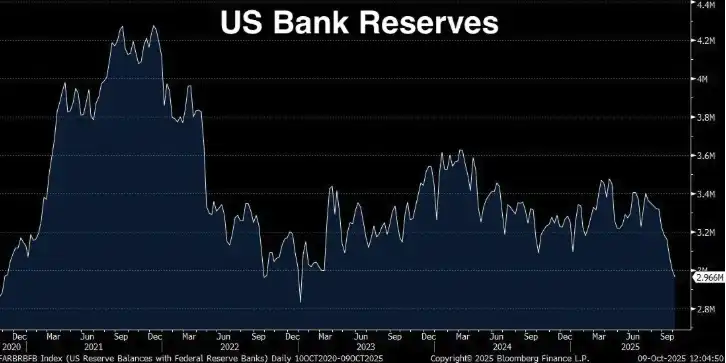
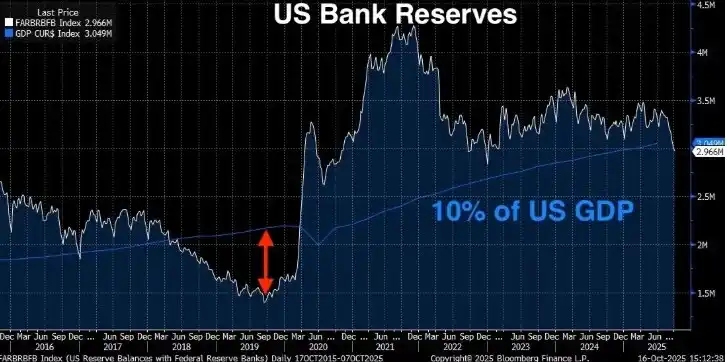
Bank reserves have dropped to $2.9 trillion, a decrease of $1.3 trillion since reaching a peak in September 2021. Powell has made it clear that the Fed starts to get uncomfortable when bank reserves fall below 10-11% of GDP. The 10% threshold is not an arbitrary number; it is based on extensive Fed research, surveys of banks, and lessons learned from the actual events of September 2019 (more on that disaster to come).
So where do we stand now?
Current Bank Reserves: $2.96 trillion (as of last week)
Current U.S. GDP: $30.486 trillion (Q2 2025) Reserves as % of GDP: 9.71%

Current bank reserves have fallen below the Fed's established 10% "comfortable level" of reserves deemed necessary for the financial system to operate smoothly. According to the Fed, to ensure market functioning, reserves should be maintained between $2.8 trillion and $3.4 trillion. However, with GDP at $30.5 trillion, the 10% threshold would imply reserves ideally over $3.05 trillion.
With current reserves at $2.96 trillion, in short, we are in a precarious position. And with the RRP almost fully tapped, the Fed has essentially no more wiggle room.
In January of this year, bank reserves were around $3.4 trillion, RRP around $600 billion, with total liquidity around $4 trillion, meaning that in less than a year, total system liquidity has declined by over $1 trillion. To make matters worse, the Fed is still engaging in quantitative tightening at a pace of $25 billion per month.
This Time Could Be Worse Than 2019
Some may optimistically point to 2019 when we faced a similar situation with reserves dropping to $1.5 trillion, but everything turned out fine in the end, assuming the same outcome this time. However, the truth may be that the liquidity crisis we are facing this time around could be worse than 2019.
In 2019, reserves fell to $1.5 trillion, about 7% of GDP (which was around $21.4 trillion at the time), causing a paralysis in the financial system. The repo market saw explosive growth, leading the Federal Reserve to panic and resort to money printing. Currently, bank reserves represent 9.71% of GDP, slightly below the 10% reserve adequacy threshold mentioned by Powell but still higher than in 2019. So, why is the situation getting worse?
There are three reasons:
· The absolute size of the financial system has expanded. The banking system is larger, with bigger balance sheets, requiring a larger amount of reserves to keep the system functioning smoothly. The 7% in 2019 triggered a crisis; now, with reserves at 9.71% of GDP, the pressure is evident, and as reserve levels decrease, this pressure point could worsen.
· We no longer have the RRP buffer. In 2019, RRP was almost nonexistent, but in the post-pandemic era, the financial system has grown accustomed to this extra liquidity buffer. Now that it's gone, the financial system must readjust to operate without it.
· Regulatory requirements have become stricter. Following the 2008 financial crisis and the recent 2023 regional banking crisis, banks face tighter liquidity requirements. They need to hold more High-Quality Liquid Assets (HQLA) to meet regulations like the Liquidity Coverage Ratio (LCR). Bank reserves are the highest quality liquid assets. As reserves decline, banks are getting closer to their regulatory minimum. As they approach it, they start taking defensive actions like reducing lending, hoarding liquidity, and raising the Secured Overnight Financing Rate (SOFR).
SOFR Spread is Widening
If the increase in bank reserves and the depletion of RRP were just a few "stop signs" on our path towards a liquidity crisis, next up, we'll see the real "flashing red lights" ahead.
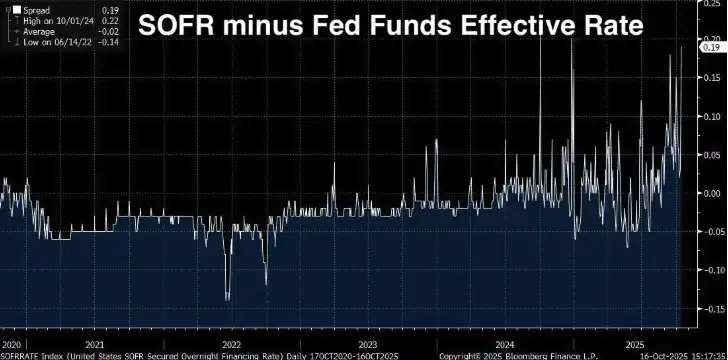
SOFR/Effective Federal Funds Rate Spread
SOFR (Secured Overnight Financing Rate) is the rate at which financial institutions borrow cash overnight, collateralized by U.S. Treasury securities. It has replaced the London Interbank Offered Rate (LIBOR) as the primary short-term rate benchmark, calculated based on actual transactions in the U.S. Treasury repo market (with daily volumes around $1 trillion).
The Effective Federal Funds Rate (EFFR) is the rate at which banks lend reserve balances to other banks overnight, unsecured. Under normal circumstances, the two rates trade very close to each other (within a few basis points), as they are both overnight rates linked to the Fed's policy and reflect short-term funding conditions.
Under all normal circumstances, they are almost identical, but when the SOFR starts to noticeably exceed the EFFR, it issues a warning. This means that secured loans (i.e., loans backed by U.S. Treasuries) suddenly become more expensive than unsecured interbank loans.
Typically, the cost of borrowing using rock-solid collateral like U.S. Treasuries should be lower, not higher. Therefore, when the opposite occurs, it indicates a problem within the system, such as a liquidity squeeze or a shrinking balance sheet capacity.
SOFR surpassing EFFR is like banks saying, "I'd rather offer you an unsecured loan at a lower rate than accept your U.S. Treasury collateral at a higher rate." This situation does not occur in a healthy, liquid market; it only occurs when liquidity begins to dry up.
Structural Widening of the Spread
From 2024 to 2025, the spread has been steadily widening, with the current spread at 0.19 (or 19 basis points). This may sound small, but in the overnight funding realm, this is already a significant figure.
The average spread from 2020 to 2022 was approximately -0.02, with a low point on June 14, 2022, even reaching -0.14. However, by October 1, 2024, the spread peaked at 0.22, and now it stands at 0.19. The shift from a negative to a positive spread is not a short-term peak performance but a structural change signaling tight reserve conditions in the market.
Why the SOFR Spread Is So Important
The SOFR/EFFR spread is a real-time market signal. It is not a lagging indicator like GDP or a survey like consumer confidence. It represents actual borrowing and lending of funds in the world's largest and most liquid funding market.
When this spread continues to widen, it signifies:
· Banks do not have excess reserves available to lend freely. If they did, they would arbitrage by lending at a higher rate in the SOFR market to offset the spread.
· The Federal Reserve's Open Market Operation is Insufficient. The Federal Reserve has a standing repo facility (SRF) designed to prevent funding pressures by allowing banks to borrow U.S. Treasuries at a fixed rate. Despite the existence of this tool, the SOFR trading rate remains elevated, indicating that the demand for reserves exceeds what the Federal Reserve is providing.
· Year-End Pressures are Escalating. Banks face additional balance sheet scrutiny at quarter-end and year-end for regulatory reporting purposes. These pressures have now spilled over into regular trading days, indicating that the reserve target level is too low.
· We are One Step Away from a 2019-Style Crisis. What we are currently seeing is a structural rise, but we have not yet seen panic (at the moment). In September 2019, the overnight repo rate didn't gradually rise but surged nearly overnight from 2% to 10%.
The Federal Reserve is acutely aware of what this means, with the SOFR spread being one of the key metrics monitored daily by the New York Fed's trading desk. They know what happened last time the spread widened so dramatically, and they know what will happen if no action is taken.
Revisiting the 2019 September Repo Crisis?
September 17, 2019. For anyone following Federal Reserve policy, this should be a day to remember. Because on that morning, the overnight repo rate (the rate at which banks borrow overnight using U.S. Treasuries as collateral) suddenly spiked from around 2% to 10%.
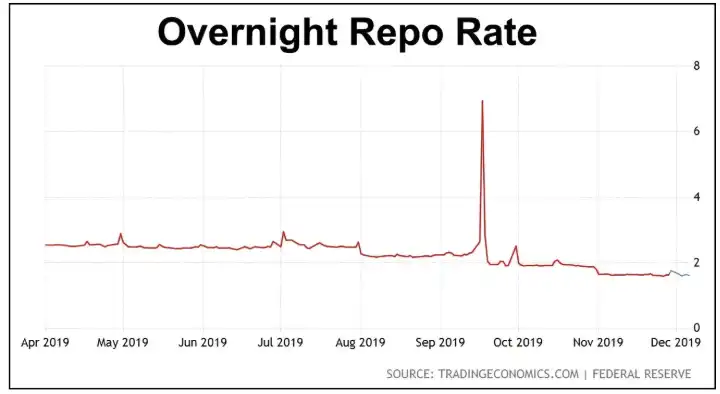
At that time, the Federal Reserve's target rate was 2.00-2.25%, and the repo rate jumped to five times the Fed's policy rate in a matter of hours, all because bank reserves had dropped too low.
After the financial crisis, the Federal Reserve expanded its balance sheet from less than $1 trillion to over $4.5 trillion through various quantitative easing programs. However, starting in 2017, they began a process of quantitative tightening by allowing bonds to mature without reinvestment, shrinking the balance sheet.
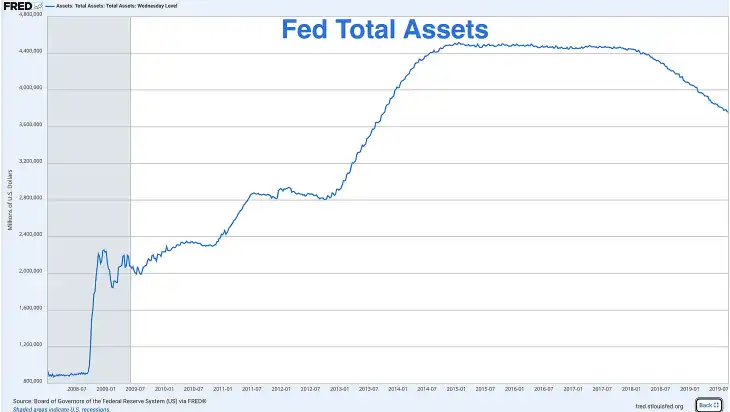
By September 2019, reserves had dropped to around $1.5 trillion, about 7% of the GDP at the time (with GDP around $21.4 trillion). The Federal Reserve naively thought this was not a problem, but they were proven wrong.
At that time, several deadly factors converged to cause the overnight repo rate to skyrocket:
· Corporate Tax Payment Deadline—Mid-September is a crucial deadline for corporate taxes. Companies withdraw reserve funds from the banking system to pay the U.S. government, temporarily draining liquidity.
· Treasury Settlement—A large Treasury auction had just settled, taking additional reserve funds out of the system.
· Lack of Buffer—Unlike today (before RRP was exhausted), in 2019, reserves were the sole source of liquidity.
· Regulatory Constraints—Post-2008 regulatory requirements meant that banks were less willing to lend reserve funds, even as rates rose, because they needed to maintain a certain ratio.
Fed's Remedial Measures: Pre-COVID Quantitative Easing
The Fed understandably panicked, and within hours, they announced emergency repo operations, injecting hundreds of billions of dollars into the overnight funding market. Over the following weeks, they started to intervene:
Conducting daily repo operations, adding temporary liquidity of billions of dollars to the market. Announcing they would once again start purchasing U.S. Treasuries (i.e., expanding the balance sheet). Ending quantitative tightening months ahead of schedule and commencing quantitative easing in October 2019.
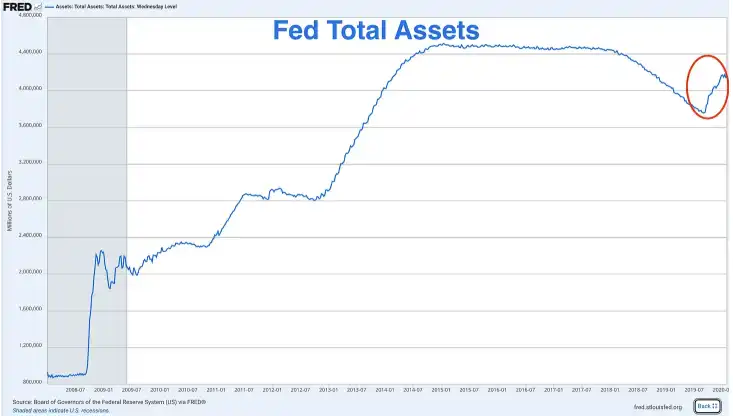
The year-end surge in the Fed's total assets in 2019 was credited to quantitative easing, with the printing press starting to roll.
However, all of this unfolded in the six months before the COVID-19 lockdown. So, the Fed's restart of quantitative easing was not due to the pandemic, not due to an economic recession, not even due to a traditional financial crisis, but because bank reserves were too low, and the financial system's "pipeline" was ruptured.
Now, the Fed is once again facing the issue of low bank reserves, and we are just in the early stages of the crisis.
Differences Between Now and the 2019 Crisis
However, there are still some differences between now and 2019, making the crisis worse:
· The Treasury Needs to Issue More Bonds
In 2019, the federal deficit was about $1 trillion per year, which, although historically high, was still manageable. Today, the annual deficit is over $2 trillion, and there seems to be no end in sight. The Treasury Department must issue massive amounts of bonds to fund the government, and every dollar of issued government debt could potentially absorb liquidity from the banking system.
· The Fed's Balance Sheet Has Ballooned Beyond Expectations
When the repo crisis broke out in 2019, the Fed's balance sheet was about $3.8 trillion. Today, even after $2 trillion of quantitative tightening (QT), its size is still around $6.9 trillion. The Fed was supposed to "normalize" its balance sheet, returning it to pre-crisis levels. However, they can't do it now because every attempt runs into the same problem: a lack of reserves.
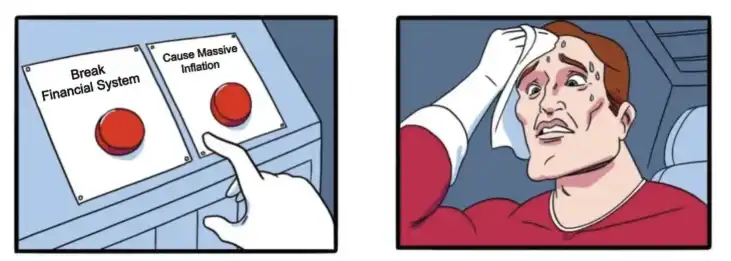
The Fed has essentially pushed itself into a permanent state of quantitative easing. They cannot significantly reduce the balance sheet without destabilizing the system, nor can they maintain the current size without exacerbating inflation.
· Higher Reserve Levels Are Causing Cracks in the System
In 2019, at the outbreak of the crisis, the reserve size had already reached 7% of GDP, and now, at 9.7%, we are seeing warning signs. This indicates that the financial system now requires a higher reserve base to operate smoothly. The economy, the banking system, and leverage have all grown larger, regulatory requirements have become stricter, hence the needed cushion is also larger.
If at 7% of GDP in 2019 the system was already strained, and now we are facing pressure at 9.7%, how much lower can this number go before a system collapse?
The Fed Has Signaled
Powell's statement that the Fed "may stop shrinking the balance sheet in the next few months" was not off the cuff; it was a deliberate signal. The Fed is preparing for a policy shift, trying to avoid being caught off guard as in 2019, taking panicked emergency actions.
This time, they want to appear in control. But control is just an illusion. The result is the same: quantitative tightening is about to end, and quantitative easing is about to begin.
Now the only question is: Will they wait for the crisis to unfold, or will they strike first?
The Fed Must Implement Quantitative Easing (QE)
We already know that the current state of the U.S. economy is precarious, with the reserve level extremely low, RRP depleted, SOFR spread widening, and a situation even worse than in 2019. Now, let's delve into why the Federal Reserve is so concerned about the reserve level and what will happen when this liquidity crisis intensifies.
When the reserve rate falls below 10-11% of GDP, banks begin to exhibit stress behavior, including:
· Being less willing to lend their reserves overnight to other banks
· Hoarding liquidity to address unexpected demands
· Charging higher rates for short-term loans (SOFR spread)
· Reducing lending to the real economy
· Making their balance sheets more defensive
With the current reserve rate at 9.71% of GDP, the money transmission mechanism may already be starting to break down.
The Trauma of the 2023 Banking Crisis
The Federal Reserve and regulatory agencies are deeply concerned about the regional banking crisis in March 2023. At that time, banks like Silicon Valley Bank and First Republic Bank collapsed due to poor liquidity management. The long-term bonds they held depreciated as interest rates rose, and when depositors withdrew their funds, the banks were unable to offset the outflow without selling these bonds, resulting in massive losses.
In the end, the Federal Reserve intervened and launched the Bank Term Funding Program (BTFP), allowing banks to borrow against their underwater bonds at face value to prevent this crisis.
This crisis is still vivid today. Imagine attempting to shrink the overall reserve supply (through quantitative tightening policies) in an environment where banks are still scarred, regulatory scrutiny is intense, and rates are below the 10% threshold. You can understand why Powell is already talking about ending quantitative tightening policies.
The Fed Has No Choice But to Move Forward
The current GDP is $30.5 trillion, with an annual growth rate of about 2-3%. If this year the GDP grows by 3%, that means an additional output of around $900 billion. If the Fed wants reserves to remain around 10% of GDP, reserves need to increase by about $90 billion annually to keep up with the growth rate.
On the contrary, the Fed has been reducing its balance sheet by about $300 billion annually ($250 billion per month × 12). Even if the Fed were to halt quantitative tightening today and stabilize reserves at $2.96 trillion, the reserve-to-GDP ratio would still decline over time, dropping from 9.7% to 9.5%, then 9.2%, or even lower.
To maintain this ratio (or bring it back above 10%), the Fed has two options:
· Keep reserves growing in line with GDP (moderate quantitative easing)
· Let the ratio gradually decline until a breach occurs
There is no third choice. In short, the Fed is like a mouse stuck on a hamster wheel, forced to move forward.
The Fed is expected to officially announce the end of its quantitative tightening policy at the December or January FOMC meeting. They will frame it as a "technical adjustment to maintain ample reserves" rather than a policy shift. If there is a significant reserve drawdown again before year-end, the Fed may be forced to issue an emergency statement, as it did in 2019.
The Fed Always Overcorrects
With the federal government's deficit exceeding $2 trillion annually, the Treasury needs to issue a large amount of bonds. With the RRPs depleted, where will the funds come from? There isn't enough private demand to absorb over $2 trillion in bonds each year unless yields skyrocket. If banks tap reserves to buy U.S. Treasuries, it will further deplete reserves, exacerbating the issue.
This situation forces the Fed to once again become the buyer of last resort. Additionally, with a GDP annual growth rate of 2-3%, reserves need to increase by $60-90 billion annually to maintain the current ratio.
Looking back at 2008-2014, the Fed's quantitative easing was not restrained. They conducted three rounds of QE and one twist operation, expanding their balance sheet from $900 billion to $4.5 trillion.
Now, in 2019-2020, they restarted balance sheet expansion in October 2019 (buying $60 billion in U.S. Treasuries per month). Then, with the onset of the pandemic, they unleashed aggressive expansion, adding $5 trillion in a matter of months.
When the Fed shifts to easy policy, they always overcorrect. Therefore, when this round of quantitative tightening ends, do not expect the Fed to engage in a mild and gradual QE. Rather, anticipate a vigorous expansion akin to a flood.
The Federal Reserve may purchase $600 billion to $1 trillion of U.S. Treasuries each month to "maintain ample reserves and ensure smooth market functioning."
What Should We Do?
When central banks around the world begin unlimited money printing, we have only one rational response: hold assets they cannot print: gold and Bitcoin.
The market has already priced in quantitative easing into the price of gold, which has skyrocketed. In January 2025, the price of gold was around $2,500 per ounce, and it has now risen by over 70%, with the trading price exceeding $4,000 per ounce. Smart investors are not waiting for the Fed to announce quantitative easing; instead, they have already started to "buy in."
In addition to gold, Bitcoin is also the best asset to deal with the upcoming quantitative easing tsunami.
Bitcoin is the first truly scarce digital asset, with a fixed supply of 21 million. While the Fed can print an unlimited amount of dollars, no entity, whether the Fed, government, corporation, or miner, can create more Bitcoin.
At the same time, Bitcoin's upside potential is even greater than that of gold for the following reasons:
· Bitcoin is harder to mine than gold.
· Gold's supply increases annually through mining by about 1.5-2%, making gold's scarcity relative rather than absolute; Bitcoin's supply grows at a fixed decreasing rate (halving every four years) and will reach an absolute peak of 21 million around 2140, after which Bitcoin will no longer be mined, ever.
· Bitcoin is the hardest money ever created in human history.
· Bitcoin follows the trend of gold and has a multiplier effect. Currently, Bitcoin's trend is significantly "behind" that of gold, but historically, when gold rallies due to continued monetary policy concerns, Bitcoin eventually catches up and usually exceeds the percentage gains of gold.
· Bitcoin allows you to completely opt-out of the sovereign debt Ponzi scheme. While gold can protect you from inflation, Bitcoin goes far beyond that; it exists entirely outside the system, cannot be confiscated (if properly stored), devalued, or manipulated by central banks.
In conclusion, I hope that your investment decisions will be wiser after understanding the reasons for the Fed's upcoming shift from quantitative tightening to quantitative easing, the liquidity conditions, and why Bitcoin and gold are assets worth holding in the upcoming period of currency expansion.
Disclaimer: The content of this article solely reflects the author's opinion and does not represent the platform in any capacity. This article is not intended to serve as a reference for making investment decisions.
You may also like
A 6200-fold profit: Who is the biggest winner of Moore Threads?
On December 5, Moore Threads officially debuted on the STAR Market, opening at 650 yuan, which represents a 468.78% surge compared to its issue price of 114.28 yuan.

K-shaped Divergence in Major Asset Pricing: The Subsequent Evolution of "Fiscal Risk Premium"
Southwest Securities believes that the current market is in a dangerous and fragmented period driven by "fiscal dominance," where traditional macro logic has failed, and both U.S. stocks and gold have become tools to hedge against fiat currency credit risk.
"Shadow Fed Chair" Hassett speaks out: The Federal Reserve should cut rates next week, expected 25 basis points
Hassett stated in a media interview that the FOMC now appears more inclined to cut interest rates, and he expects a rate cut of 25 basis points.

Key Market Intelligence for December 5: How Much Did You Miss?
1. On-chain funds: Today, $55.7M flowed into Ethereum; $51.4M flowed out of Base. 2. Top gainers and losers: $OMNI, $FTN. 3. Top news: At 23:00 tonight, the US will release the annual Core PCE Price Index for September, with an expected 2.9%.
