Is Bitcoin's cycle curse repeating itself?

Source: The DeFi Report
Author: Michael Nadeau
Translation: BitpushNews
The adoption cycles of cryptocurrencies typically consist of a three-year period of growth and expansion, followed by a bear market lasting about one year.
Counting from the BTC price low in November 2022, the current expansion phase has lasted 1,044 days. For reference, the expansion phase in the 2021 cycle lasted 1,063 days, and in the 2017 cycle, it was 1,065 days.
By this measure, we are clearly in the "late stage" of the current expansion cycle.
But how do the current data and key indicators compare to September 2021?
We will answer this question in this report.
Realized Profits and Coin Days Destroyed Indicator
Realized Profits
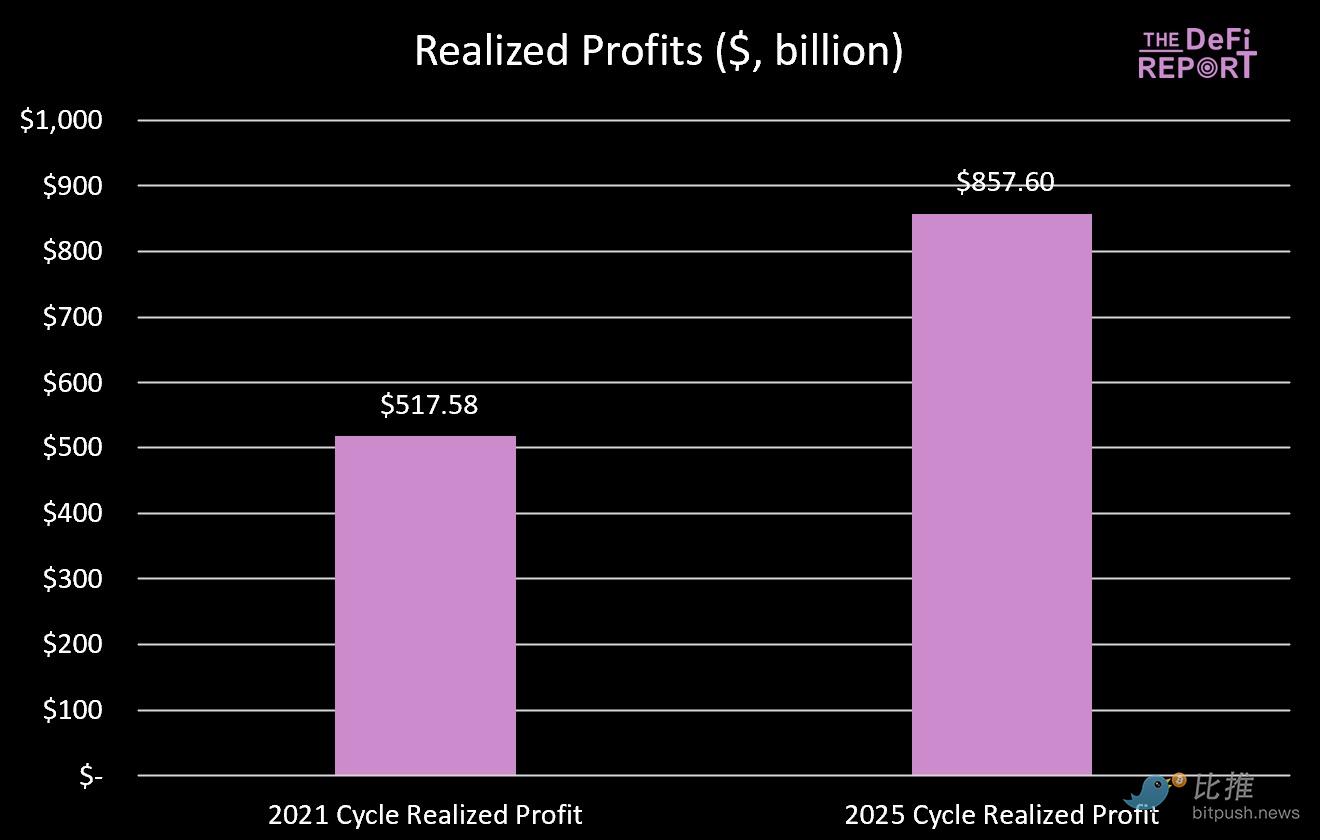
According to Glassnode data, BTC investors in this cycle have realized $85.7 billion in profits—65% higher than in the 2021 cycle.
Given that the higher the BTC price, the more returns long-term investors receive each cycle, this phenomenon is expected.
A standardized way to compare is to look at realized profits relative to the market cap in each cycle.
The 2021 cycle peaked at a market cap of $1.26 trillion, with a realized profit-to-market cap ratio of 0.41.
BTC’s current market cap is $2.28 trillion, and the realized profit-to-market cap ratio for this cycle is 0.38.
Conclusion? From a "wealth creation" perspective, we are currently at a level similar to the entire 2021 cycle.
[Realized Profits Data Chart]
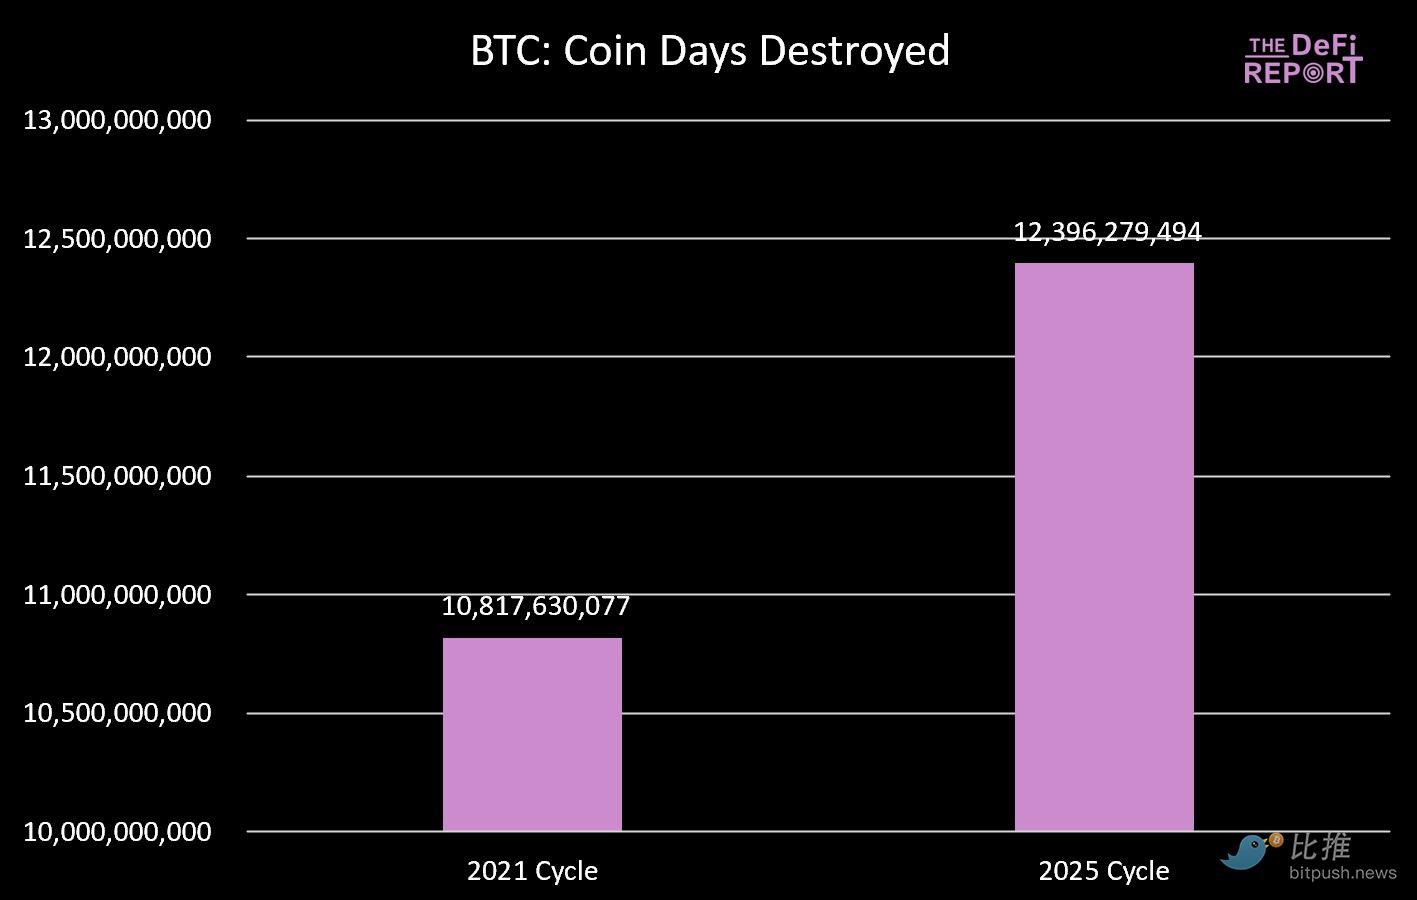
Coin Days Destroyed Indicator
Another perspective on profit-taking is the "coin days destroyed indicator."
According to Glassnode’s definition, this indicator measures the total number of days tokens are held before being spent.
As shown in the chart below, the total "coin days destroyed" in this cycle is 15% higher than in the 2021 cycle.
This also aligns with the characteristics of a "late-stage cycle."
[Coin Days Destroyed Data Chart]
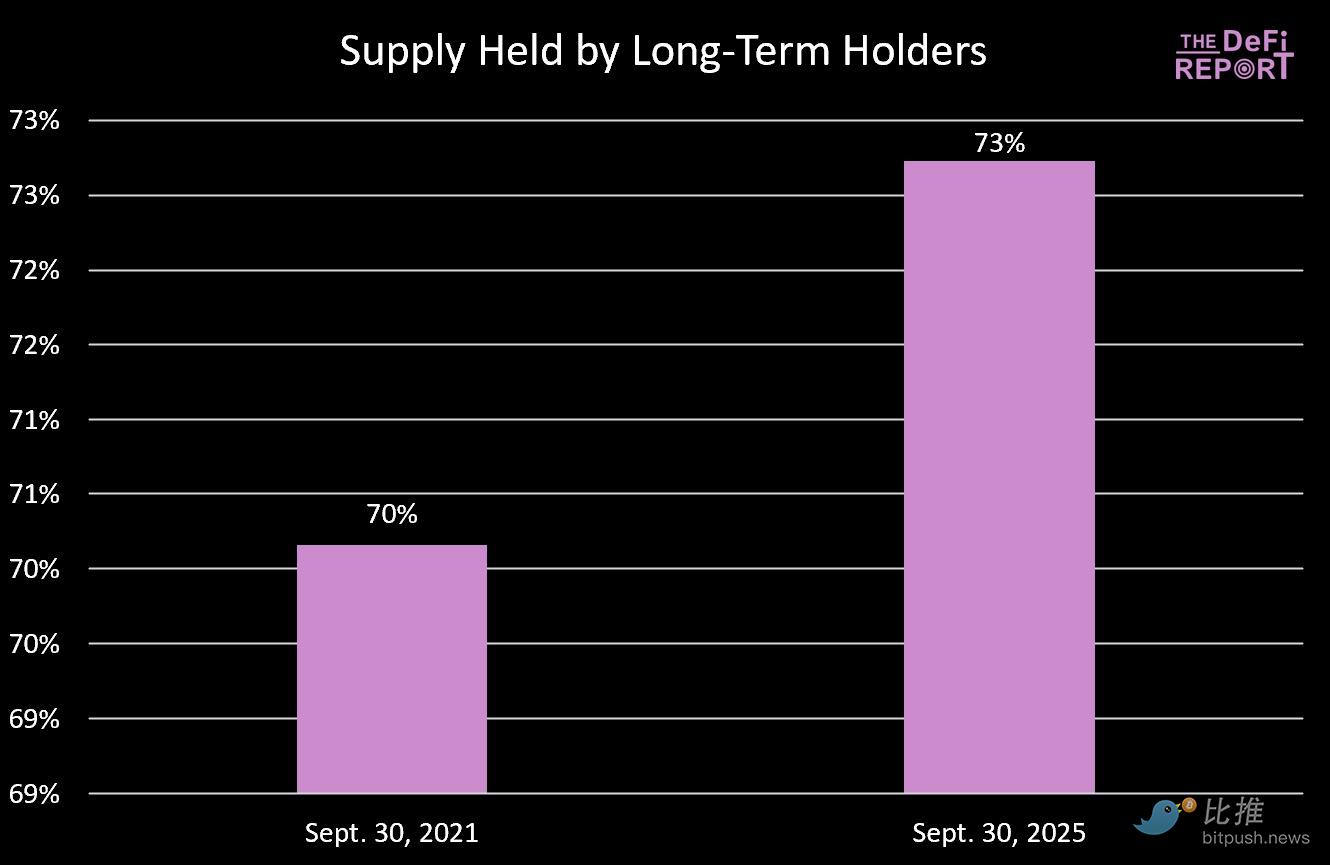
Long-Term Holder Supply
The behavioral pattern of long-term holders in this cycle is similar to the previous cycle.
Between October 2020 and March 2021, long-term holder supply dropped by 13.5% (corresponding to the first price peak in April 2021). Afterwards, LT holder supply rebounded and continued to rise for the remainder of the cycle.
Similarly, from December 2023 to February 2025, long-term holder supply dropped by 12.4%, then rebounded to the current level of 73%.
Conclusion: Long-term holders tend to distribute tokens to new capital entering the market. In the 2021 cycle, this occurred during the first price peak in April 2021.
In the current cycle, this happened in the fourth quarter of last year and continued into the first quarter of this year.
If we expect an explosive fourth quarter, we need to see new capital flowing into the market—something we did not see during the same period in the previous cycle.
[Long-Term Holder Supply Data Chart]
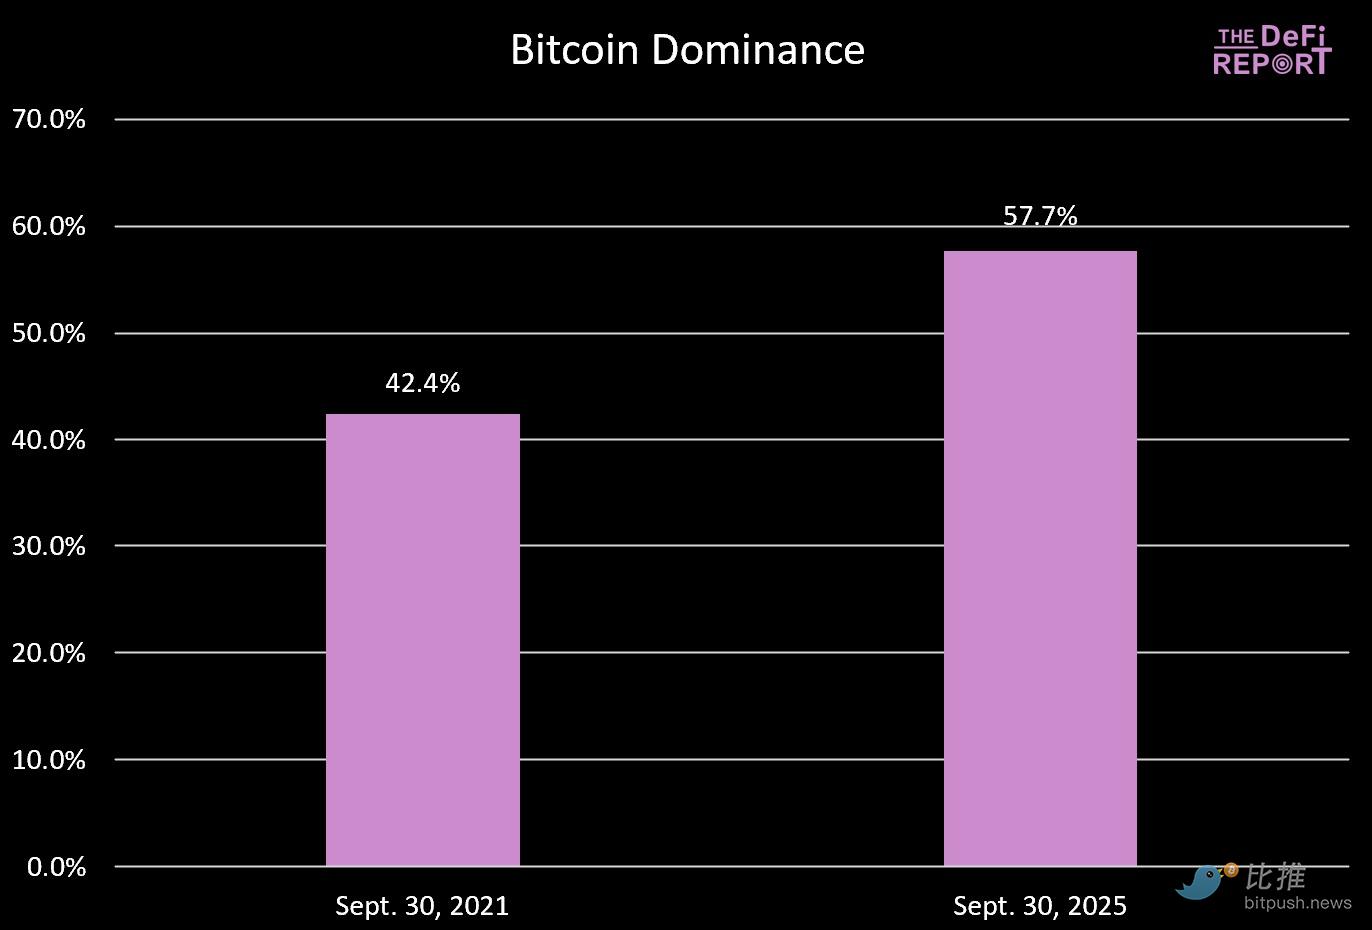
Bitcoin Dominance
In the past two cycles, the market peaked when bitcoin dominance fell to around 40%.
In this cycle, we are far from that level. We believe there are several reasons:
- The financialization of BTC through ETFs and institutional participation in this cycle
- The maturity of the cryptocurrency market. In the previous cycle, except for Ethereum, every L1 was a "shiny new toy" for investors to speculate on. Additionally, NFT and DeFi were still in their early stages—investors may have severely overestimated their maturity, use cases, and sustainability. Today, the market is more mature.
- The 2021 cycle saw massive fiscal and monetary policy support due to COVID, a situation unlikely to repeat. When altcoins vastly outperform BTC, there is little incentive to hold BTC. Today, asset selection is crucial.
We still believe BTC dominance will decline further, but not to the levels seen in the past.
[Bitcoin Dominance Data Chart]
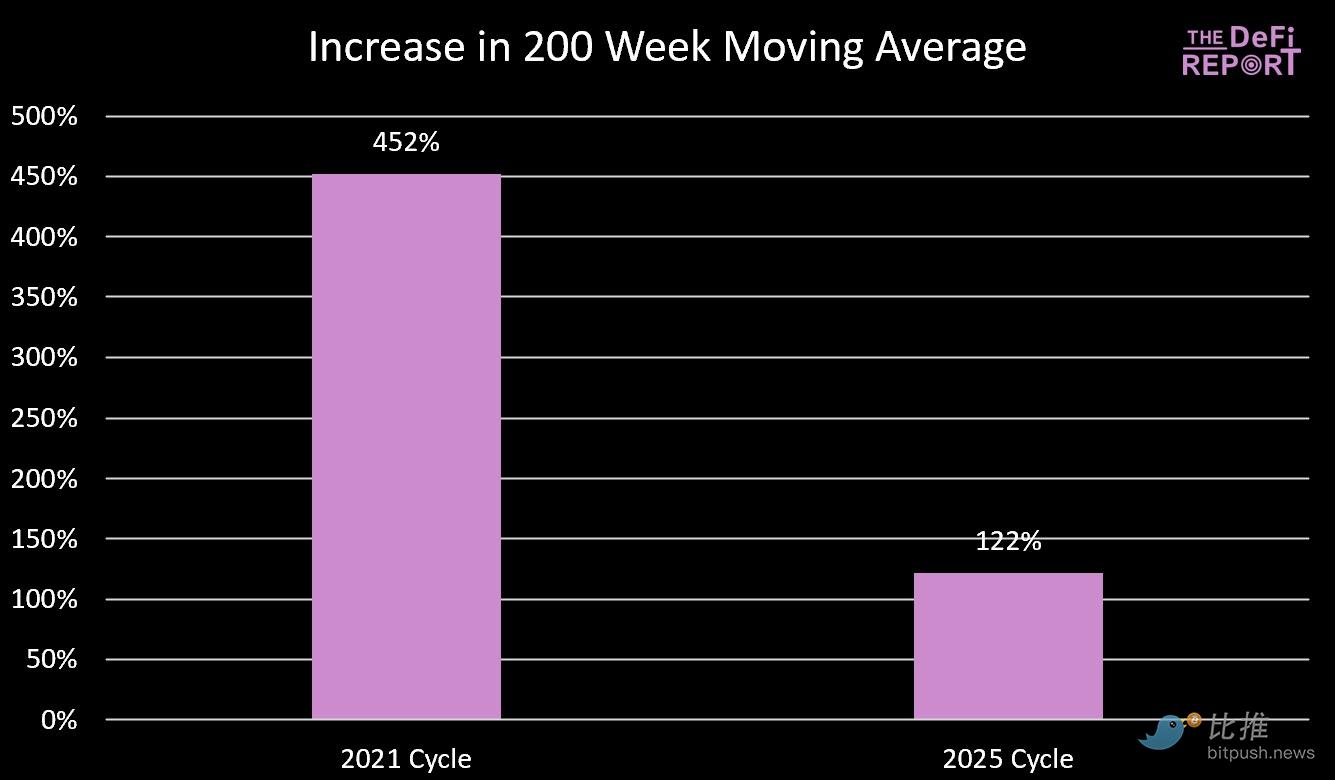
200-Week Moving Average
We closely monitor the 200-week moving average for two reasons:
- In bear markets, bitcoin often drops to its 200-week moving average;
- In the past two cycles, bitcoin peaked when the 200-week moving average converged with the previous cycle’s high;
The current 200-week moving average is $53,100.
Will we eventually drop to $66,000 (the previous cycle’s high) this year?
It’s unlikely, because our estimates show that even with a 40% surge in the coming months, the 200-week moving average will be in the $57,000 range. Of course, if the cycle extends into next year, returning to those levels is possible.
Conclusion: As the cycle progresses, the law of diminishing returns is becoming apparent, as shown in the chart below.
[200-Week Moving Average Data Chart]
Realized Price and MVRV-Z Score
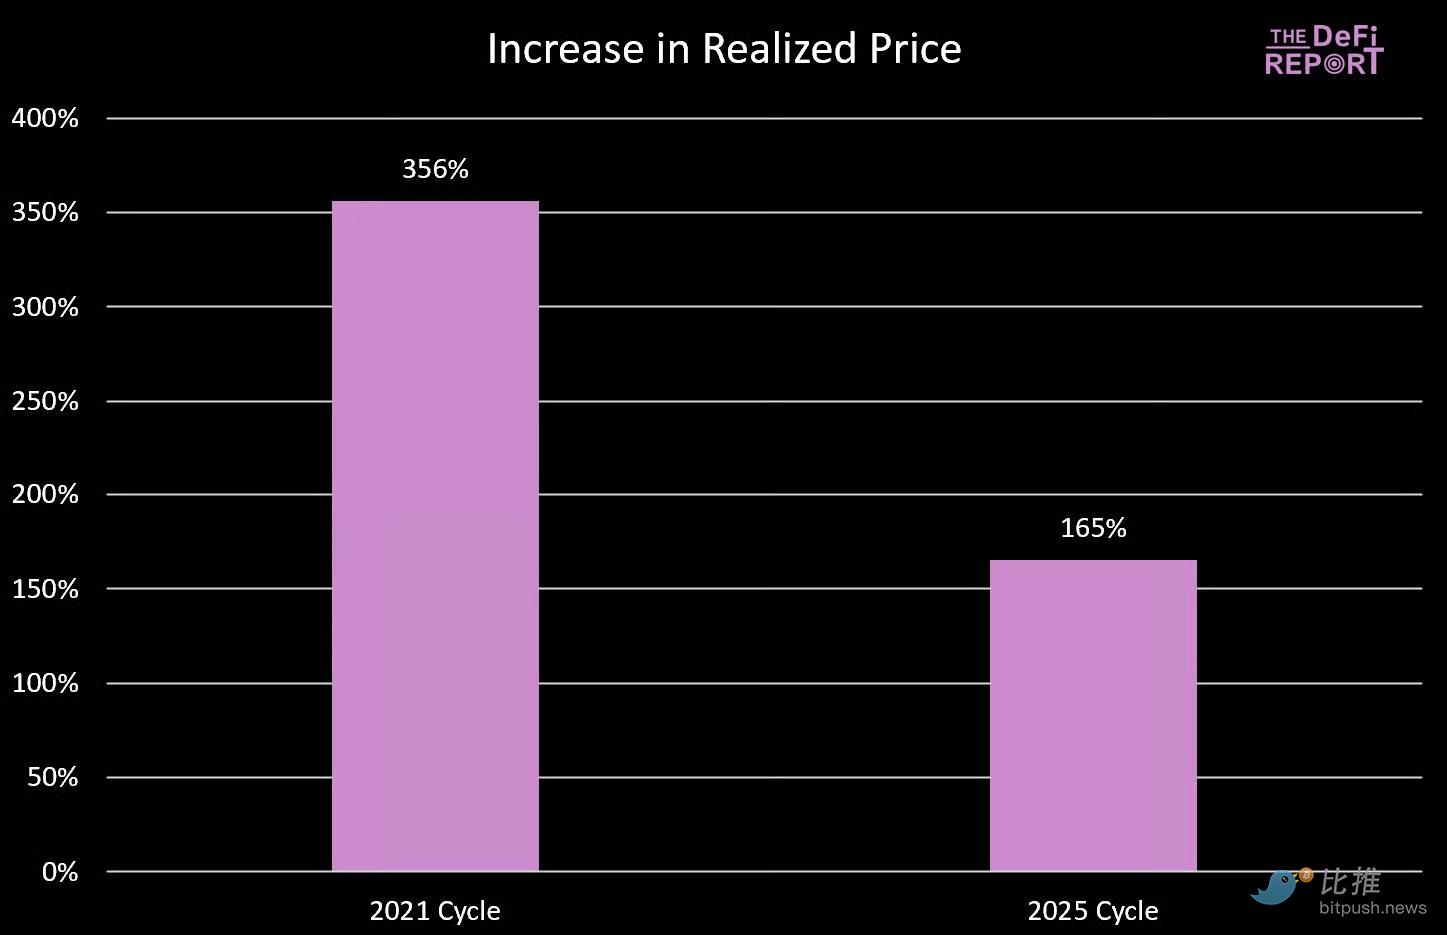
Realized Price
According to Glassnode data, bitcoin’s realized price (representing the cost basis of all coins on the network) is currently $53,800.
Similar to the 200-week moving average, bitcoin tends to revert to its realized price during bear markets, and cycles typically peak when the realized price reaches the previous cycle’s high.
Like the 200-week moving average, we do not expect this indicator to reach the previous cycle’s high this year—further highlighting the law of diminishing returns.
[Realized Price Data Chart]
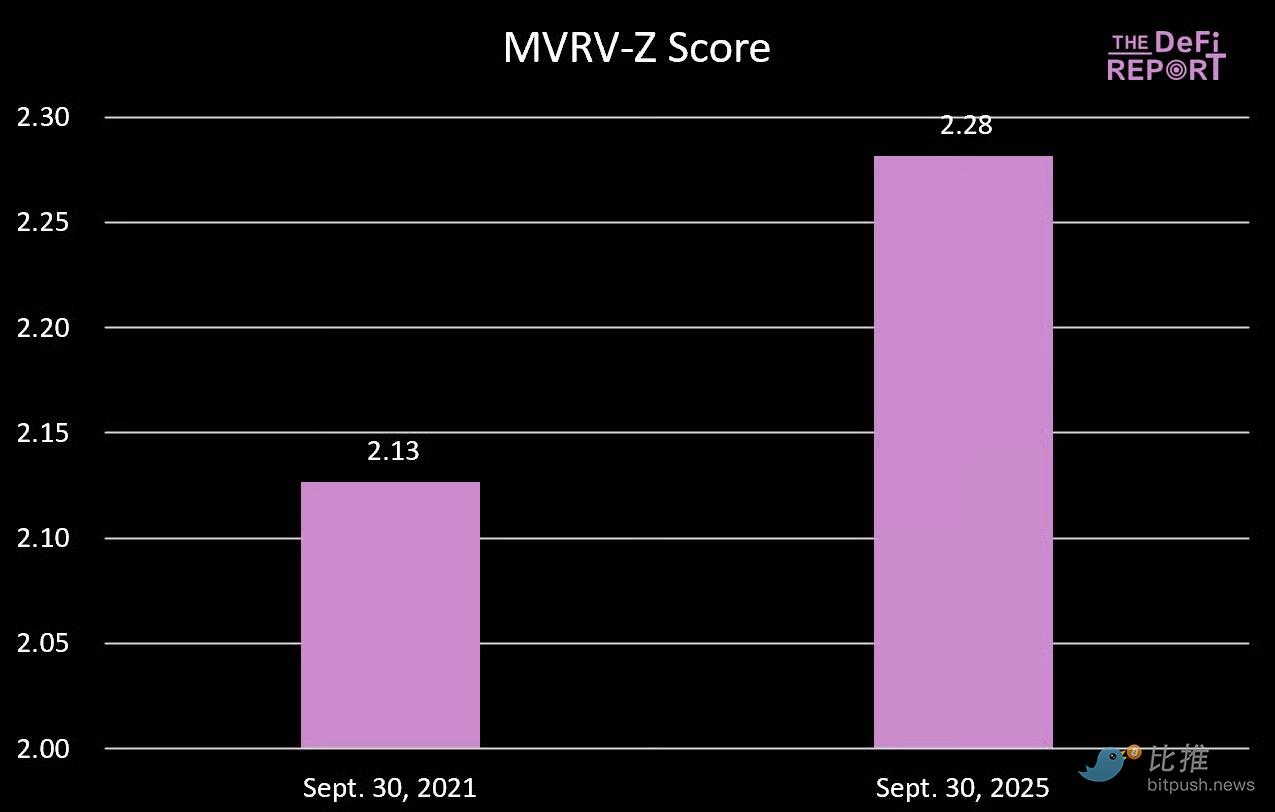
MVRV-Z Score
The MVRV-Z score measures how "stretched" bitcoin’s market cap is relative to its realized value using a z-score, adjusted for historical volatility.
The current reading of 2.28 suggests that bitcoin’s market cap is about 2.28 standard deviations above its cost basis compared to historical norms.
Interestingly, we are now at a higher level than the same period in the 2021 cycle. At that time, bitcoin surged about 50% in October/November, ending the cycle with an MVRV-Z score of 3.49.
If this cycle’s indicator approaches 3, BTC price could reach the $160,000 to $170,000 range (a 40-50% increase).
[MVRV-Z Score Data Chart]
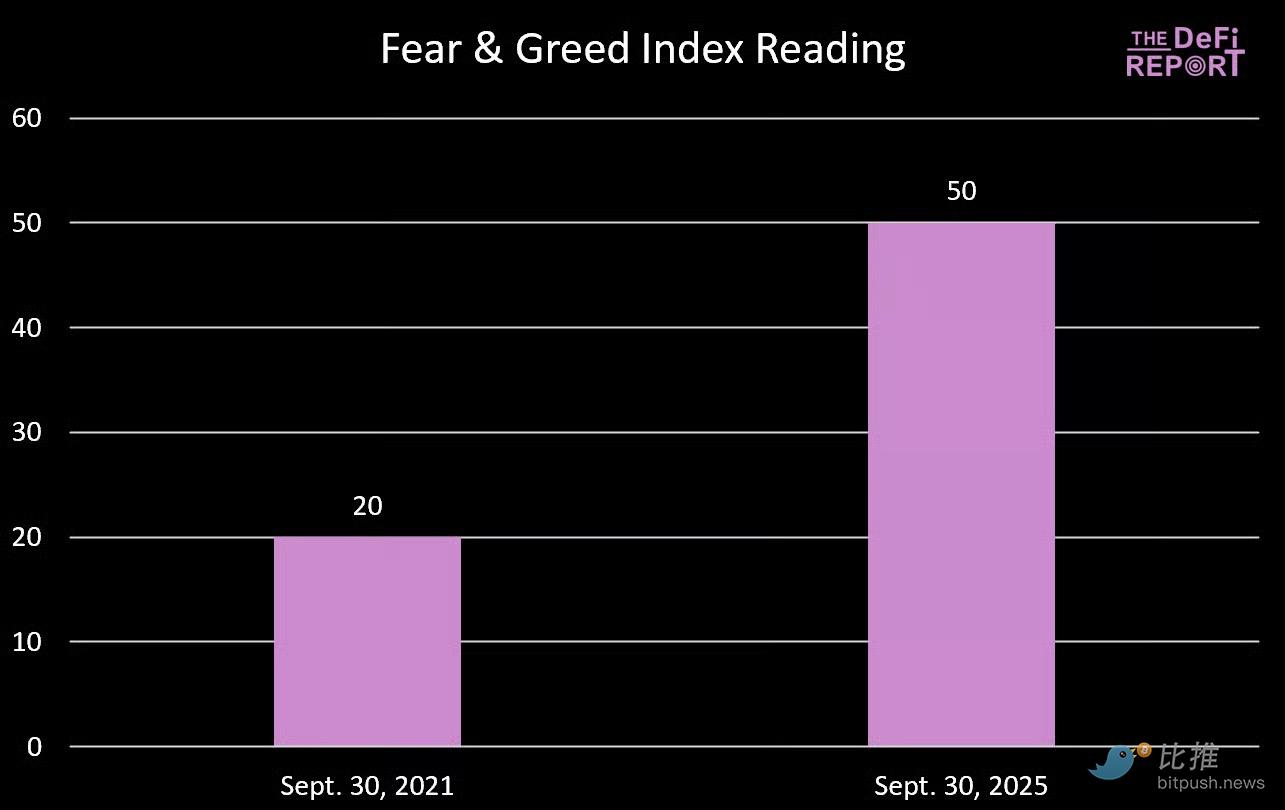
Fear and Greed Index
[Fear and Greed Index Data Chart]
If you think the current market is tense and uneasy, the market was even more panicked during the same period in 2021. In fact, in September 2021, we were in a state of extreme fear. At that time, BTC had just pulled back 20%, dropping to $43,000, then surged to the $66,000 top over the next five weeks (a 53% increase).
Summary and Outlook
There is no rule that requires bitcoin to follow the "four-year cycle" path we have historically observed.
But after carefully studying the data, it’s hard to deny the possibility of a fourth-quarter peak.
Why?
We believe there are several reasons why the "four-year cycle" framework persists:
- Narrative anchoring. Investors expect a "post-halving bull market," which influences investor positioning, marketing cycles of crypto-native companies, and media coverage. Reflexivity makes this pattern self-fulfilling.
- Liquidity and credit cycles. The halving cycle has historically coincided with global debt refinancing cycles, amplifying the liquidity needed for a crypto bull market.
- The mechanism of the four-year halving cycle and its impact on miner operations, with supply tightening just as demand tends to return to the market.
- Product/innovation cadence. Venture capital tends to fund the industry in sync with the liquidity cycle of the four-year halving. These projects take time to come to market, and new innovations and narratives emerge explosively, amplifying the crypto adoption cycle.
- Volatility. Investors expect deep bear markets in crypto to buy their favorite assets at a discount. This naturally affects profit-taking and forms a self-reinforcing feedback loop.
Based on the observed data and the deeply rooted qualitative/behavioral factors, our base case is that BTC will peak again in the fourth quarter.
Disclaimer: The content of this article solely reflects the author's opinion and does not represent the platform in any capacity. This article is not intended to serve as a reference for making investment decisions.
You may also like
COC the Game Changer: When Everything in GameFi Becomes "Verifiable", the Era of P2E 3.0 Begins
The article analyzes the development of the GameFi sector from Axie Infinity to Telegram games, pointing out that Play to Earn 1.0 failed due to the collapse of its economic model and trust issues, while Play for Airdrop was short-lived because it could not retain users. COC Game has introduced the VWA mechanism, which verifies key data on-chain in an attempt to address trust issues and build a sustainable economic model. Summary generated by Mars AI. This summary was generated by the Mars AI model, and its accuracy and completeness are still being iteratively updated.

BTC Volatility Weekly Review (November 17 - December 1)
Key metrics (from 4:00 PM HKT on November 17 to 4:00 PM HKT on December 1): BTC/USD: -9.6% (...

When all GameFi tokens have dropped out of the TOP 100, can COC reignite the narrative with a Bitcoin economic model?
On November 27, $COC mining will be launched. The opportunity to mine the first block won't wait for anyone.
Ethereum's Next Decade: From "Verifiable Computer" to "Internet Property Rights"
Fede, the founder of LambdaClass, provides an in-depth explanation of anti-fragility, the 1 Gigagas scaling goal, and the vision for Lean Ethereum.