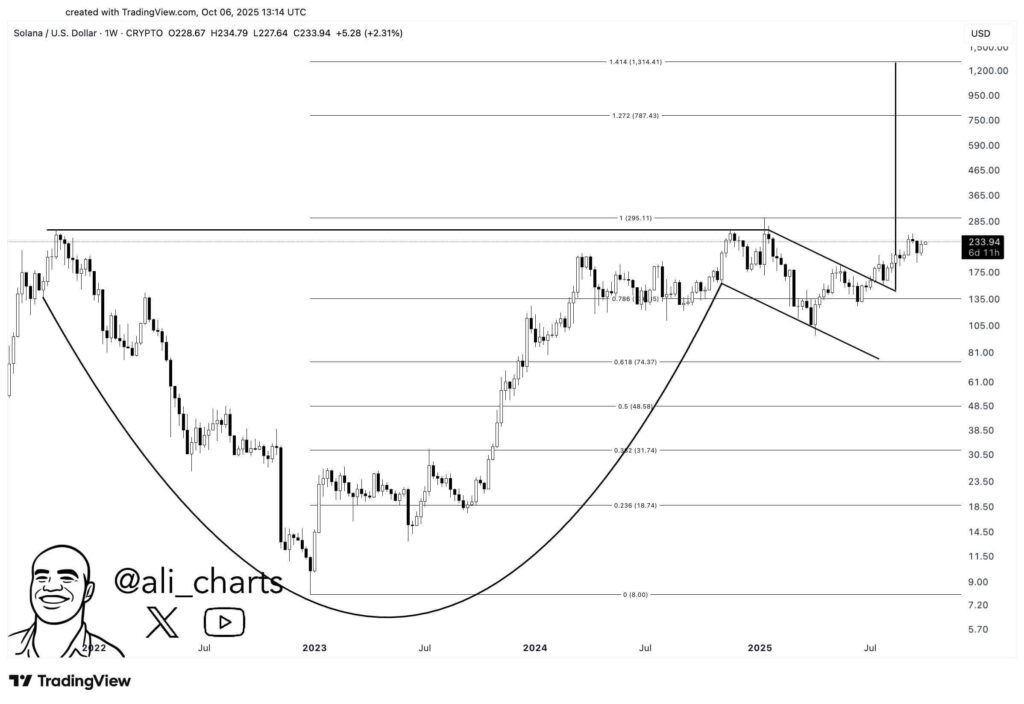
Solana breakout may target $1,300 if SOL sustains support above $175; Fibonacci extensions show resistance near $787 and $1,314, while expanding staking and ETF optimism reinforce institutional confidence in the rally.
-
Analysts flag a cup-and-handle breakout for Solana with a $1,300 target if momentum holds above $175.
-
Fibonacci extensions identify resistance near $787 and $1,314, matching steady accumulation since 2023.
-
Institutional signals — a new validator from Forward Industries and near-certain ETF approval odds — support broader Layer‑1 inflows.
Solana breakout: cup-and-handle price target $1,300 if SOL stays above $175; learn the technical levels and staking catalysts.
What is the Solana breakout scenario and its price target?
Solana breakout refers to SOL exiting a long-term cup-and-handle formation that analysts say could project prices toward $1,300 if daily support holds above $175. The pattern, supported by Fibonacci extensions and increasing staking activity, signals renewed bullish momentum across the Layer‑1 market.
How does the cup-and-handle pattern translate to a $1,300 target?
The cup-and-handle measures the depth and width of the base and projects the breakout distance from the handle. Measured objectively, the formation — built over nearly three years — aligns with Fibonacci extension targets at 1.272 and 1.414, near $787 and $1,314 respectively.
Frequently Asked Questions
What are the key Fibonacci levels to watch for SOL?
Primary retracement levels previously respected include 0.236 ($18.74), 0.382 ($31.74), 0.5 ($48.58), 0.618 ($74.37) and 0.786 ($147.37). Extension targets of 1.272 ($787.43) and 1.414 ($1,314.41) are the immediate resistance zones if momentum continues.
How important is $175 as support for the breakout?
Maintaining support above $175 is critical because it validates the handle breakout on daily timeframes. A confirmed hold increases the probability of reaching intermediate targets near $296 and extension zones beyond $700.
Analysts foresee Solana’s breakout from a long term cup and handle pattern, targeting up to $1,300 amid strong market momentum.
- Analyst notes Solana’s cup-and-handle breakout could push prices toward $1,300 if momentum sustains above $175.
- Fibonacci extensions identify resistance near $787 and $1,314, aligning with steady investor accumulation since 2023.
- Forward Industries’ new Solana validator and ETF optimism boost institutional confidence in Solana’s ongoing rally.
Solana’s price structure has attracted attention after a long-term technical setup signaled a potential major breakout. Analyst Ali stated that “Solana $SOL looks like it’s breaking out of a cup and handle. If confirmed, the pattern points to $1,300.”
The formation developed over nearly three years and reflects a steady recovery from 2022–2023 lows near $8.00. The climb retraced several key Fibonacci levels and showed disciplined accumulation through multiple cycles.
Why does the long-term structure support a breakout?
Data shows the cup began forming after a deep correction from 2021 peaks and bottomed near $8.00 in early 2023. The pattern’s symmetry and the subsequent handle consolidation between $135 and $175 provide a classic breakout setup when price breaks higher on volume.
Source: Ali on X
The recovery extended through the 0.5, 0.618 and 0.786 retracement zones, topping near $296.11 at the 1.0 Fibonacci mark. The handle formed as a range-bound pullback between $175 and $135 before the recent bullish breakout in daily candles.
How do staking and institutional moves affect Solana’s momentum?
Nasdaq-listed Forward Industries launched a Solana validator and staked its SOL, opening delegation to the public. This increase in staking activity, combined with near‑certain spot ETF approval odds for SOL, elevates institutional confidence and reduces circulating supply risks.
Analyst James commented on X that the setup is “one of the most bullish things you will see,” noting potential FOMO-driven inflows as traders reposition for higher targets.
Comparison Table: Key Technical Levels
| Support (handle) | — | $135–$175 |
| Retracement 0.618 | 0.618 | $74.37 |
| Intermediate peak | 1.0 | $296.11 |
| Extension 1.272 | 1.272 | $787.43 |
| Extension 1.414 (target) | 1.414 | $1,314.41 |
How to interpret the breakout (step-by-step)?
- Confirm daily close above $175 with increased volume.
- Track pullbacks to new support; maintain risk controls below $135.
- Use Fibonacci extensions to set staged profit targets at $787 and $1,314.
Key Takeaways
- Pattern: A multi-year cup-and-handle points to a possible $1,300 projection.
- Technical levels: Watch $175 support, $296 intermediate, and $787–$1,314 extensions.
- Catalysts: Forward Industries’ validator launch and spot ETF optimism strengthen institutional demand signals.
Conclusion
This technical read on the Solana breakout combines classic pattern measurement with Fibonacci extensions and on-chain staking developments. If SOL holds critical support above $175 and institutional demand persists, the technical roadmap supports higher targets—traders should manage risk and monitor volume-confirmed closes for validation.