XRP Price Struggles at $3.04 as Resistance Near $3.20 Holds Ahead of 2025 Targets

- XRP is trading at $3.04 and has a market cap of 181.61B with a resistance at the $3.20 mark.
- According to technical indicators, the momentum is weak, and the RSI stands at 41.84 and MACD negative on the most important metrics.
- Projections over the long run have revealed the possible shift towards 4.50-6.50 by 2025, but short-term pressure still exists.
Over the past few days, XRP has been volatile as it trades around the price of $3.04 following a 3.09% decline move according to Coinmarketcap. The market capitalization of the token is 181.61 billion, which ranks it as the third largest cryptocurrency.
Source: CoinMarketCap
The volume has significantly decreased with the 24-hour trading standing at $4.91 billion, equivalent to a sharp decline of 24.93%. This has changed as the circulating supply still stands at 59.61 billion XRP, whereas the cumulative supply is 100 billion. Price movement has been plagued by resistance at the present, with technical indicators projected to create volatility in the future.
Resistance Levels Signal Challenges
Historical chart structures show XRP testing long-term resistance zones between 2024 and 2025. The price movement of the token shows recurring rejection around the region of 3, and further rejection could take place within $4.50 to $6.50.
The next #XRP pump will blow your eyes out! pic.twitter.com/0gaK42tY7c
— STEPH IS CRYPTO (@Steph_iscrypto) September 14, 2025
This trend is in line with the trend of Bitcoin that has remained strong as well as recording higher highs till 2025. Nevertheless, failure to climb above the $3.20 level has caused the short-term sentiment to be anxious especially with the daily sell pressure accumulating.
Technical Indicators Show Weak Momentum
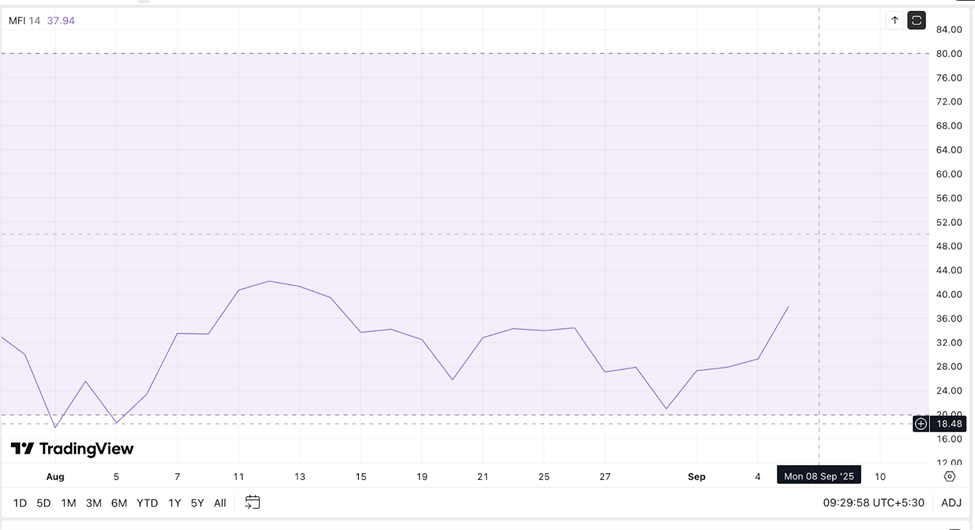
The Relative Strength Index (RSI) currently reads 41.84, moving closer to oversold territory but not fully signaling exhaustion. Earlier lows at 28.27 reflected stronger downward pressure, though minor recoveries were visible.
Source: TradingView
In the meantime, the Moving Average Convergence Divergence (MACD) indicates further weakness, indicating the line values of -423.1M and -471.73M as compared to the histogram of -894.83M. These signs point to the fact that the buying momentum is still restrained, despite the support levels trying to settle at the level of $3.00.
Market Trends Remain Critical for Outlook
The broader market environment continues to shape XRP’s movement, with volume-to-market cap ratio at 2.75% showing reduced participation. According to historical forecasts, the annual trend may increase to the 6 range in the long run, but there is pressure on current trends.
It is worth noting that the current weakness would be stretched in case of sustained consolidation below $3.20 and any break above resistance would be in line with previous highs in 2021. As the two Bitcoin and XRP approach crucial areas, the actions of the market in the next few sessions will continue to be critical towards its direction.
Disclaimer: The content of this article solely reflects the author's opinion and does not represent the platform in any capacity. This article is not intended to serve as a reference for making investment decisions.
You may also like
ETFs are being launched in clusters, but coin prices are falling. Can ETF approval still be considered good news?
On one hand, Vanguard has opened Bitcoin ETF trading, while on the other hand, CoinShares has withdrawn its applications for XRP, Solana Staking, and Litecoin ETFs, highlighting a significant divergence in institutional attitudes toward ETFs for different cryptocurrencies.

ADP employment data "unexpectedly weak", is a Federal Reserve rate cut imminent?
Glassnode Report: Current Structure Strikingly Similar to Pre-Crash 2022, Beware of a Key Range!

Coinglass report interprets Bitcoin's "life-or-death line": 96K becomes the battleground between bulls and bears—Is the ETF capital withdrawal an opportunity or a trap?
Bitcoin's price remains stable above the real market mean, but the market structure is similar to Q1 2022, with 25% of supply currently at a loss. The key support range is between $96.1K and $106K; breaking below this range will increase downside risk. ETF capital flows are negative, demand in both spot and derivatives markets is weakening, and volatility in the options market is underestimated. Summary generated by Mars AI. The accuracy and completeness of this summary are still being iteratively updated by the Mars AI model.