Shiba Inu price is stalled at the critical $0.000013 support, consolidating inside a symmetrical triangle. A successful hold can fuel a breakout toward $0.0000145–$0.000016, while a decisive break below $0.000013 risks a fall to $0.0000120 or lower, shifting market bias bearish.
-
Key point 1 – SHIB sits at $0.000013 support, a technical pivot for bulls and bears.
-
Key point 2 – Daily RSI ~51 shows neutral momentum; volume decline signals trader caution.
-
Key point 3 – Failure below $0.000013 targets $0.0000120 and $0.0000100 as next floors.
Shiba Inu price at $0.000013 is critical — watch support for a breakout or breakdown. Read analysis and next steps. Stay informed with COINOTAG.
What is the current Shiba Inu price outlook?
Shiba Inu price is consolidating at roughly $0.000013 inside a symmetrical triangle, with stacked 50-, 100-, and 200-day EMAs acting as near-term resistance and support. The immediate outlook hinges on whether $0.000013 holds (bullish continuation) or breaks (bearish decline).
How is SHIB interacting with key moving averages?
The daily chart shows SHIB repeatedly failing to sustain momentum above the 200-day EMA, which acted as resistance through early 2025. Recent attempts peaked near $0.000015 before rejection. The 100-day EMA (~$0.0000127) and the 50-day EMA (~$0.0000129) cluster close to $0.000013, forming a concentrated support zone.
These stacked EMAs make the $0.000013 area technically significant. If buyers defend it, SHIB can stay within the triangle and attempt another breakout. If sellers breach it, the moving averages offer little additional support and downside acceleration is likely.
Pricing and performance
With the price hovering around $0.000013, SHIB has effectively paused directional movement. The token has been trapped in a symmetrical triangle pattern for weeks, reflecting balance between supply and demand.
The Relative Strength Index (RSI) reads about 51, indicating neutral momentum and a lack of clear buying pressure. Meanwhile, trading volume has fallen sharply, suggesting many traders are waiting for a confirmed move before re-entering the market.
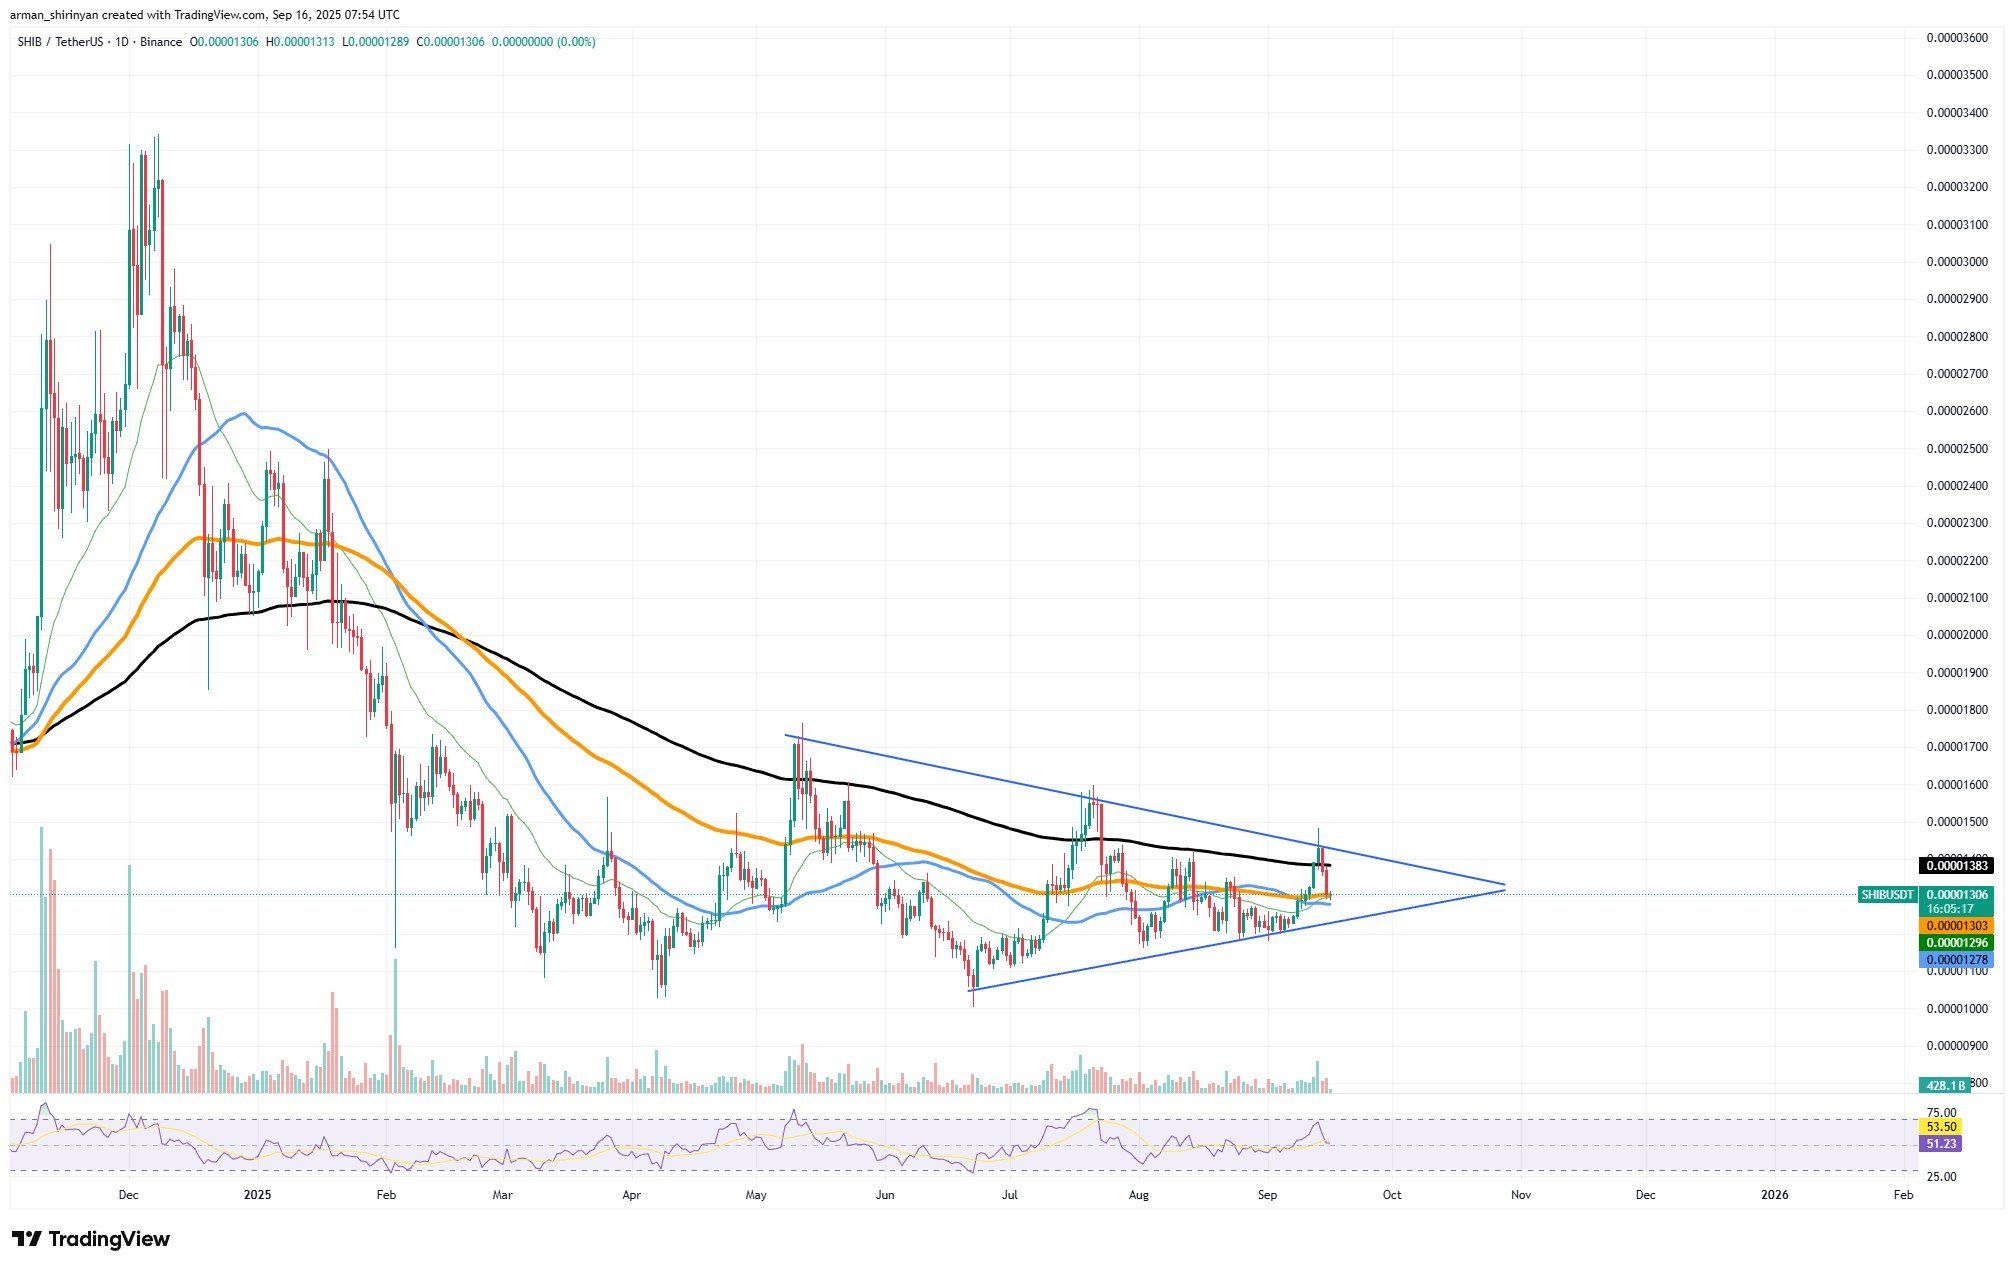
SHIB/USDT Chart by TradingView
Because the EMAs cluster near support, even small directional flows could tip the balance. Institutional-sized inflows or a surge in retail accumulation would be required for a convincing breakout above the 200-day EMA and the $0.0000145 resistance.
What to anticipate?
If $0.000013 holds, expect a bounce that preserves the symmetrical triangle and opens a path toward $0.0000145 and then $0.000016, provided accumulation continues and volume returns. A measured, volume-backed rally is required to clear long-term EMA resistance.
Conversely, if $0.000013 is breached decisively, the next target is $0.0000120. Failure to find support there could expose $0.0000100, a key psychological floor. A downward resolution would invalidate the bullish consolidation and likely shift sentiment to bearish.
Over the coming weeks, SHIB’s direction will be decided by order flow around the $0.000013 zone. Sustained weakness could erase months of gradual recovery, while successful defense could restart a patient climb higher.
How should traders respond?
- Risk management: Use tight position sizing around $0.000013 and set visible stop levels below $0.0000120.
- Confirmation: Wait for increased volume and a daily close above $0.0000145 before assuming a bullish trend.
- Watch indicators: Monitor RSI for directional bias and volume for participation.
Frequently Asked Questions
Will SHIB rebound from $0.000013?
If buyers defend $0.000013, SHIB can rebound within the triangle toward $0.0000145 and $0.000016. Expect volume-backed moves for a reliable recovery.
How fast can SHIB drop if support fails?
A decisive break below $0.000013 could accelerate the move to $0.0000120; if that fails, $0.0000100 becomes the next major psychological target, potentially occurring within weeks if selling intensifies.
Key Takeaways
- Critical support: $0.000013 is the immediate pivot for short-term direction.
- Neutral momentum: RSI ~51 and low volume indicate indecision; wait for confirmation.
- Actionable plan: Use stops below $0.0000120, and only add on volume-backed breakouts above $0.0000145.
Conclusion
Shiba Inu price faces a decisive moment around $0.000013. Clear defense of this area may allow SHIB to retest $0.0000145–$0.000016, while a breakdown risks a slide to $0.0000120 and lower. Traders should prioritize volume confirmation and strict risk management as the triangle resolves.