HBAR Price Eyes 30% Rally from Bullish Pattern — But One Key Level Must Hold

HBAR price is flashing a bullish setup with nearly 30% upside potential. But profit-taking and one critical support level could make or break the rally.
HBAR’s price has set up a textbook bullish pattern, hinting at a rally of almost 30%. But the road ahead isn’t without hurdles.
While buying strength is visible, signs of profit-taking and a crucial support level may decide whether this breakout setup plays out or fails.
Selling Pressure Builds, but Dip Buying Keeps Bulls in Play
The last three weeks have shown a clear shift in flows. During the week of August 25, HBAR’s spot outflows across exchanges totaled nearly $15.94 million, pointing to strong accumulation. By the week of September 8, that figure had dropped to just $7.51 million — a decline of over 50%.
This shows that exits had started, as signs of a downtrend mellowed, and the HBAR price traded in a range.
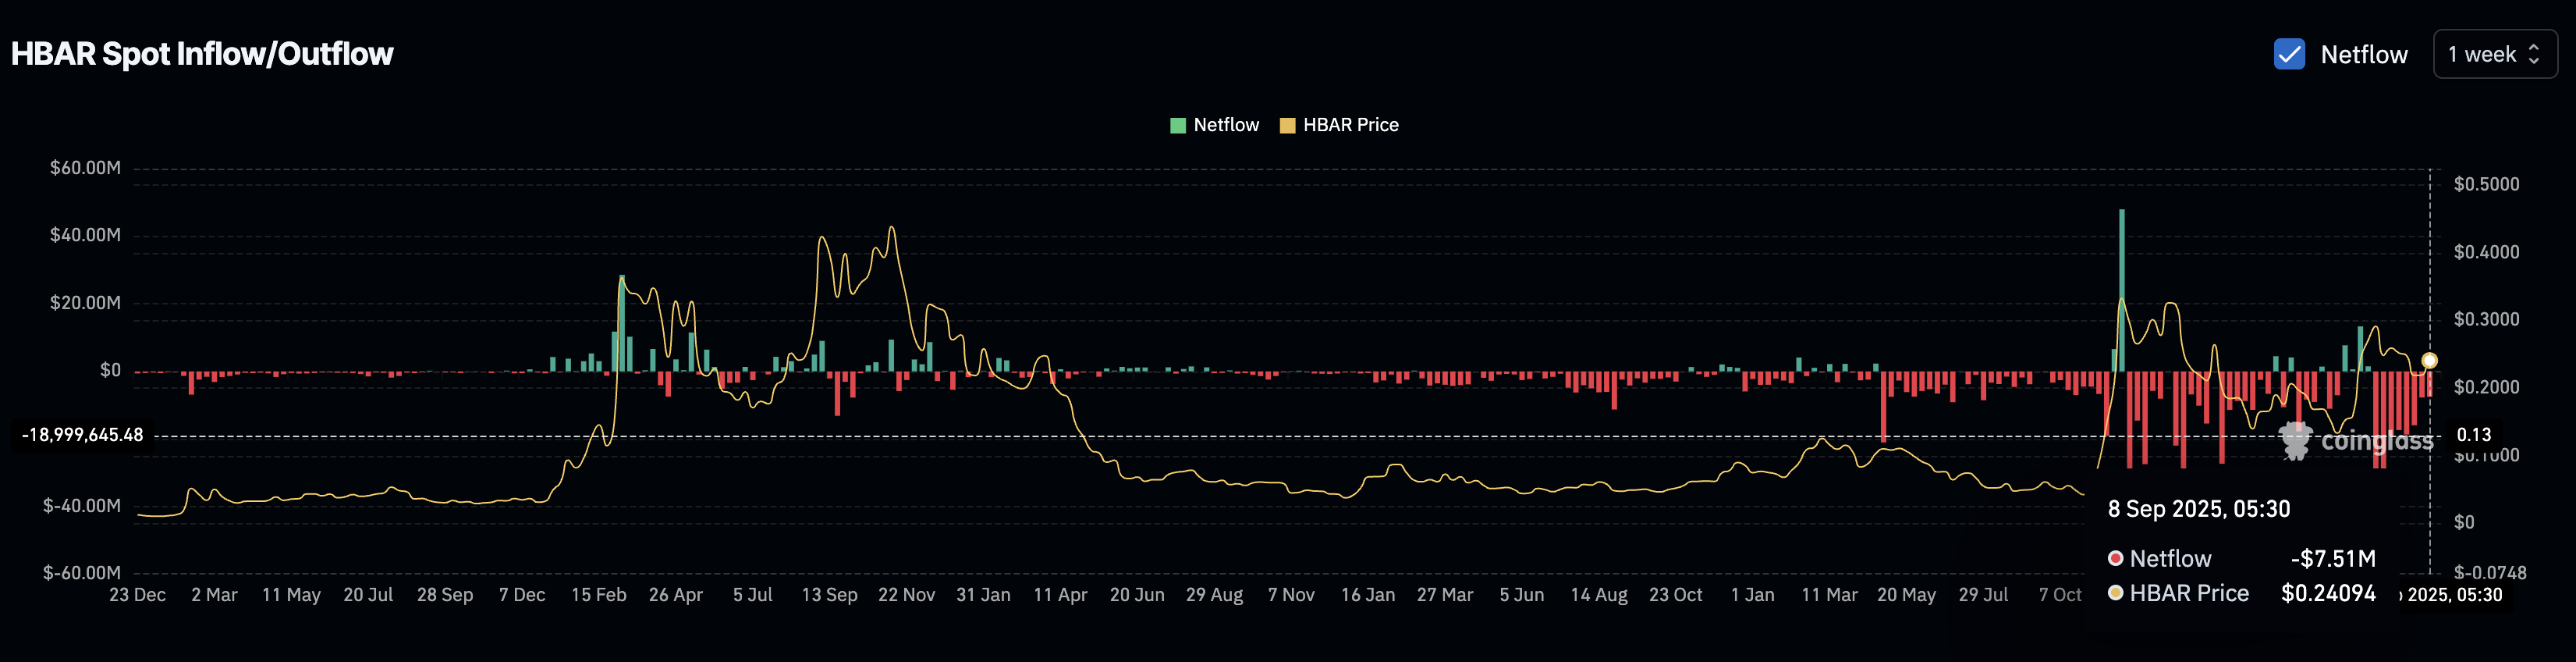 HBAR Netflows Turning Less Negative:
At the same time, the bull-bear power indicator, which tracks whether buyers or sellers have more control, shows that bulls are still ahead — but their grip has weakened. This aligns with the flow data: traders are booking profits into the price bounce — a 10% up move for the HBAR price over the past week.
Want more token insights like this? Sign up for Editor Harsh Notariya’s Daily Crypto Newsletter .
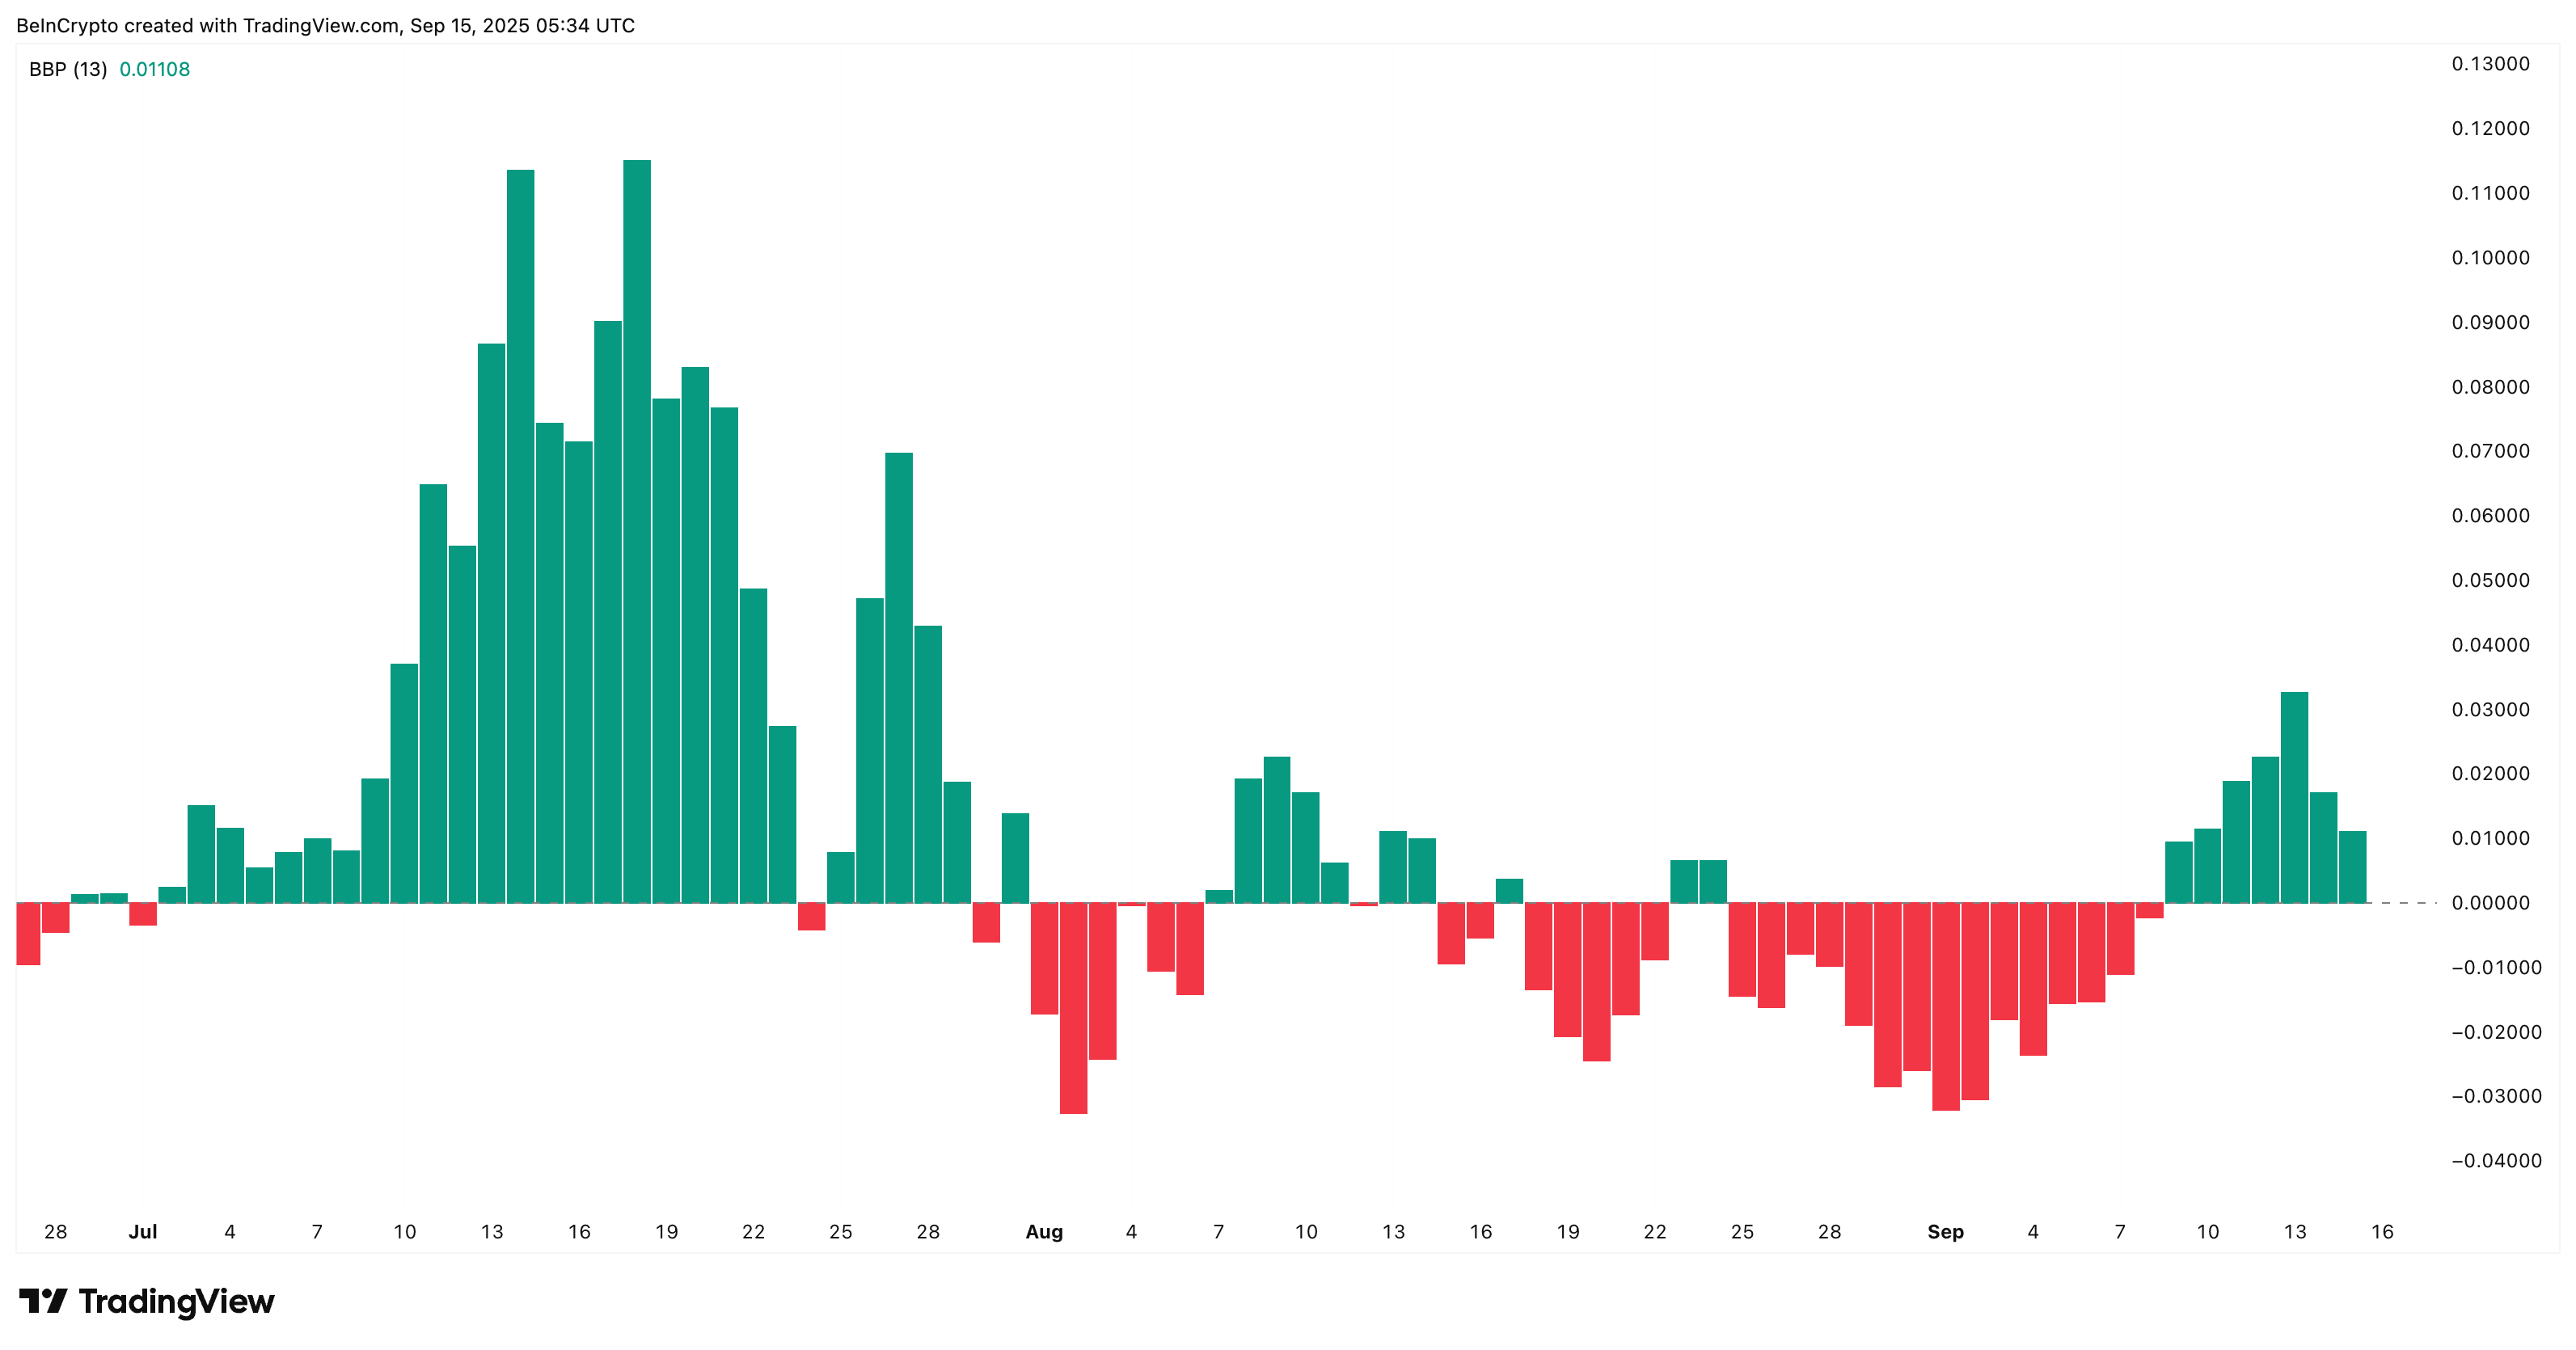 HBAR Bulls In Control:
Yet one sign is keeping the bullish case alive. The Money Flow Index (MFI), which measures buying and selling pressure by factoring in both price and volume, has been steadily rising since September 6.
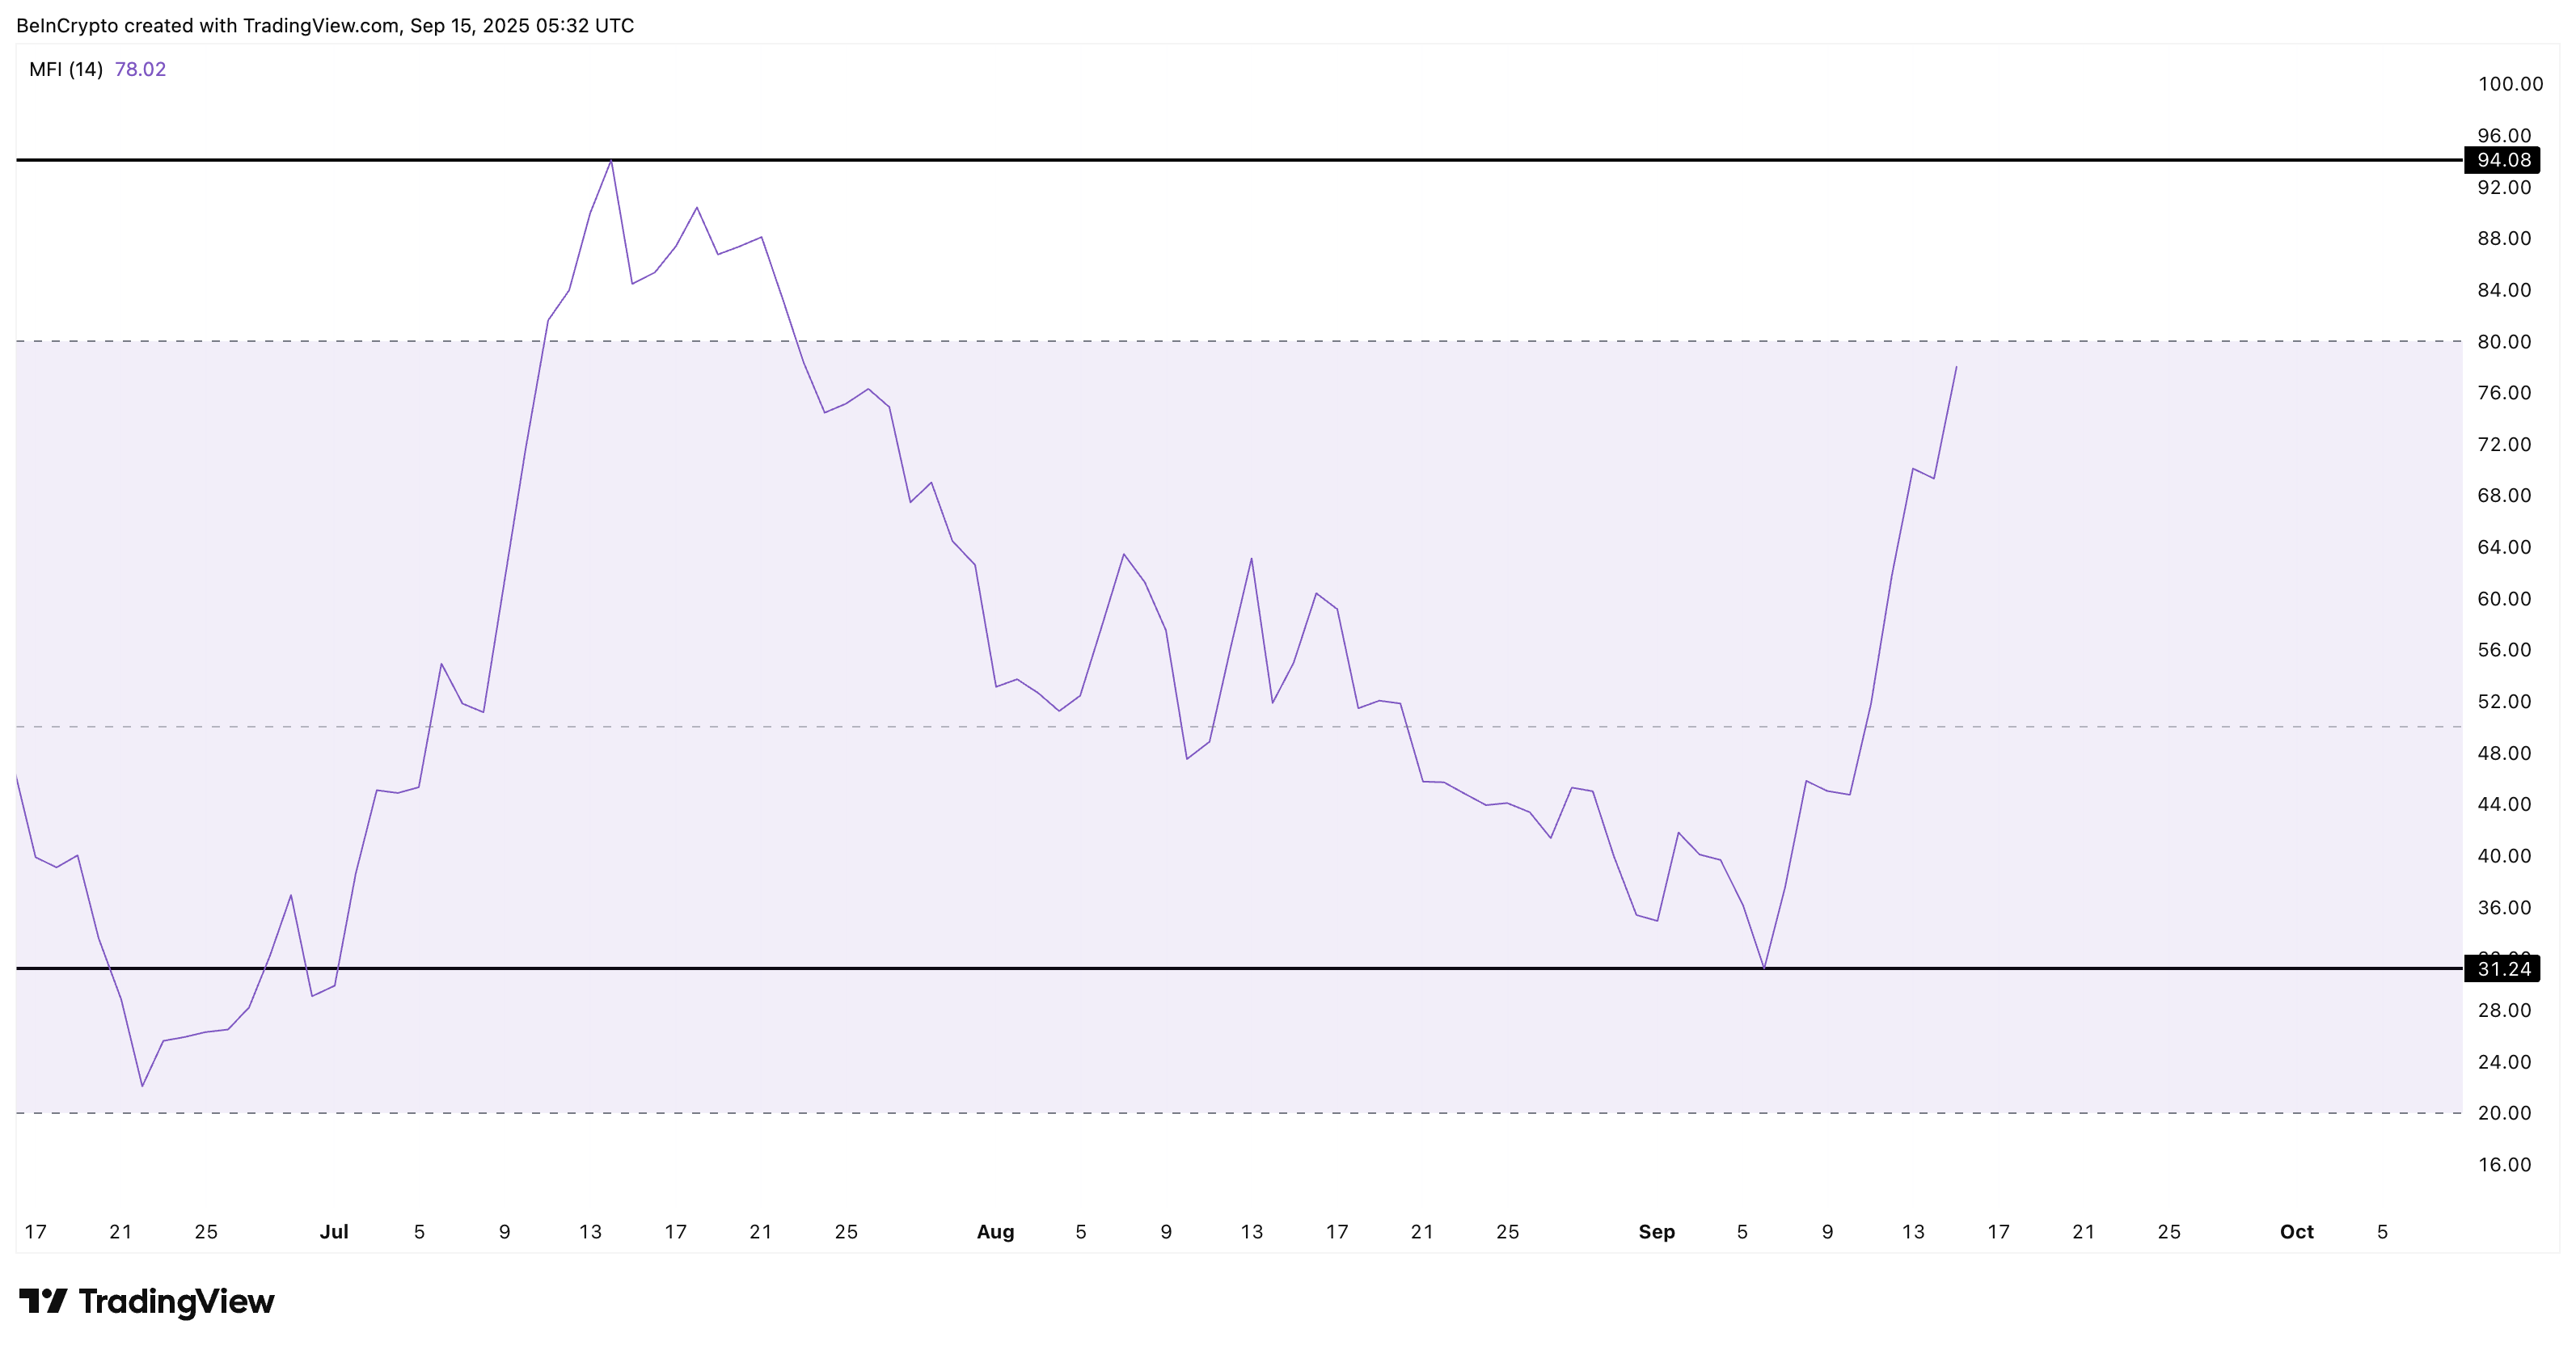 Money Flow Index Reveals HBAR Dip Buying:
Despite profit-taking, MFI moving higher means dip buyers are active. In other words, even as some traders take money off the table, others are stepping in to buy the pullbacks. This mix of selling and dip-buying sets the stage for what comes next.
Cup-and-Handle Pattern Hints at HBAR Price Breakout, but Key Level Must Hold
On the chart, HBAR is shaping a cup-and-handle pattern, a bullish setup that often signals broader trend continuation, which still leans bullish for Hedera Hashgraph (HBAR), charting almost 380% year-on-year gains. The handle is forming around $0.243, and short-term dips toward $0.238 remain within range.
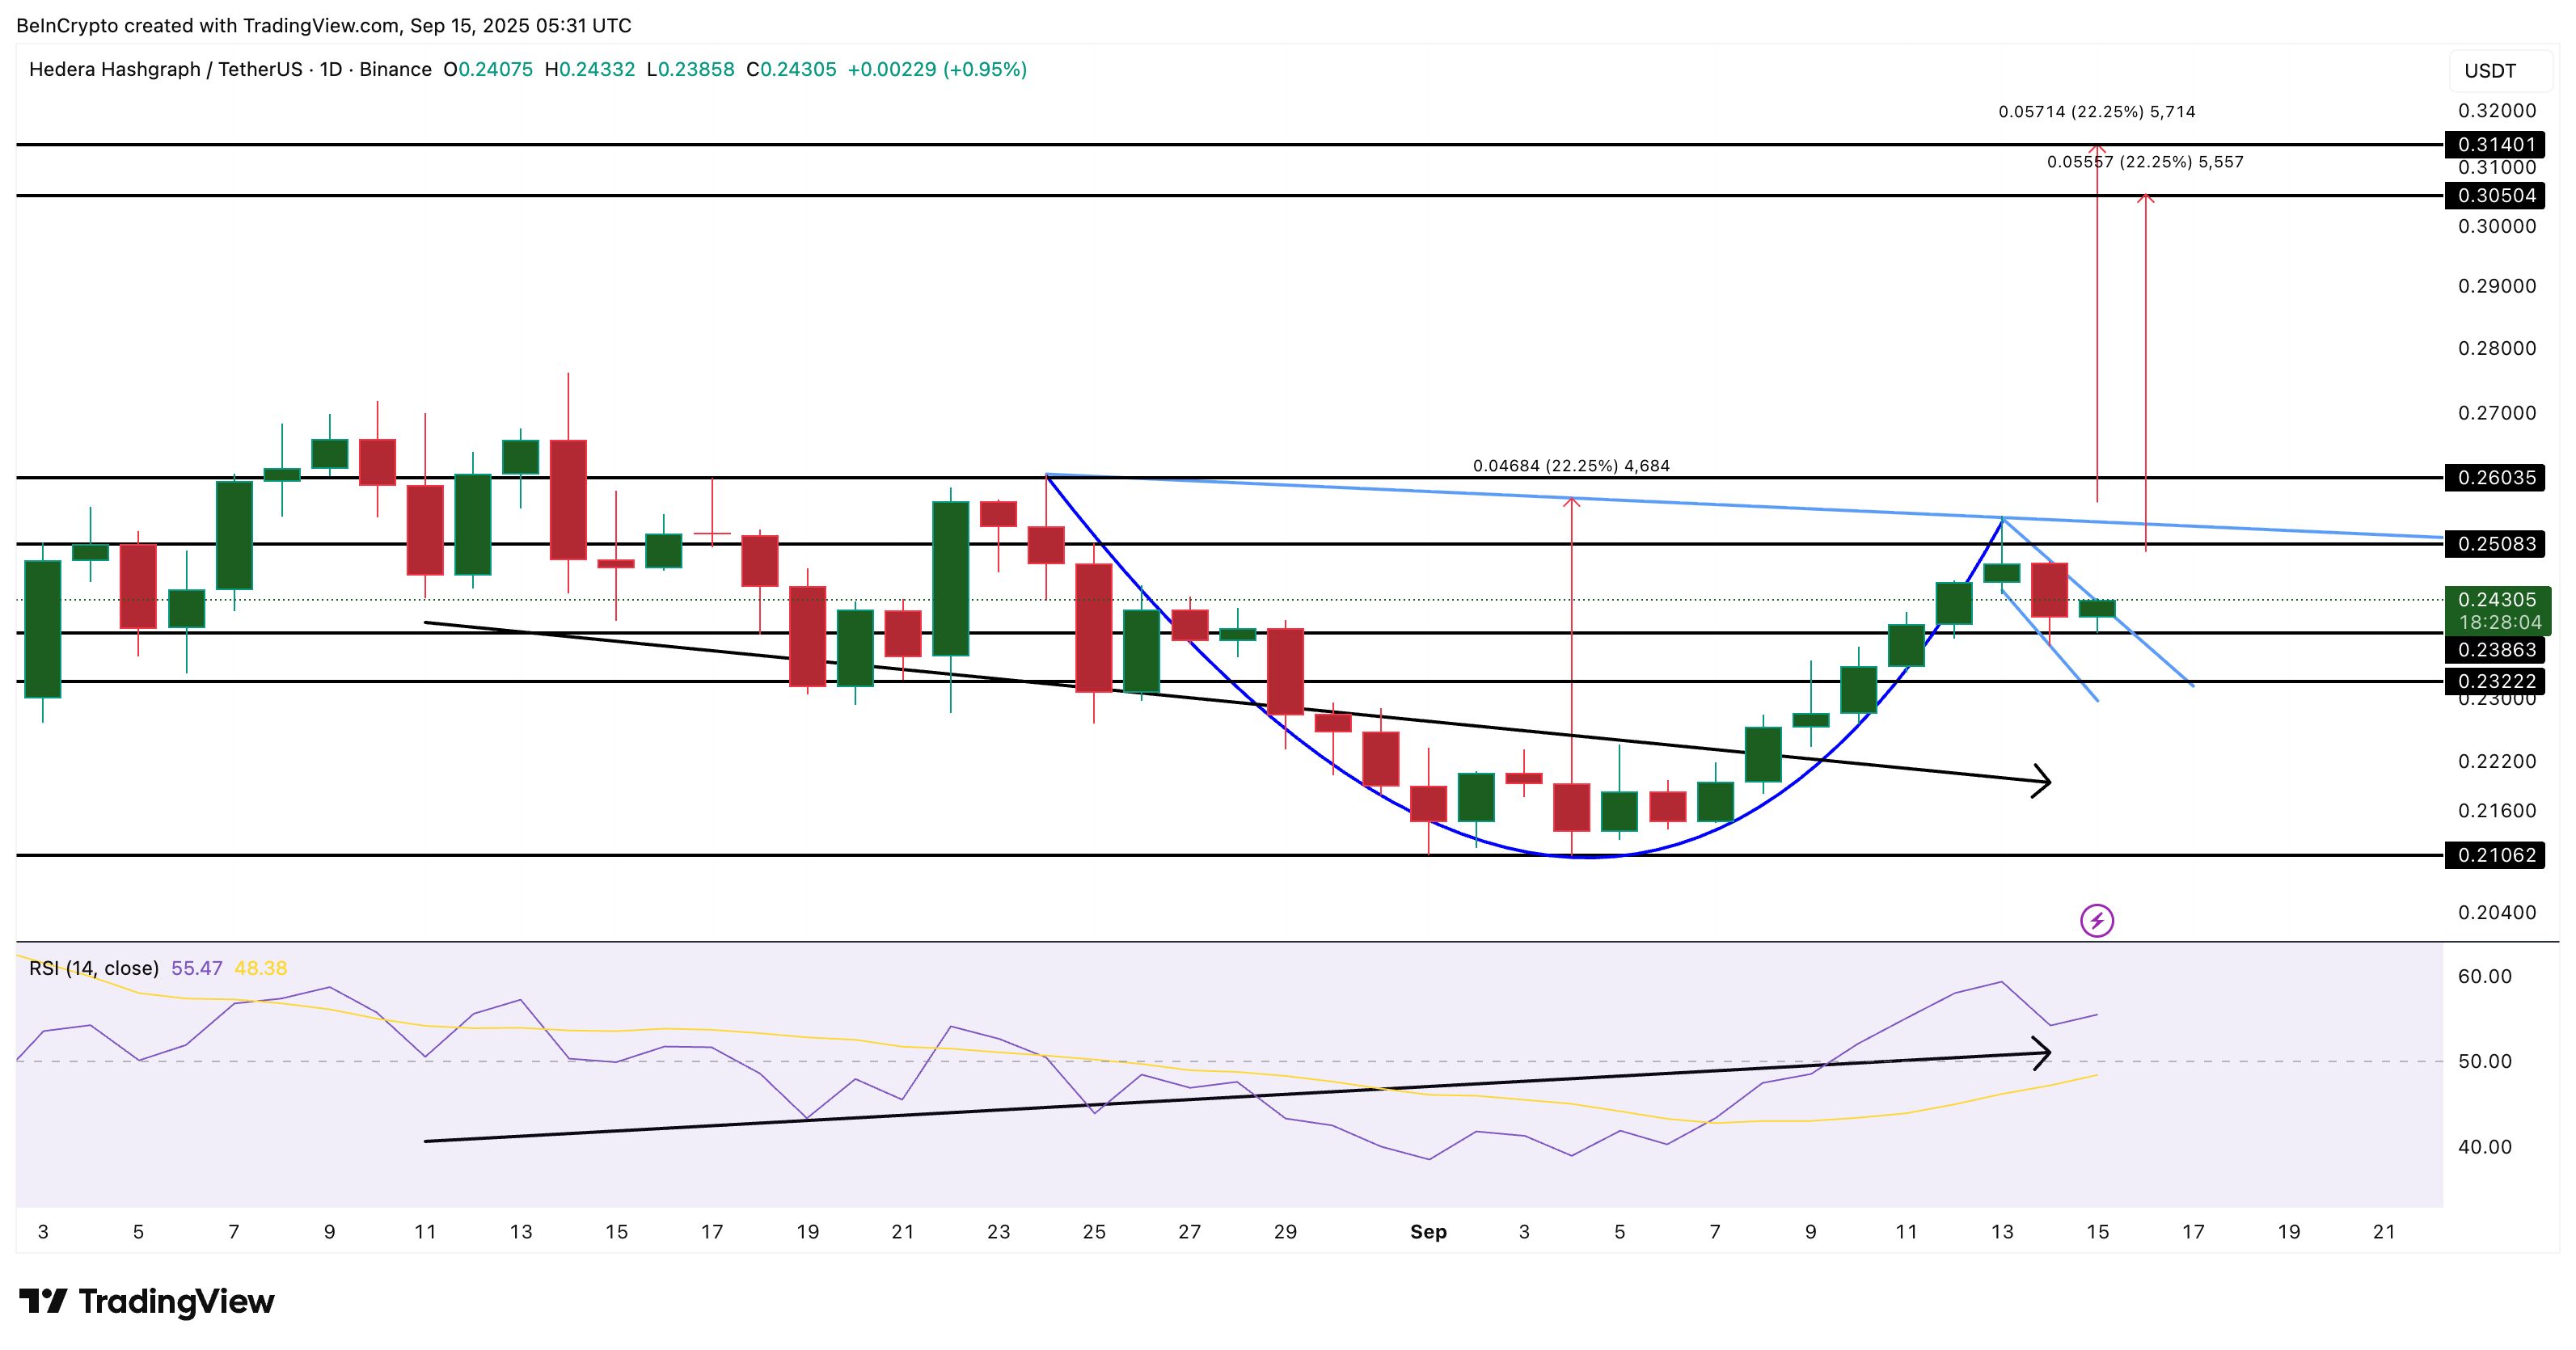 HBAR Price Analysis:
However, there’s a catch. If the HBAR price drops under $0.232 (the critical level), the pattern would be invalidated because it would cut deeper than half the cup’s depth. Holding above that level is crucial for bulls.
If the breakout is confirmed, the potential upside ranges between $0.305 and $0.314, representing almost a 30% increase from current levels. The first target comes from the handle’s breakout projection, while the second comes from the neckline breakout, which would be a cleaner confirmation.
Momentum supports this view. The Relative Strength Index (RSI), which tracks overbought and oversold conditions, has been making higher lows while the price made lower lows. This is called bullish divergence and often signals that a downtrend (Month-on-Month HBAR is down 2%) is about to reverse.
In short, the structure is bullish, but the catch lies in the $0.232 level. A breakout above $0.250 would confirm the move higher, while a dip below $0.232 could erase the bullish setup entirely.
Disclaimer: The content of this article solely reflects the author's opinion and does not represent the platform in any capacity. This article is not intended to serve as a reference for making investment decisions.
You may also like
Coinpedia Digest: This Week’s Crypto News Highlights | 29th November, 2025
QNT Price Breaks Falling Wedge: Can the Bullish Structure Push Toward $150?

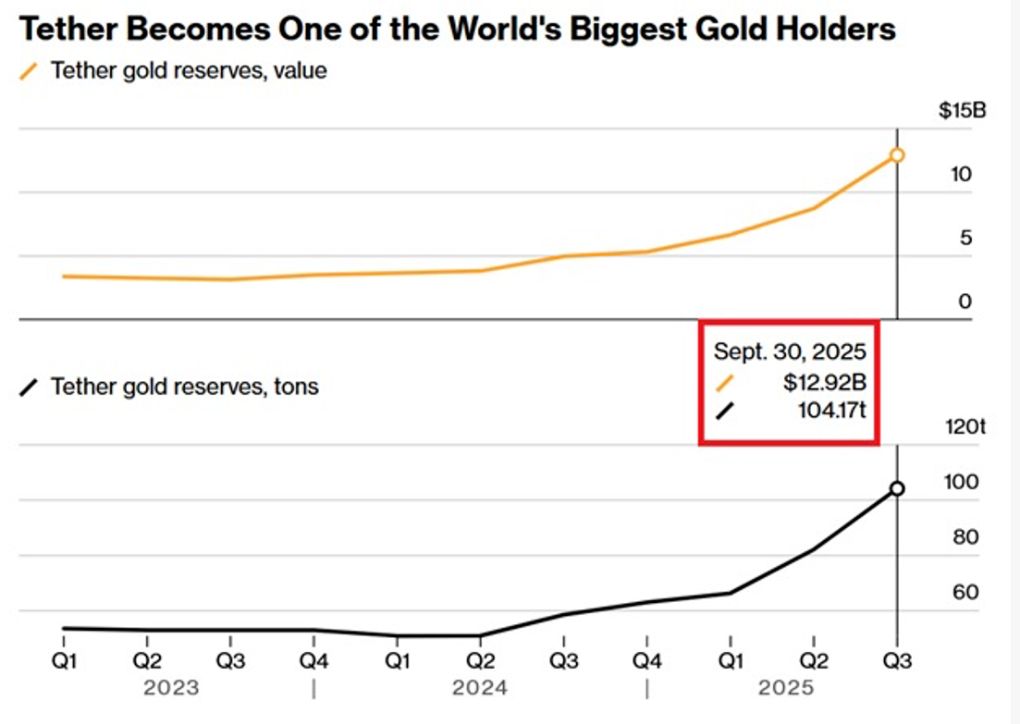
Digital dollar hoards gold, Tether's vault is astonishing!
The Crypto Bloodbath Stalls: Is a Bottom In?