XRP Price Action Heats Up – Bulls Eye $3.00 Breakout

XRP price is up over 5% and has tested the $3.00 resistance. The price is now consolidating gains and might correct lower if stays below $3.00.
- XRP price is facing hurdles and struggling to clear the $3.00 resistance.
- The price is now trading above $2.90 and the 100-hourly Simple Moving Average.
- There is a bullish trend line forming with support at $2.930 on the hourly chart of the XRP/USD pair (data source from Kraken).
- The pair could continue to rise if it stays above the $2.860 zone.
XRP Price Gains Traction
XRP price managed to stay above the $2.850 level and started a fresh increase, beating Bitcoin and Ethereum. The price climbed above the $2.880 and $2.90 resistance levels.
The bulls even pumped the price above the $2.950 level. A high was formed at $2.994 and the price is now consolidating gains. It is testing the 23.6% Fib retracement level of the upward move from the $2.794 swing low to the $2.994 high.
The price is now trading above $2.920 and the 100-hourly Simple Moving Average. Besides, there is a bullish trend line forming with support at $2.930 on the hourly chart of the XRP/USD pair.
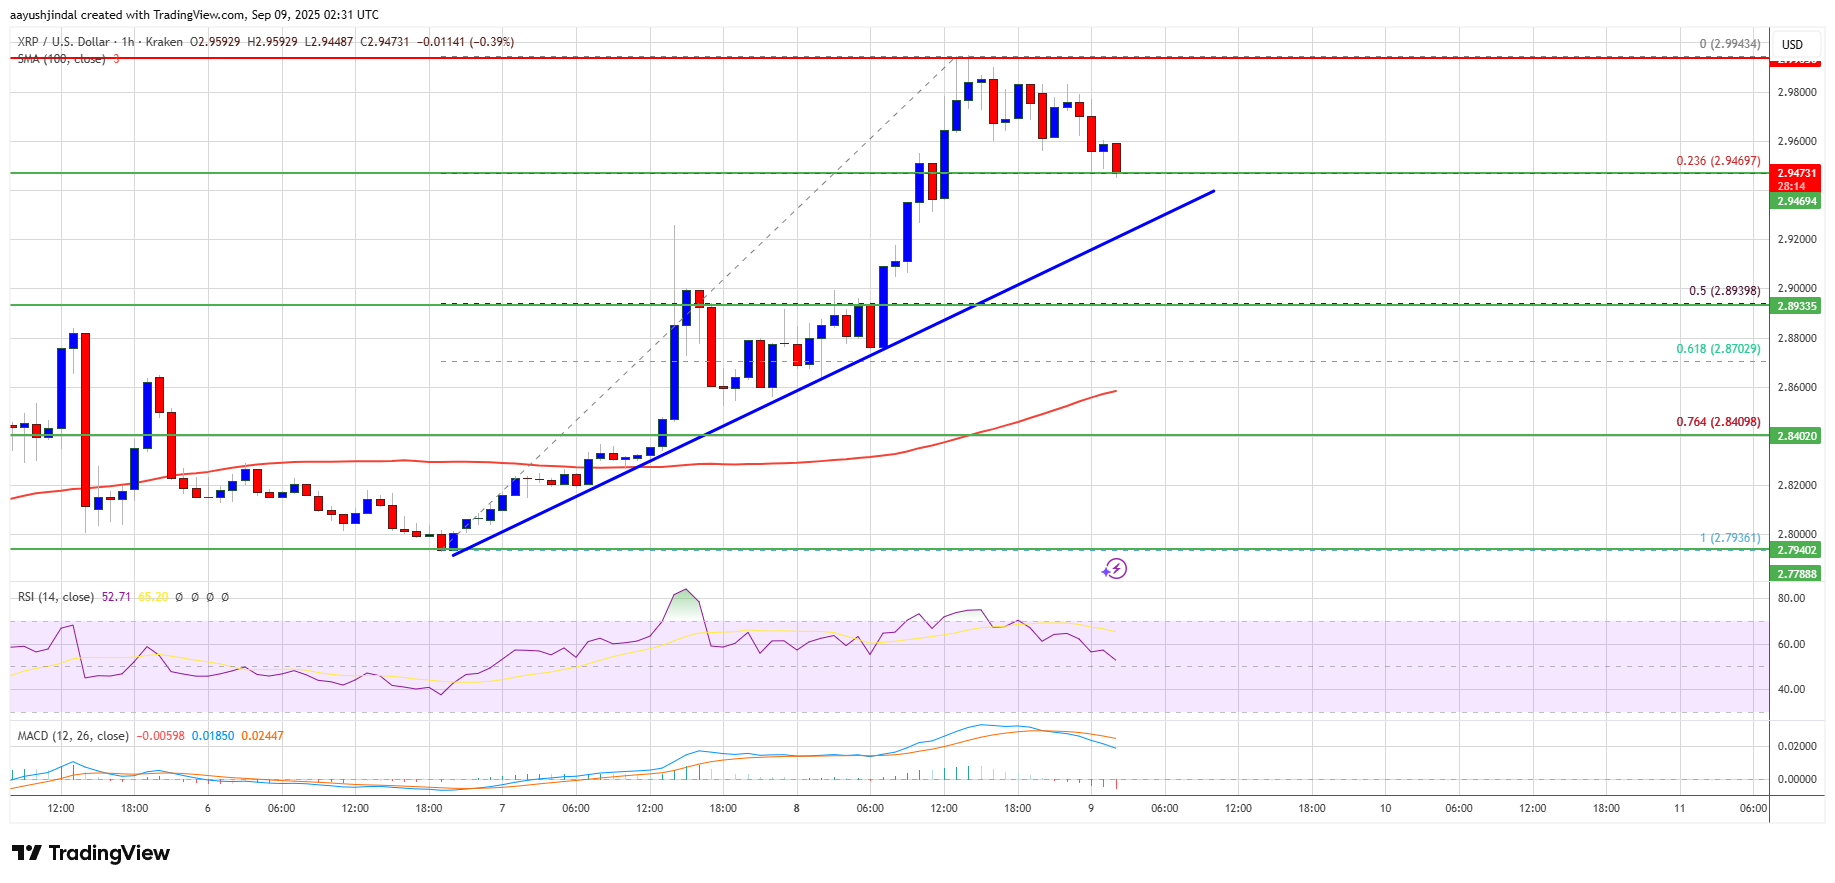
If the bulls protect the $2.930 support, the price could attempt another increase. On the upside, the price might face resistance near the $2.980 level. The first major resistance is near the $3.00 level. A clear move above the $3.00 resistance might send the price toward the $3.050 resistance. Any more gains might send the price toward the $3.120 resistance. The next major hurdle for the bulls might be near $3.150.
Another Decline?
If XRP fails to clear the $2.980 resistance zone, it could continue to move down. Initial support on the downside is near the $2.930 level and trend line. The next major support is near the $2.8920 level or the 50% Fib retracement level of the upward move from the $2.794 swing low to the $2.994 high.
If there is a downside break and a close below the $2.8920 level, the price might continue to decline toward $2.860. The next major support sits near the $2.850 zone, below which the price could gain bearish momentum.
Technical Indicators
Hourly MACD – The MACD for XRP/USD is now losing pace in the bullish zone.
Hourly RSI (Relative Strength Index) – The RSI for XRP/USD is now above the 50 level.
Major Support Levels – $2.930 and $2.860.
Major Resistance Levels – $2.980 and $3.00.
Disclaimer: The content of this article solely reflects the author's opinion and does not represent the platform in any capacity. This article is not intended to serve as a reference for making investment decisions.
You may also like
"I'm panicking, what happened?" Cloudflare outage causes global internet chaos
The incident once again highlights the global internet's heavy reliance on a few key infrastructure providers.


Mars Morning News | Starting this Thursday, the United States will fill in missing employment data and release a new batch of economic data
The United States will fill in missing employment data and release new economic data. The Coinbase CEO is looking forward to progress in crypto regulatory legislation. Market participants predict the market is nearing a bottom. Phantom has launched a professional trading platform. Trump hints that the candidate for Federal Reserve Chair has been decided. Summary generated by Mars AI This summary was generated by the Mars AI model, which is still being iteratively updated for accuracy and completeness.
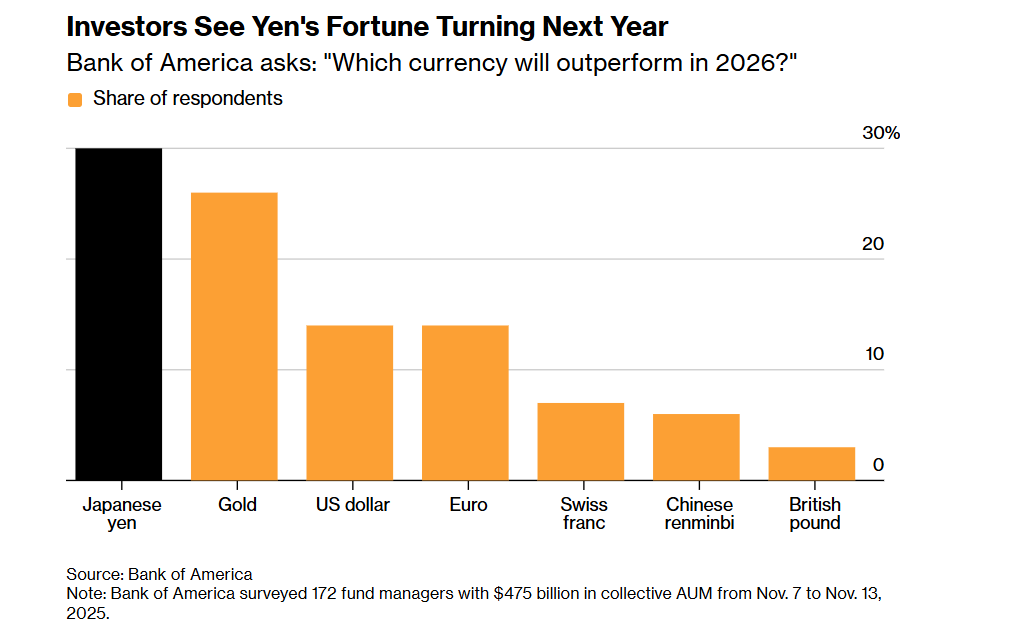
Countdown to a comeback! The yen may become the best-performing currency next year, with gold and the US dollar close behind
A Bank of America survey shows that more than 30% of global fund managers are bullish on the yen's performance next year, with undervalued valuations and potential central bank intervention possibly paving the way for its rebound.