BTC Weekly Review: Shorting on Rallies Remains the Main Theme, Detailed Analysis of Next Week’s Resistance and Support

1. Weekly Market Review: (09.01~09.07)
This week opened at 108,268, hit the lowest point of 107,270 on Monday, reached the highest point of 113,402 on Friday, and finally closed at 111,144. The weekly increase was 2.66%, with a maximum amplitude of 5.72%. The trading volume was $10.044 billions. This week saw a bullish candlestick, with the price closing below the 10-week moving average.
Bitcoin Weekly K-line Chart: (Momentum Quantitative Model + Sentiment Quantitative Model)
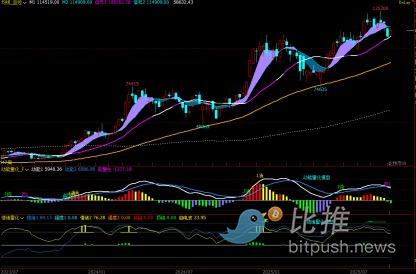
Figure 1
Bitcoin Daily K-line Chart:
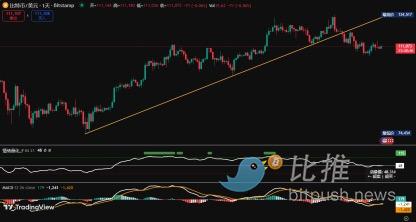
Figure 2
Bitcoin 4-hour K-line Chart:
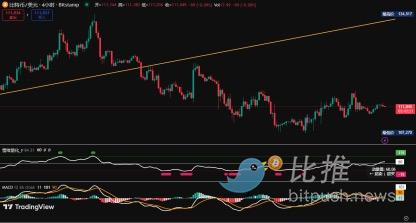
Figure 3
In the previous weekly review, the author predicted:
1. Bitcoin has entered a bear market on both weekly and daily levels, and the following market should be operated with a bearish trading mindset.
2. After a significant decline, multiple technical indicators on several hourly levels have shown oversold conditions, indicating a need for a short-term technical rebound.
3. Around September 3 is a small window for a trend reversal. The author predicted that the price would experience a technical rebound for about 7 days during this period.
4. Resistance levels: The first resistance is around 110,530, the second resistance is around 112,000~113,500, and the strong resistance is around 115,000.
5. Support levels: The first support is around 105,300, and the strong support is around 98,000~100,500.
The trading strategy given in the previous weekly review was:
1. Medium-term positions: All previously held long positions have been sold. The author will use the technical rebound next week to gradually establish medium-term short positions.
2. Short-term positions: Set stop-loss points and mainly short on rallies. (Using 1-hour as the trading cycle)
First entry method: (After the opening, the price finds short-term support around 107,000)
① Wait for a technical rebound. When the price moves to the 112,000~113,500 area and a top signal appears, open a small short position; if the market continues to rebound, add a small amount of short positions in the 114,000~115,000 range. Set stop-loss for both entries above 115,000;
② If the price drops to the 105,300~107,000 area and a bottom signal appears, sell half of the held short positions, and move the take-profit point down to 110,000;
③ If the price drops to around 100,000, sell all held short-term short positions.
Review of actual market performance this week:
On Monday, after opening at 108,268, Bitcoin adjusted slightly downward, touched the weekly low of 107,270, then started to rebound with volatility, closing with a bullish candlestick up 0.90%.
On Tuesday, the price continued to rebound, with a larger increase than the previous day and higher trading volume, closing with a bullish candlestick up 1.83%.
On Wednesday, the price fluctuated around 111,500 after the open, peaked at 112,615, then slowly retreated, closing with a small bullish candlestick up 0.47% with upper and lower shadows.
On Thursday, the price fluctuated downward after the open, stabilized and rebounded after hitting the daily low of 109,343, closing with a bearish candlestick down 0.91% with a lower shadow.
On Friday, affected by market news, the price surged rapidly at 9:00, reaching the weekly high of 113,402, with a maximum increase of about 2.7%. The price then dropped rapidly at 22:00, falling back near the opening price. The maximum amplitude of the day was 3,176 points, closing with a small bearish candlestick down 0.07%, resembling a "lightning rod".
On Saturday, after the open, the price remained in a low-level range with little volatility, closing with a small bearish candlestick down 0.40%.
On Sunday, the price stabilized near the previous day's closing price and slowly rose with volatility, closing at 111,144 with a bullish candlestick up 0.84%.
From this week's review, after a brief adjustment on September 1, Bitcoin immediately started a three-day rebound; this was followed by three days of technical correction, with a bullish candlestick forming on Sunday. It now appears that the rebound started one day after the predicted trend reversal window of September 3, and the rebound cycle will exceed the predicted (about 7 days) period. In terms of short-term trading, this week's rebound has already reached the first short entry point given by the author.
Next, the author will analyze the internal structural changes of Bitcoin after this week's movement based on multi-dimensional technical indicators.
1. As shown in Figure 1, from the weekly chart:
① Momentum Quantitative Model: The weekly level is in the process of momentum bearish divergence, and the volume (green) bars are increasing.
The model indicates a high probability of price decline.
② Sentiment Quantitative Model: Both sentiment indicators are at 0, with a peak value of 0.
The model indicates the price is in a downward process.
③ Digital Monitoring Model: No digital signals are currently displayed.
The above data suggest: The weekly level is at the early stage of a decline.
2. As shown in Figure 2, from the daily chart analysis:
① Momentum Quantitative Model: After the daily level momentum bearish divergence formed, the price fell for about 3 weeks. On Friday, the MACD fast and slow lines formed a golden cross below the zero axis.
② Sentiment Quantitative Model: After Sunday’s close, both sentiment indicators were below 50.
③ In terms of volume: There was no significant change in trading volume during the seven trading days this week.
The above data suggest: There is a short-term rebound at the daily level.
2. Next Week's Market Forecast: (09.08~09.14)
1. Bitcoin has entered a bear market on both weekly and daily levels, and the main strategy should be to short on rallies.
2. Next week, Bitcoin will still have a 3~6 day rebound cycle, after which the price will continue to fluctuate downward.
3. Resistance levels: The first resistance is around 113,500, and the strong resistance is around 115,000.
5. Support levels: The first support is around 105,300, and the strong support is around 98,000~100,500. If the price falls to the strong support area, there is a high probability of a strong rebound.
3. Next Week's Trading Strategy (excluding unexpected news): (09.08~09.14)
1. Medium-term positions: 30% of short positions have been established this week. Next week, the author will continue to gradually increase positions. For specific entry methods, please refer to the link at the end of the article.
2. Short-term positions: Set stop-loss points and mainly short on rallies. (Using 1-hour as the trading cycle)
① Hold some of the short positions bought in the 112,000~113,500 area this week. When the market rebounds to the 114,000~115,000 range next week, increase short positions. Set stop-loss for both entries above 115,000;
② If the price drops to the 105,300~107,000 area and a bottom signal appears, sell half of the held short positions, and move the take-profit point down to 110,000;
③ If the price falls below the 105,300~107,000 area, move the take-profit point down to 107,000;
④ If the price drops to around 100,000, sell all held short-term short positions.
Disclaimer: The content of this article solely reflects the author's opinion and does not represent the platform in any capacity. This article is not intended to serve as a reference for making investment decisions.
You may also like
Gemini 3 arrives late at night: surpasses GPT 5.1, the era of Google large models has arrived
Google has defined it as an “important step towards AGI” and emphasized that it is currently the world’s most advanced agent in terms of multimodal understanding and depth of interaction.

Cloudflare Outage Sparks Global Disruptions Across Crypto Platforms and Major Web Services

U.S. Moves Toward Joining Global Crypto Reporting Network as CARF Review Reaches White House

Crypto: Trump Prepares a Global Tax Hunt