Date: Sat, Sept 06, 2025 | 11:10 AM GMT
The cryptocurrency market is continuing its choppy consolidation as Ethereum (ETH) hovers around $4,300, cooling off from its recent high of $4,954 — a drop of more than 13% in just weeks. This weakness has spilled over into major altcoins including Render (RENDER).
RENDER is trading in the red, and more importantly, its current chart structure reveals a familiar price behavior, which may offer clues about what’s next.
 Source: Coinmarketcap
Familiar Pattern Hints at Further Dip
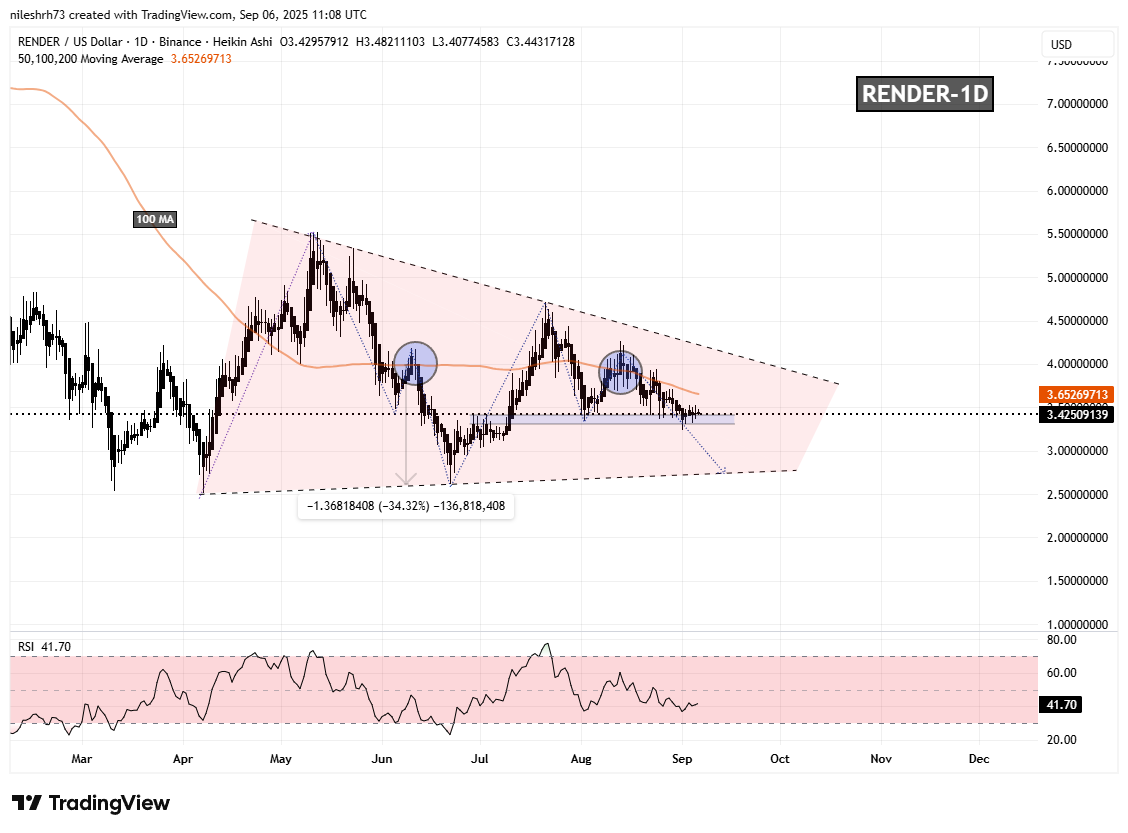
On the daily chart, RENDER continues to trade within a falling wedge formation — a structure that often resolves bullishly over the long run. However, in the short term, price action suggests more downside before any potential recovery.
In June, RENDER lost its grip on the 100-day moving average (100 MA) and quickly dropped by around 34%, bottoming out near the wedge’s lower support at $2.75.
 Render (RENDER) Daily Chart/Coinsprobe (Source: Tradingview)
Fast forward to now, and history appears to be repeating itself. RENDER has once again slipped below its 100-day MA near $3.91, and is now hovering around the critical support area of $3.30–$3.40.
What’s Next for RENDER?
If the same fractal continues, RENDER risks another correction toward the lower wedge boundary around $2.75, which would mark a potential 19% decline from current levels. Adding to this bearish case, the Relative Strength Index (RSI) is sitting near 41, leaving room for further downside into the oversold region before a rebound attempt.
However, if RENDER manages to reclaim its 100-day MA ($3.65), this bearish setup would likely be invalidated, opening the door for a recovery move instead.
