Is Bitcoin about to fight the 100,000 defense battle again?
Regaining $114,000 will bring all short-term holders back into profit, strengthening the bull market narrative; on the other hand, falling below $104,000 could potentially repeat the previous pattern of “post-all-time-high exhaustion.”
Regaining $114,000 will bring all short-term holders back to profitability, reinforcing the bull market logic; conversely, falling below $104,000 could trigger a repeat of the previous "post-all-time-high exhaustion" pattern.
Written by: CryptoVizArt, UkuriaOC, Glassnode
Translated by: Chopper, Foresight News
Summary
- Bitcoin is currently trading near $112,000, consolidating within the $104,000 - $116,000 range. The Unspent Transaction Output Realized Price Distribution (URPD) shows that investors have accumulated within the $108,000 - $116,000 range. This reflects active buying on dips in the market, but does not rule out the possibility of further short- to mid-term declines.
- The price has fallen below the 0.95 quantile cost basis, marking the end of a three-and-a-half-month frenzy phase and returning to the $104,000 - $114,000 range. Historically, this range often serves as a sideways consolidation channel before the next clear trend emerges.
- During the sell-off, the profitability ratio of short-term holders (STH) plummeted from a high to 42%, then rebounded to 60%. This rebound puts the market in a neutral but fragile state. Only when the price recovers the $114,000 - $116,000 range can a renewed uptrend be confirmed.
- Off-chain sentiment is cooling: futures funding rates remain neutral but are susceptible to shocks, and ETF inflows have slowed significantly. Bitcoin ETF flows mainly reflect directional spot demand, while Ethereum ETF flows are a mix of spot demand and "spot-futures arbitrage."
Range Accumulation: Buying in the Blank Zone
Since reaching an all-time high in mid-August, Bitcoin has entered a volatile downtrend, rebounding to around $112,000 after dropping to $108,000. As volatility rises, a core question emerges: is this the start of a true bear market, or just a short-term correction? We will analyze this using both on-chain and off-chain indicators.
The Unspent Transaction Output Realized Price Distribution (URPD) is an important analytical starting point, as it shows the creation price of current Bitcoin UTXOs, providing insight into investors' cost basis ranges.
Comparing the snapshot from August 13 to the current structure, it is evident that investors have used the correction to accumulate within the $108,000 - $116,000 "blank zone." This "buying the dip" behavior is positive for the long-term trend, but does not eliminate the risk of further short- to mid-term corrections.
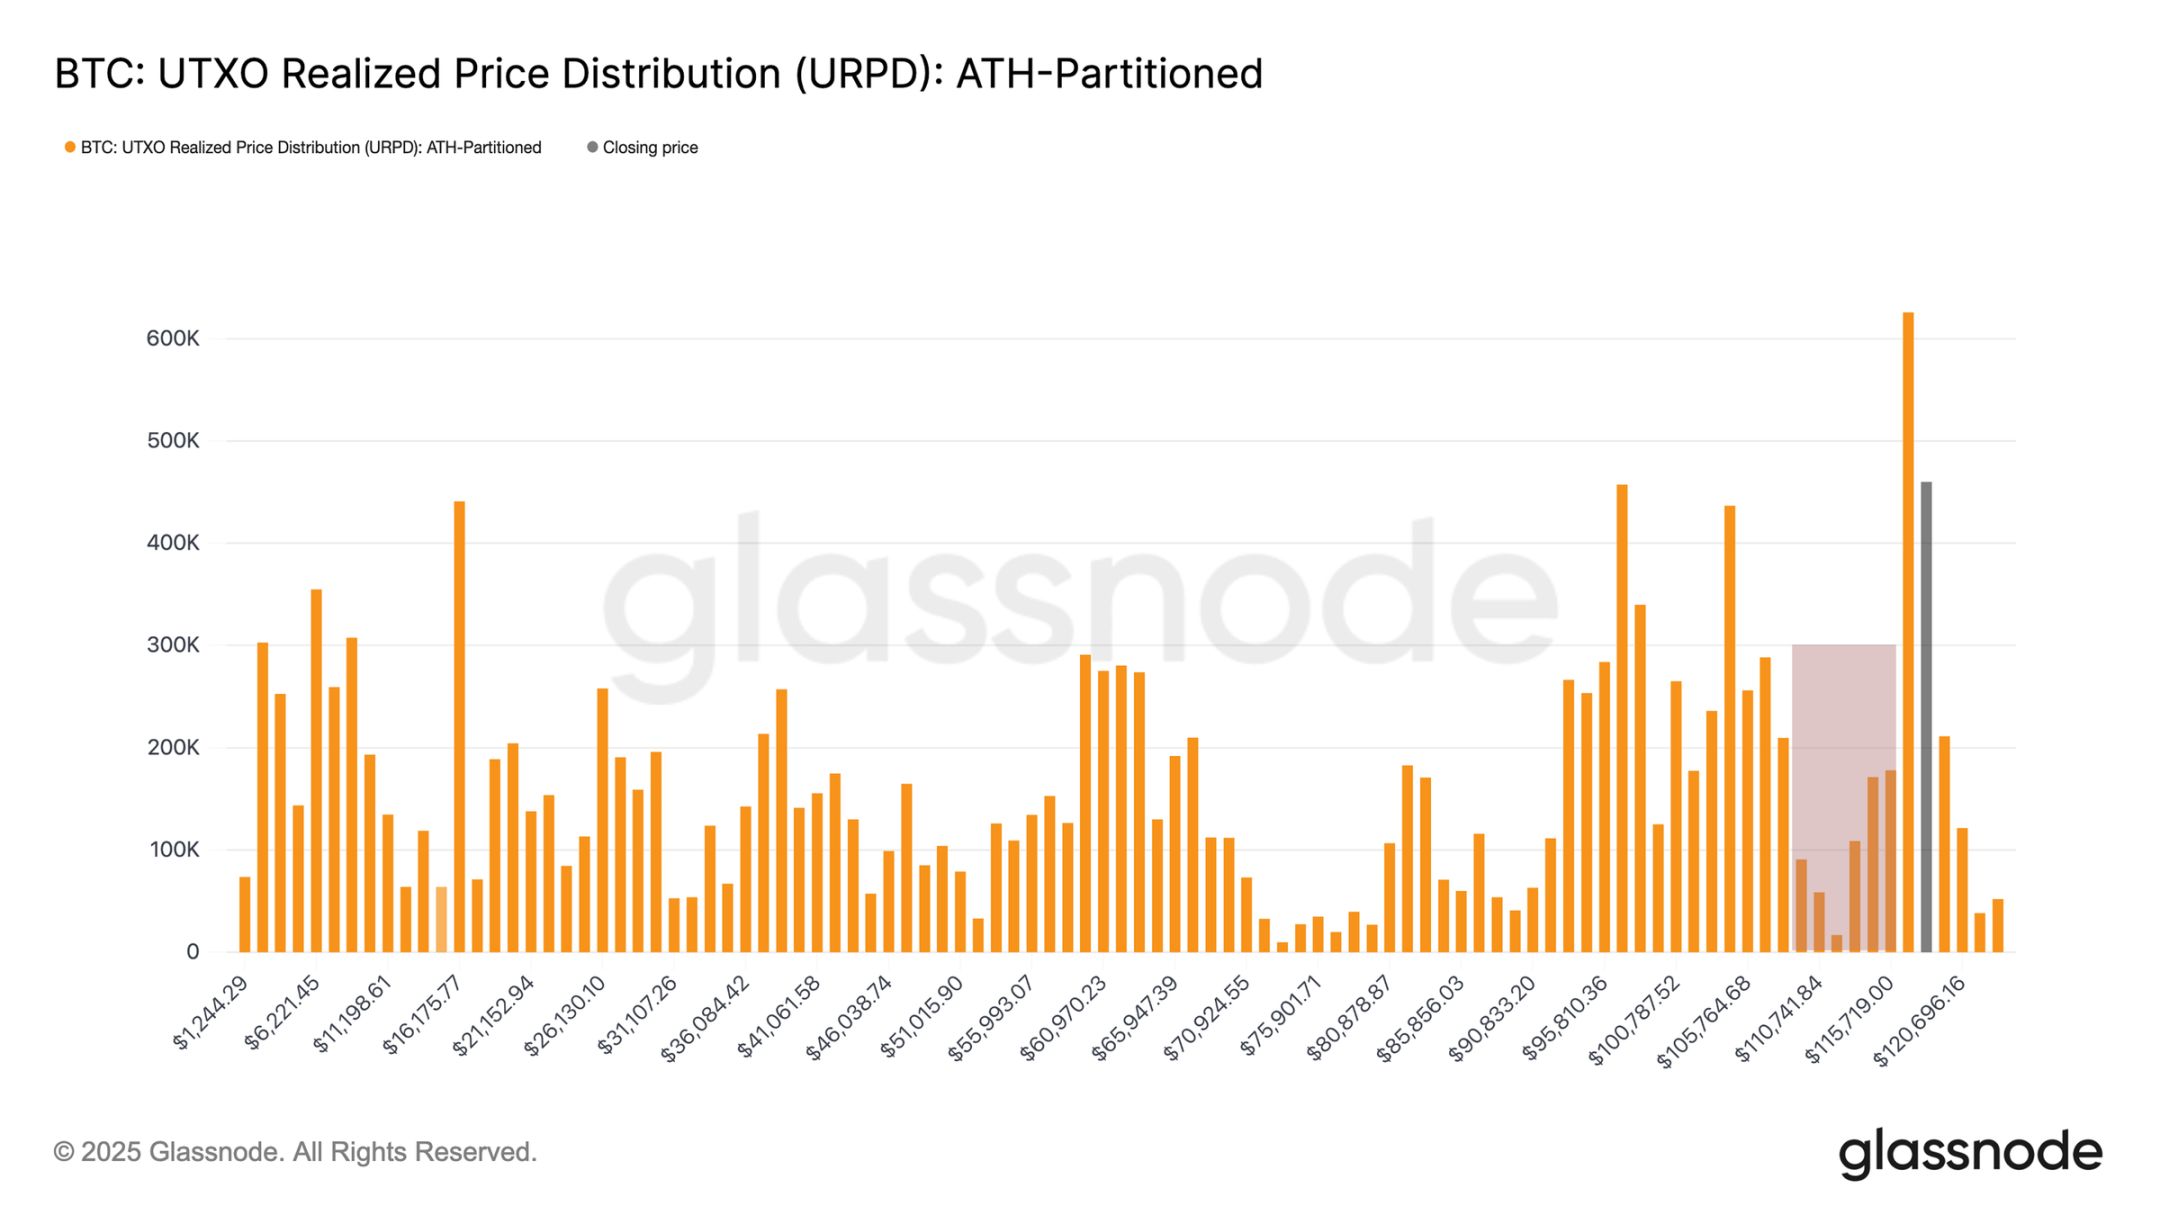
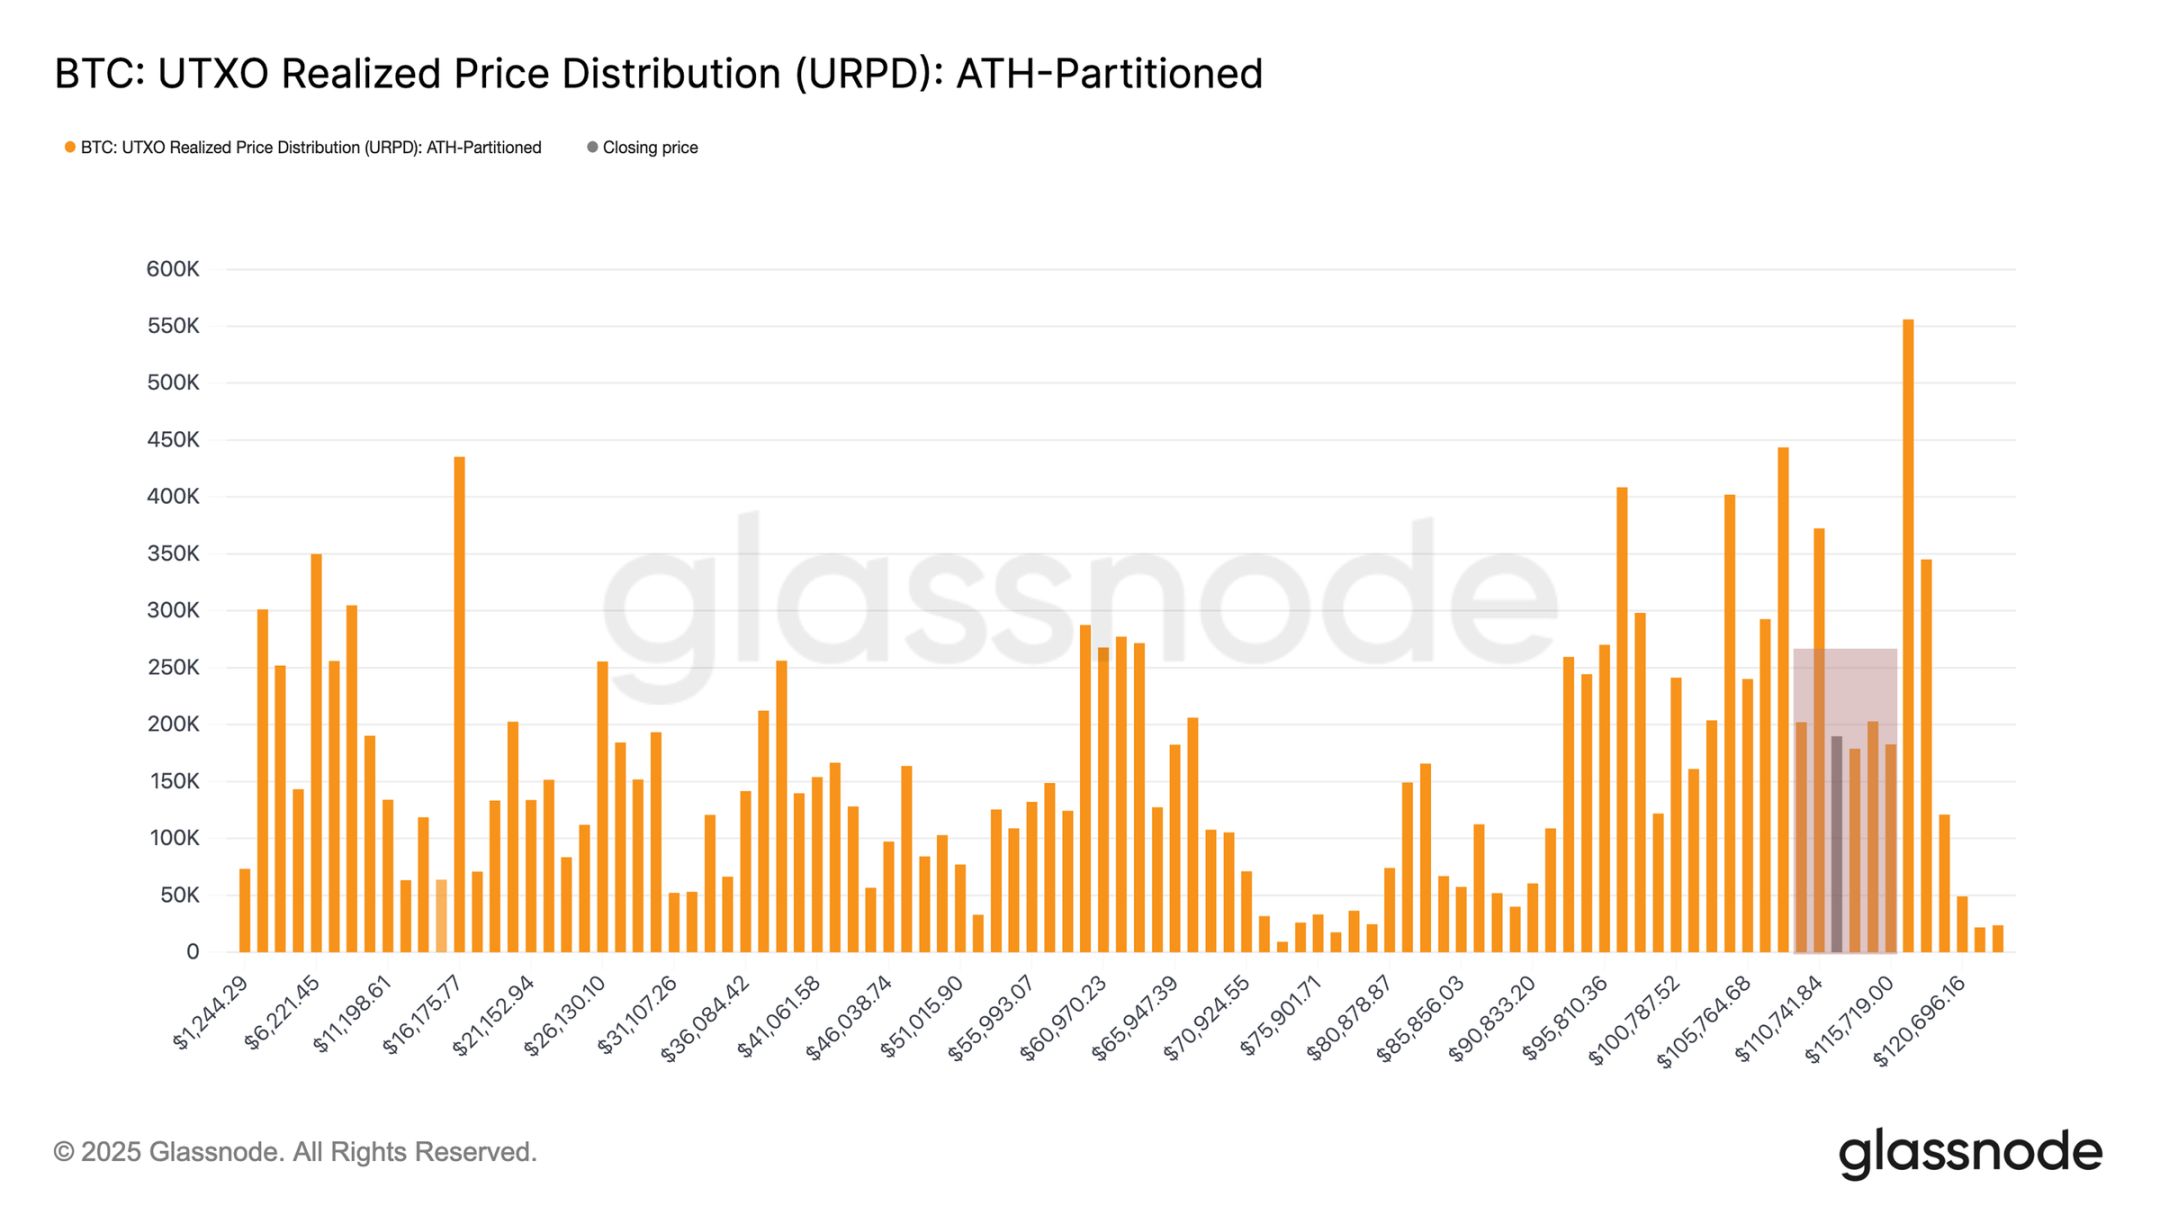
UTXO Realized Price Distribution Chart
From Frenzy to Exhaustion: Shifting Cycle Phases
Although the URPD reflects active buying on dips, the possibility of continued market weakness must be analyzed in the context of the broader cycle. The new highs in mid-August marked the third multi-month frenzy phase in this cycle, characterized by strong price momentum pushing the majority of coins into profit. Maintaining such a phase requires continuous capital inflows to offset persistent profit-taking pressure, a dynamic that is difficult to sustain long-term.
The 0.95 quantile cost basis (the price threshold at which 95% of coins are in profit) can capture this trend. After the most recent frenzy phase lasted about three and a half months, demand finally showed signs of exhaustion, with Bitcoin falling below this threshold on August 19.
Currently, the price is fluctuating between the 0.85-0.95 quantile cost basis, i.e., the $104,100 - $114,300 range. Historically, this range serves as a consolidation channel after the frenzy peak, typically resulting in sideways movement. Therefore:
- Falling below $104,100 could trigger a repeat of the "post-all-time-high exhaustion" pattern seen earlier in this cycle;
- Regaining $114,300 would indicate stabilized demand and the market regaining trend dominance.
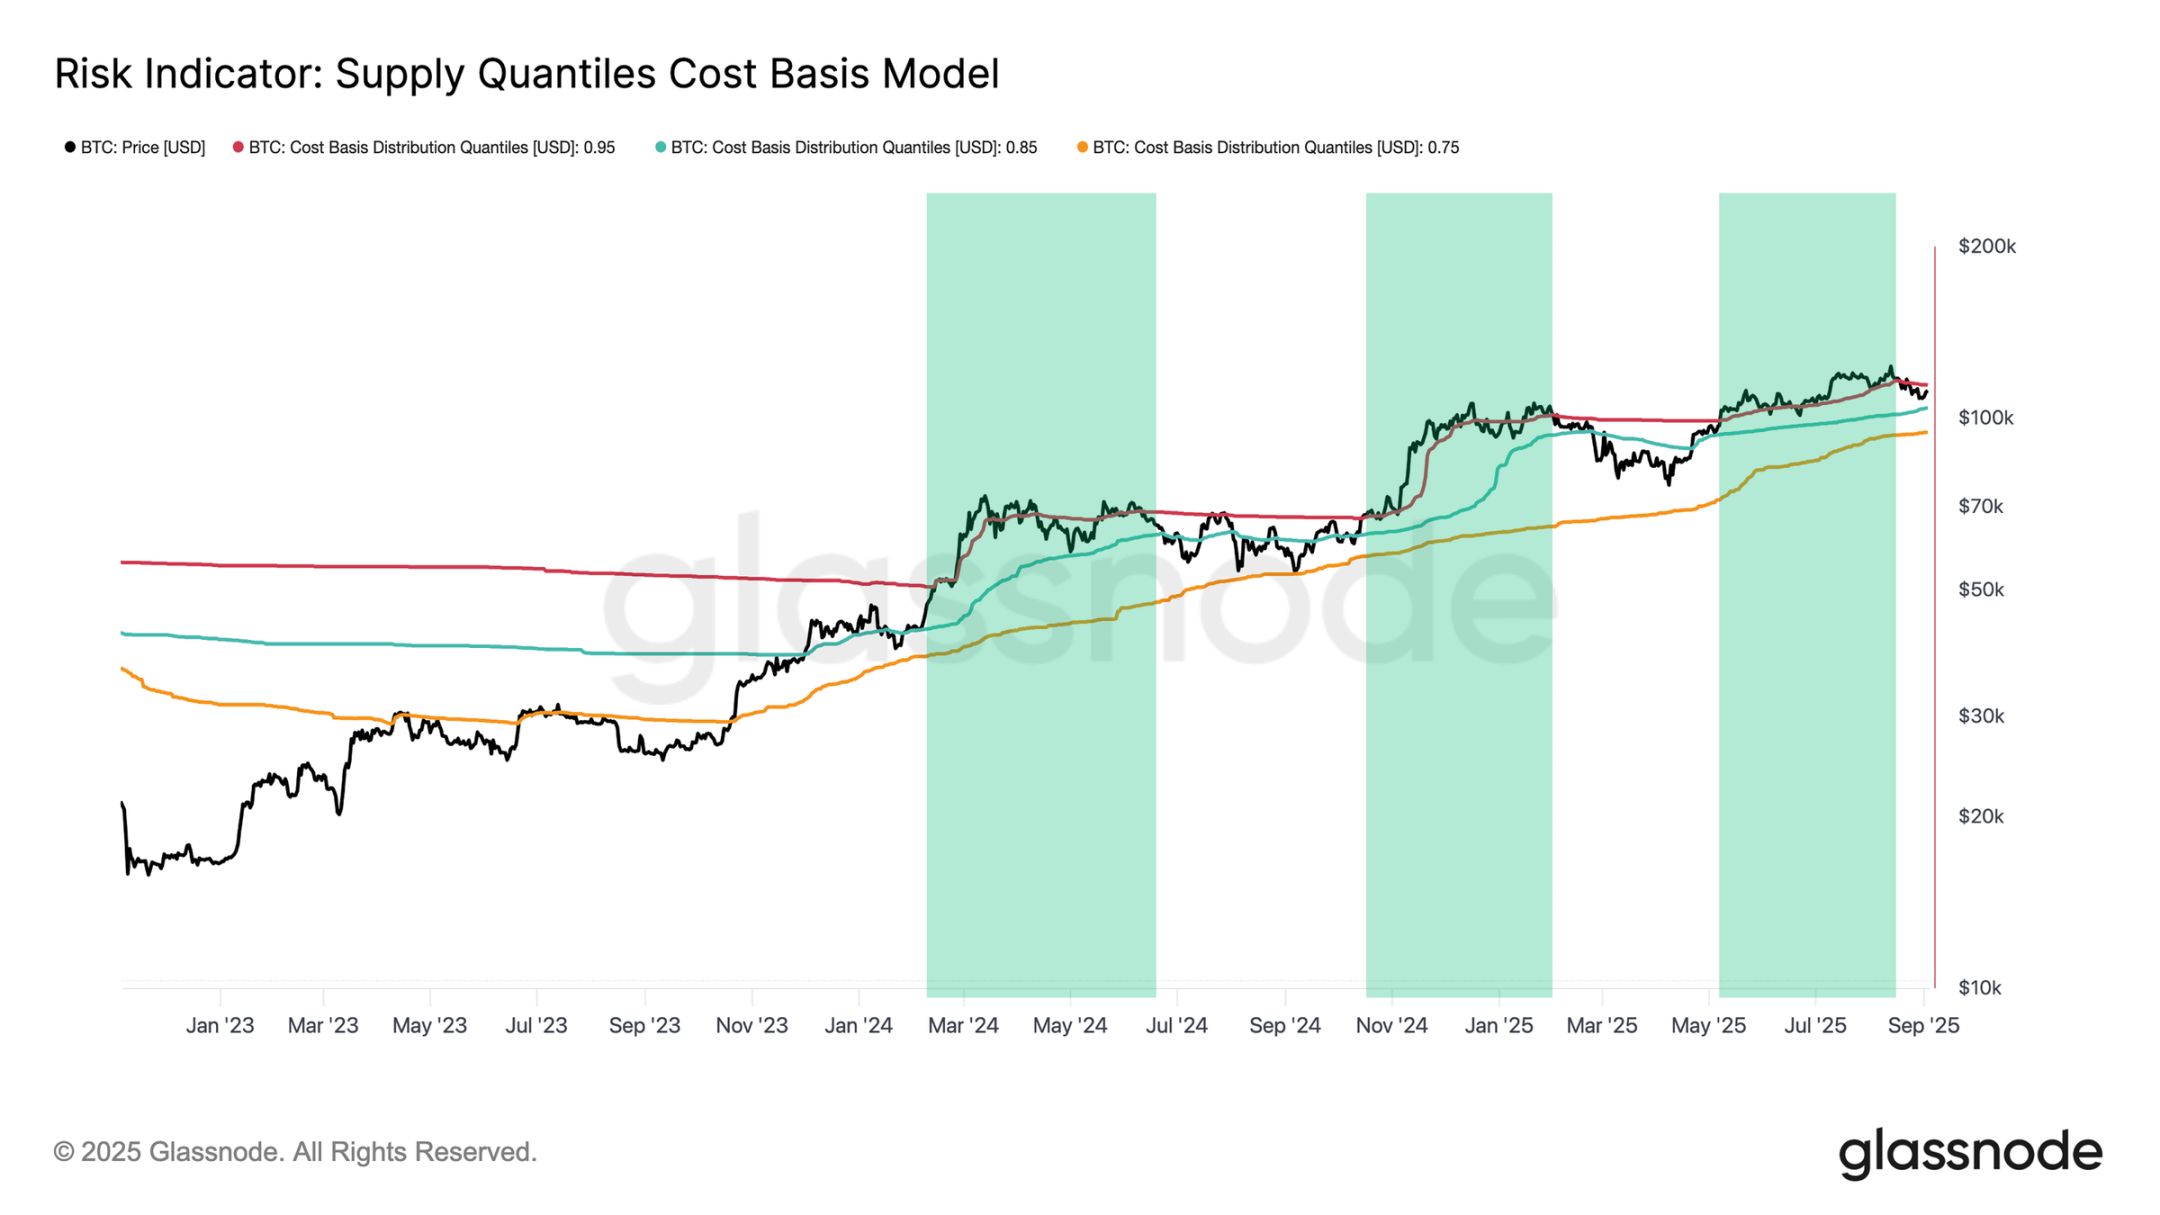
Cost Basis Quantile Risk Indicator Chart
Short-Term Holders Under Pressure: A Barometer of Market Sentiment
Given that Bitcoin is currently in a critical range, the behavior of recent buyers is crucial. The unrealized profit and loss of short-term holders is often the core psychological factor influencing local tops and bottoms, with sudden shifts in their profit/loss status directly affecting their trading decisions.
The proportion of profitable coins held by short-term holders is a clear indicator of this dynamic. As the price dropped to $108,000, the profitability ratio plunged from over 90% to 42%, a typical cooling process from "overheated" to "under pressure." Such sharp reversals often trigger panic selling by high-entry buyers, and after the selling is exhausted, prices rebound—explaining the recent move from $108,000 back up to $112,000.
At current prices, the profitability ratio of short-term holders has rebounded to over 60%, which is neutral compared to recent extremes, but this rebound remains fragile. Only when the price consistently recovers the $114,000 - $116,000 range (at which point over 75% of short-term holders' coins will be back in profit) can enough confidence be built to attract new capital and drive the next rally.
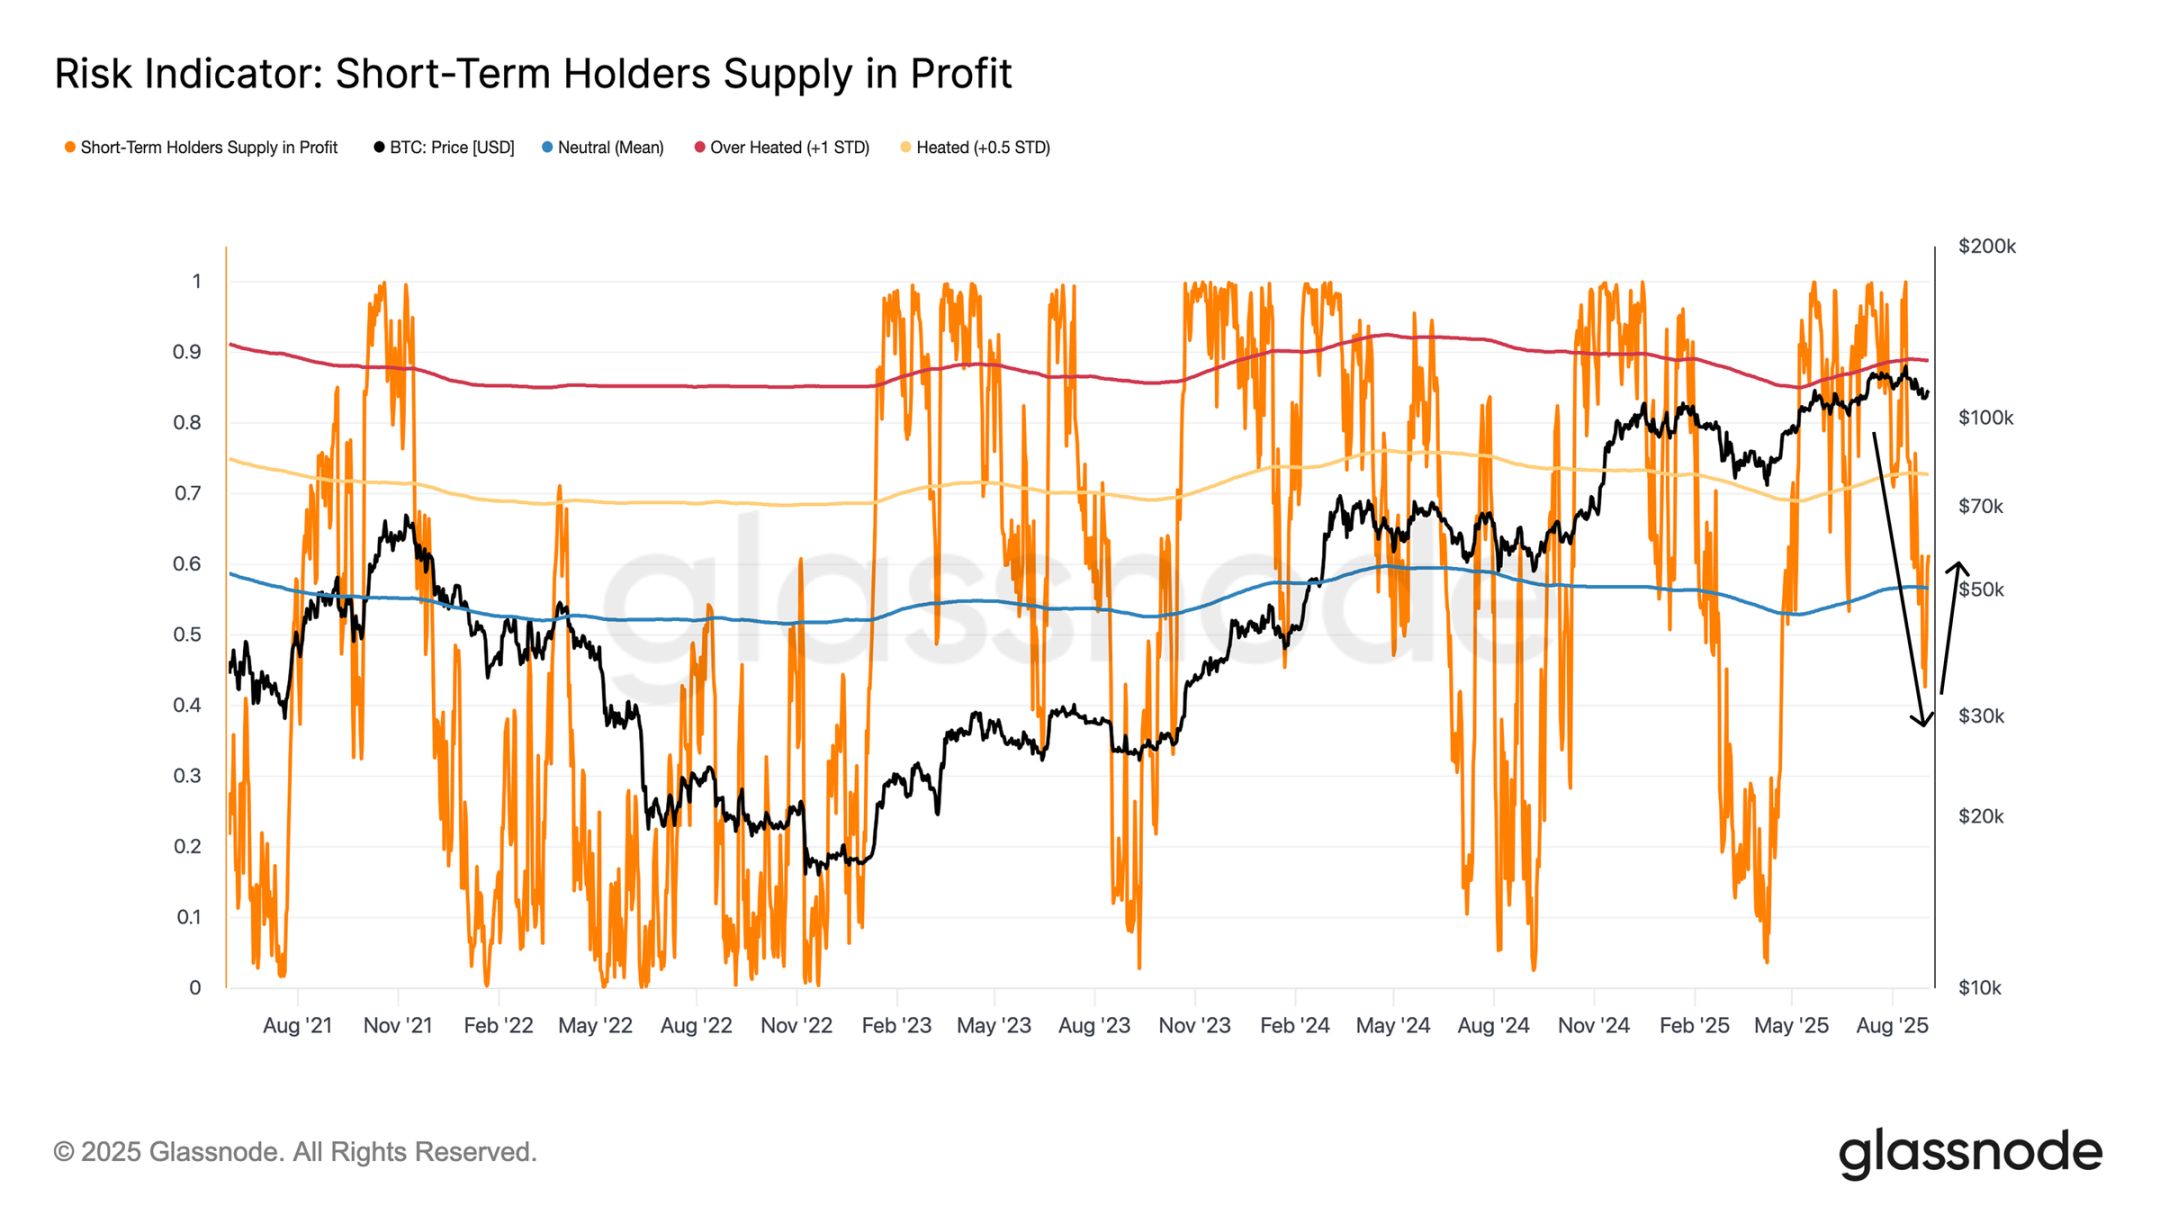
Short-Term Holder Profitability Risk Indicator Chart
Sentiment Detection: Signals from the Futures and ETF Markets
After analyzing on-chain price models and short-term holder profitability, the next step is to determine whether off-chain indicators align with these signals or diverge.
Among off-chain indicators, the futures market (especially perpetual contracts) is most sensitive to overall sentiment changes. The funding rate (the hourly interest paid by longs to shorts for holding positions) is a direct indicator of speculative demand: excessively high rates indicate an overheated market, while drifting toward zero or negative values signals weakening momentum.
In this cycle, $300,000/hour is the benchmark dividing bull and bear sentiment. The current funding rate is about $366,000/hour, placing the market in a neutral zone—not reaching the overheated peaks of over $1 million/hour in March and December 2024, nor dropping to the cooled levels below $300,000/hour seen in Q1-Q3 2025. If the rate falls further below the benchmark, it will confirm a comprehensive weakening of futures market demand.
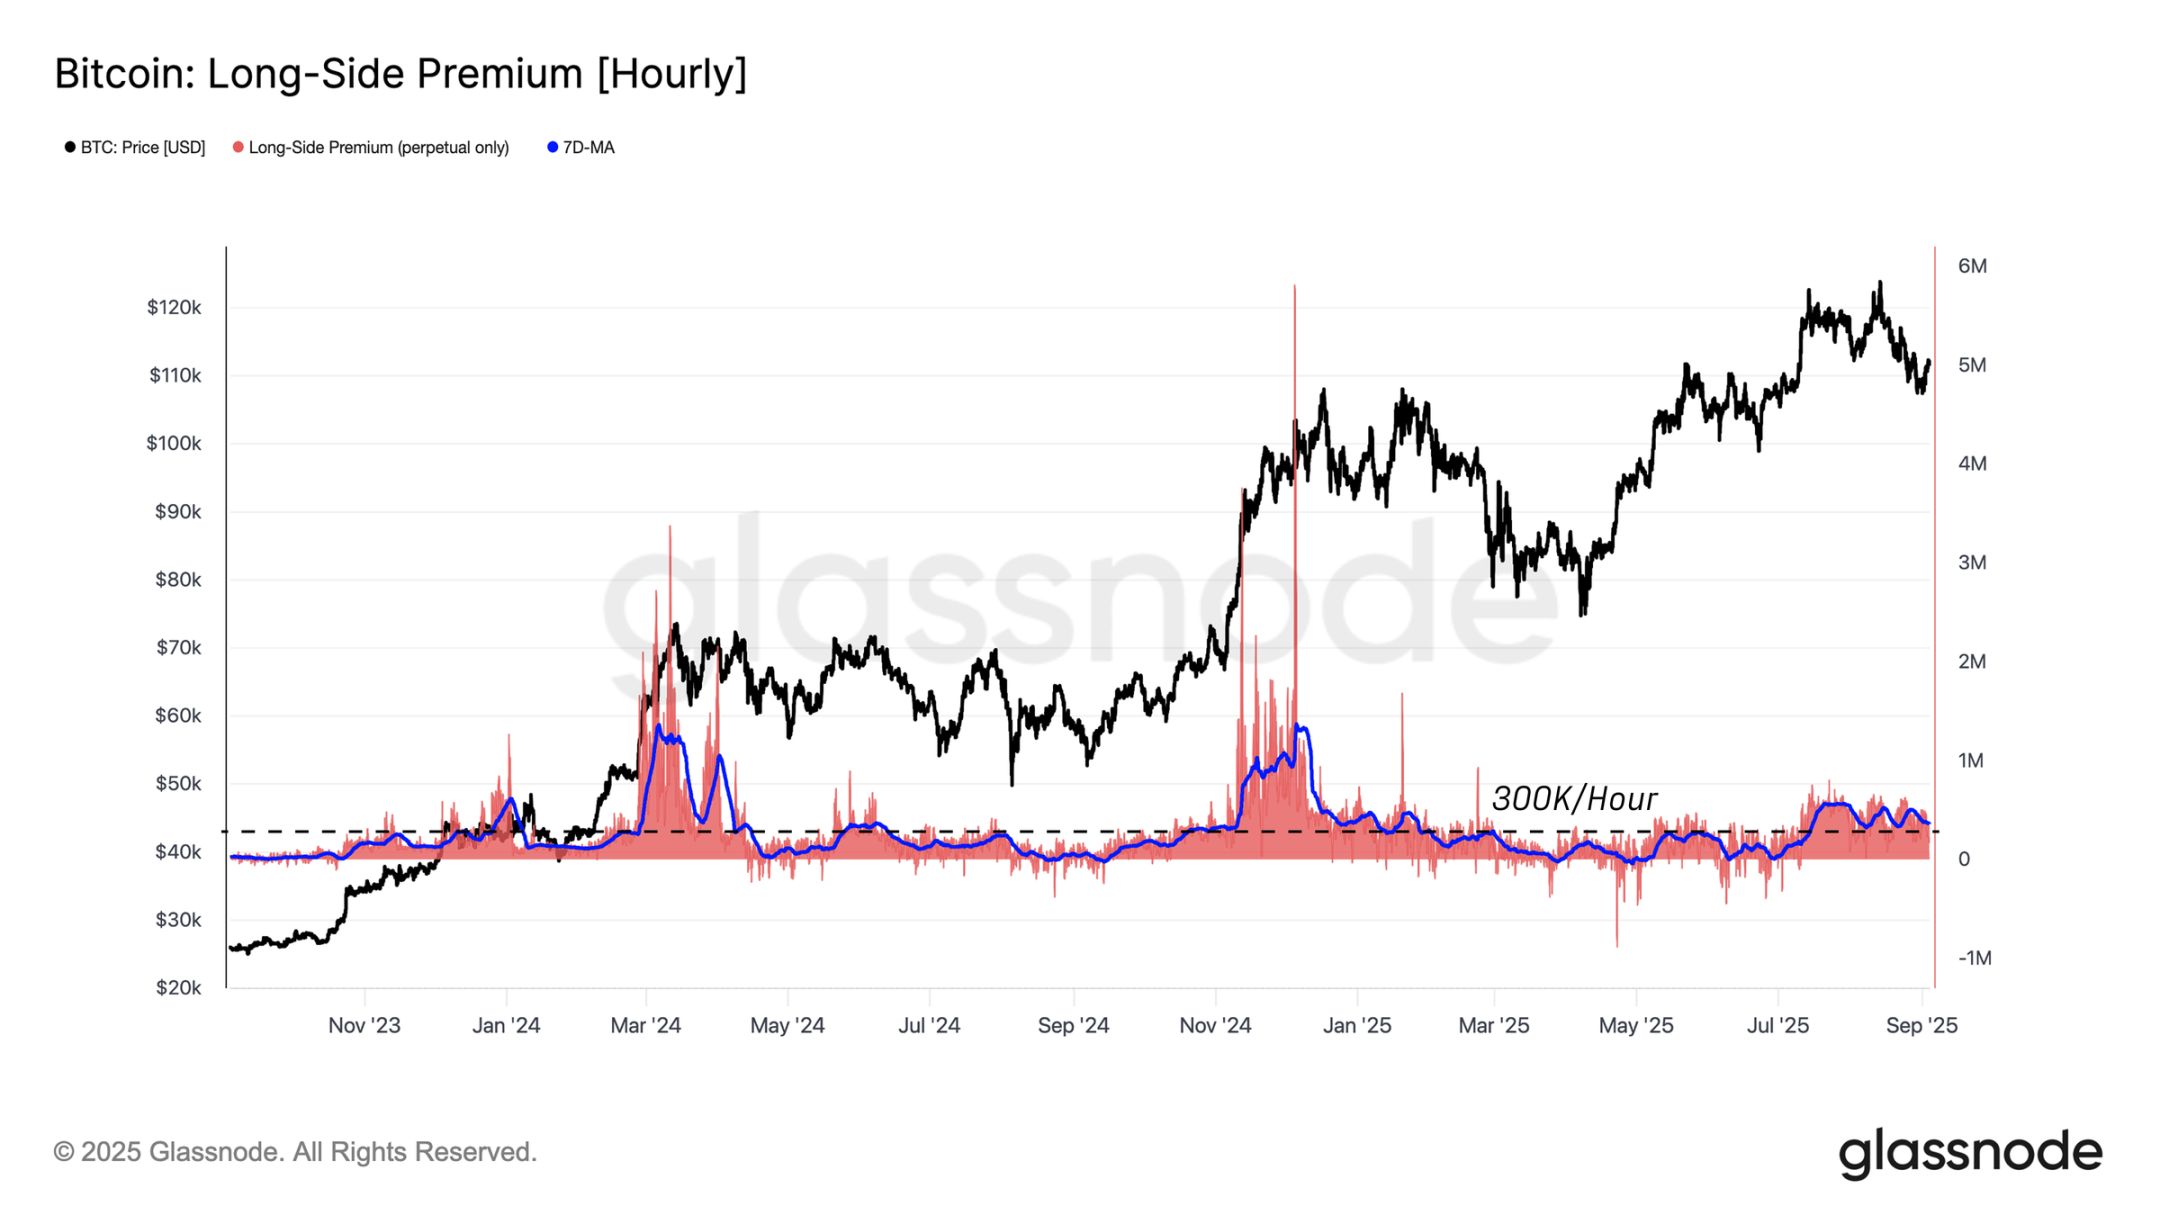
Bitcoin Longs Premium Hourly Chart
Traditional Finance Demand Cools: Shrinking ETF Inflows
Besides the futures market, spot ETF inflows are an important indicator of traditional financial institutions' demand strength. The 14-day average net inflow data shows that from May to August 2025, Ethereum ETF daily net inflows reached 56,000 - 85,000 ETH, a key driver behind its all-time highs; but over the past week, this pace has plummeted to just 16,600 ETH per day, highlighting weakening demand amid the price correction.
Bitcoin shows a similar trend: since April, net inflows consistently exceeded 3,000 BTC/day, but began cooling in July, with the current 14-day average net inflow dropping to just 540 BTC. Overall, the traditional financial buying power in both major markets has contracted significantly, in sync with the overall price correction in recent weeks.
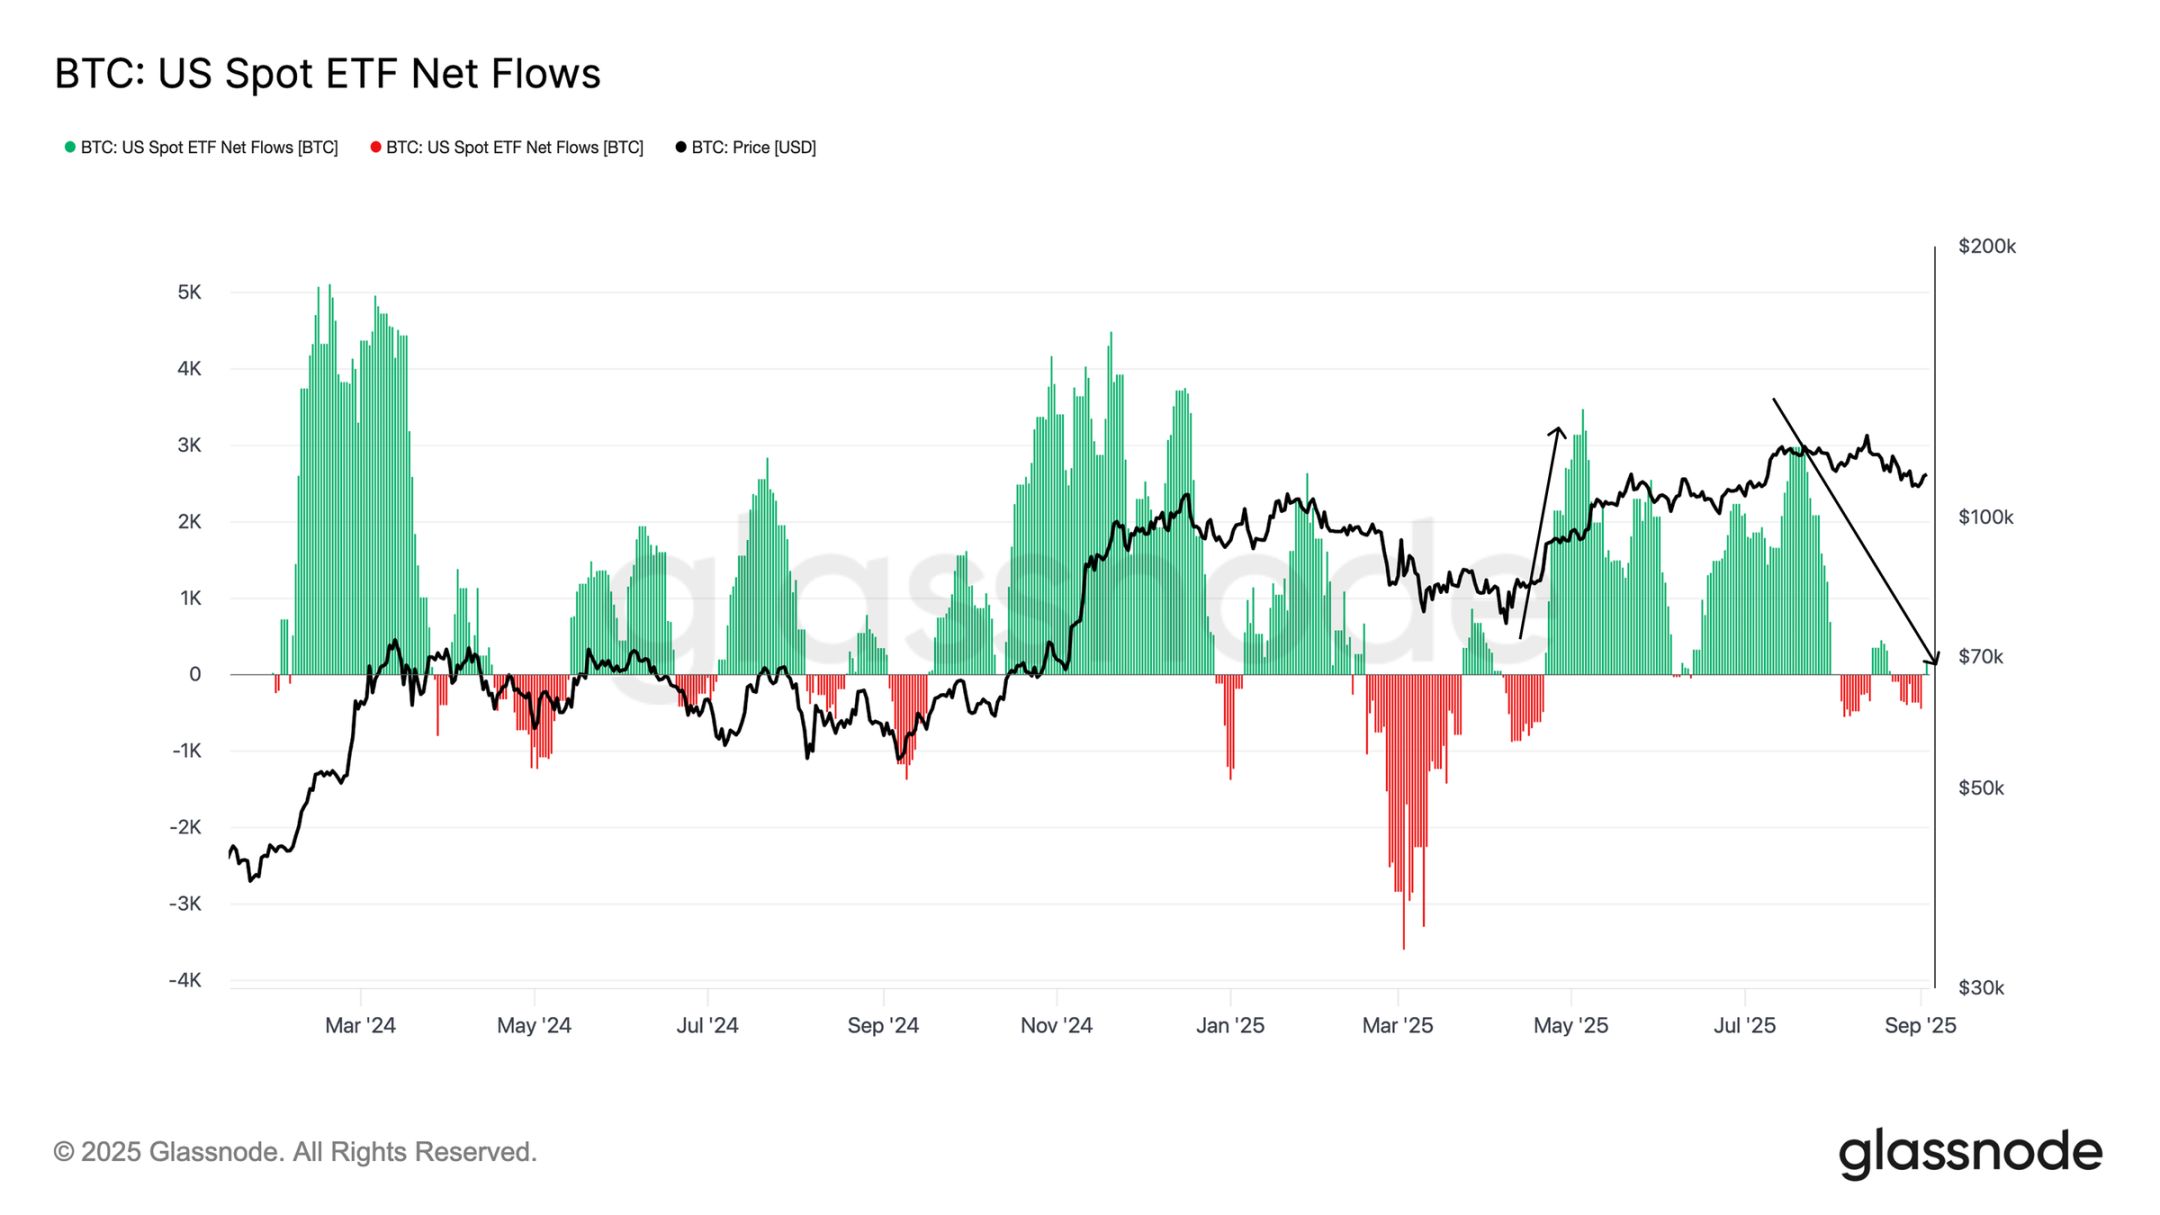
US Bitcoin Spot ETF Net Inflow Chart
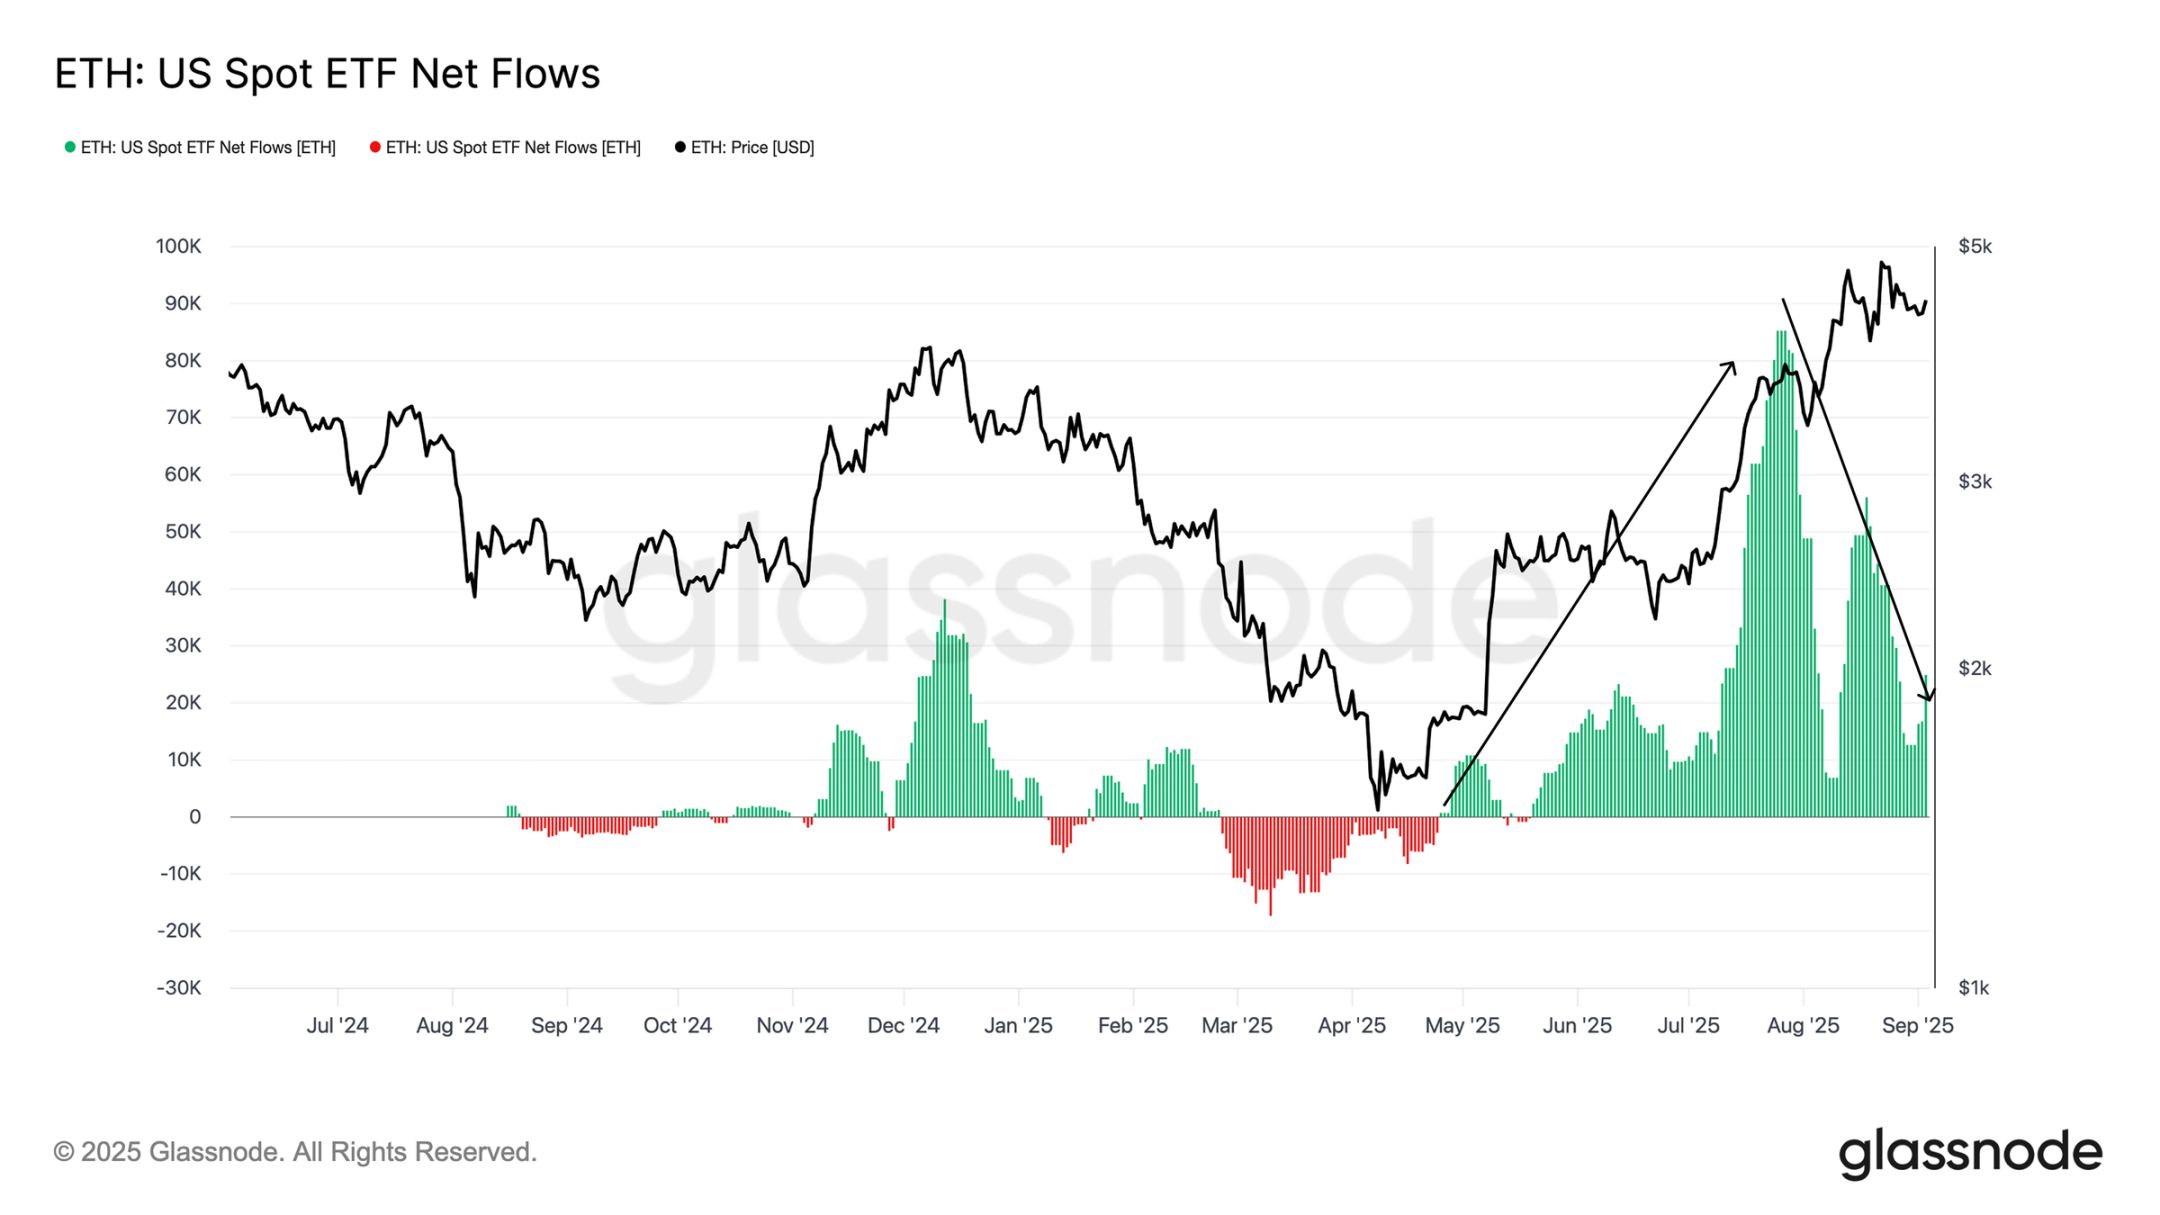
US Ethereum Spot ETF Net Inflow Chart
Structural Differences: Divergence in Bitcoin and Ethereum Demand
Although both Bitcoin and Ethereum saw price increases during the surge in ETF inflows, the underlying structure of traditional financial demand differs between the two. Comparing ETF cumulative flows with the biweekly change in CME open interest clearly reveals this distinction.
For Bitcoin, ETF flows far exceed changes in futures positions, indicating that traditional financial investors mainly express directional demand through spot exposure. Ethereum's situation is more complex: the biweekly change in CME open interest accounts for more than 50% of ETF cumulative flows, meaning a large portion of traditional financial activity involves both "spot exposure" and "spot-futures arbitrage" strategies—a combination of directional bets and neutral arbitrage.
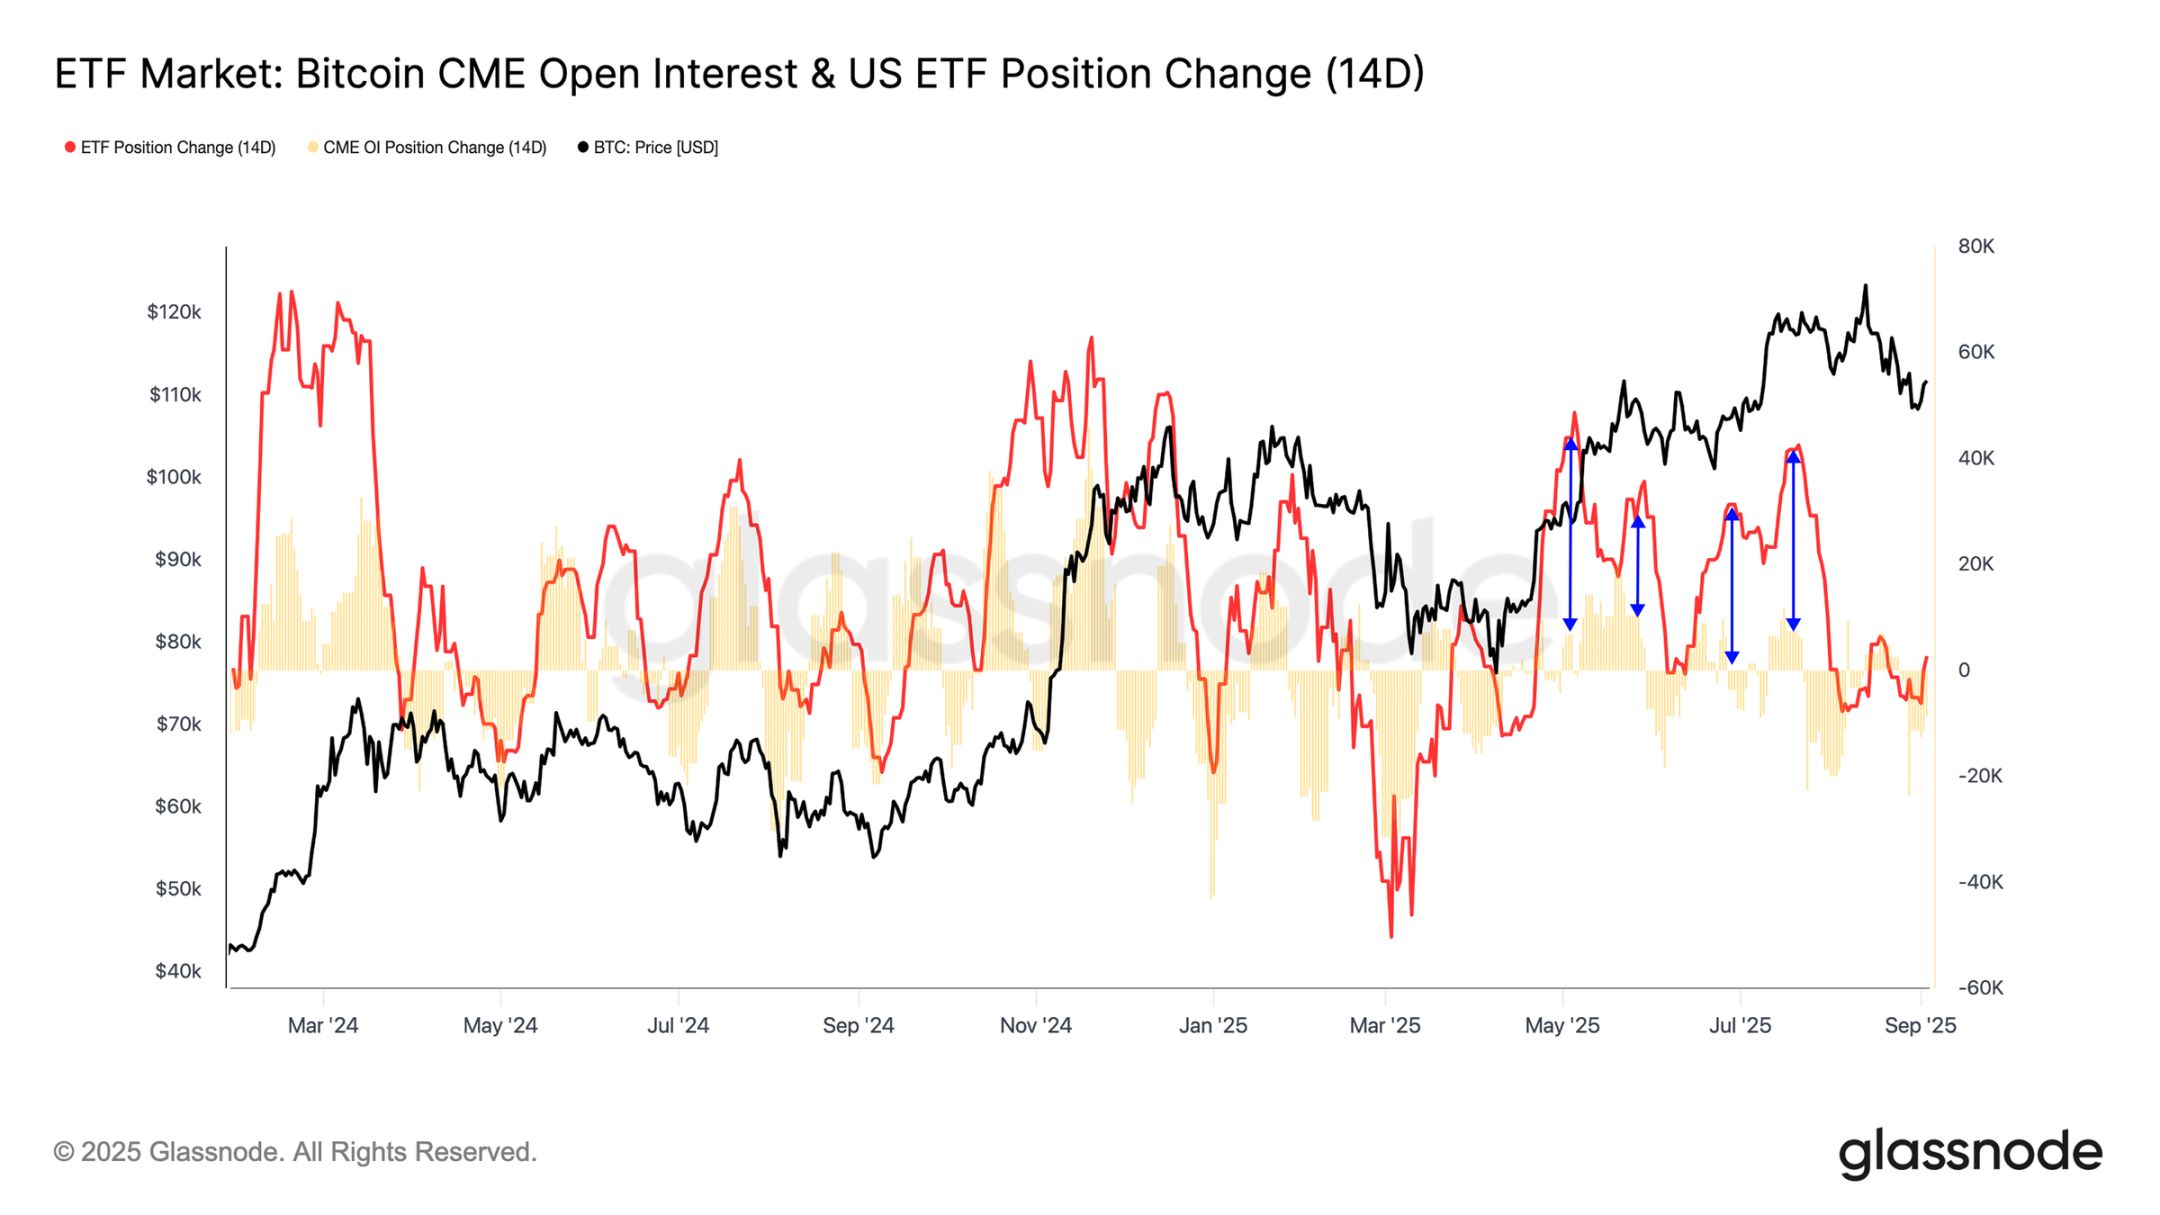
Bitcoin ETF Market and CME Open Interest Chart
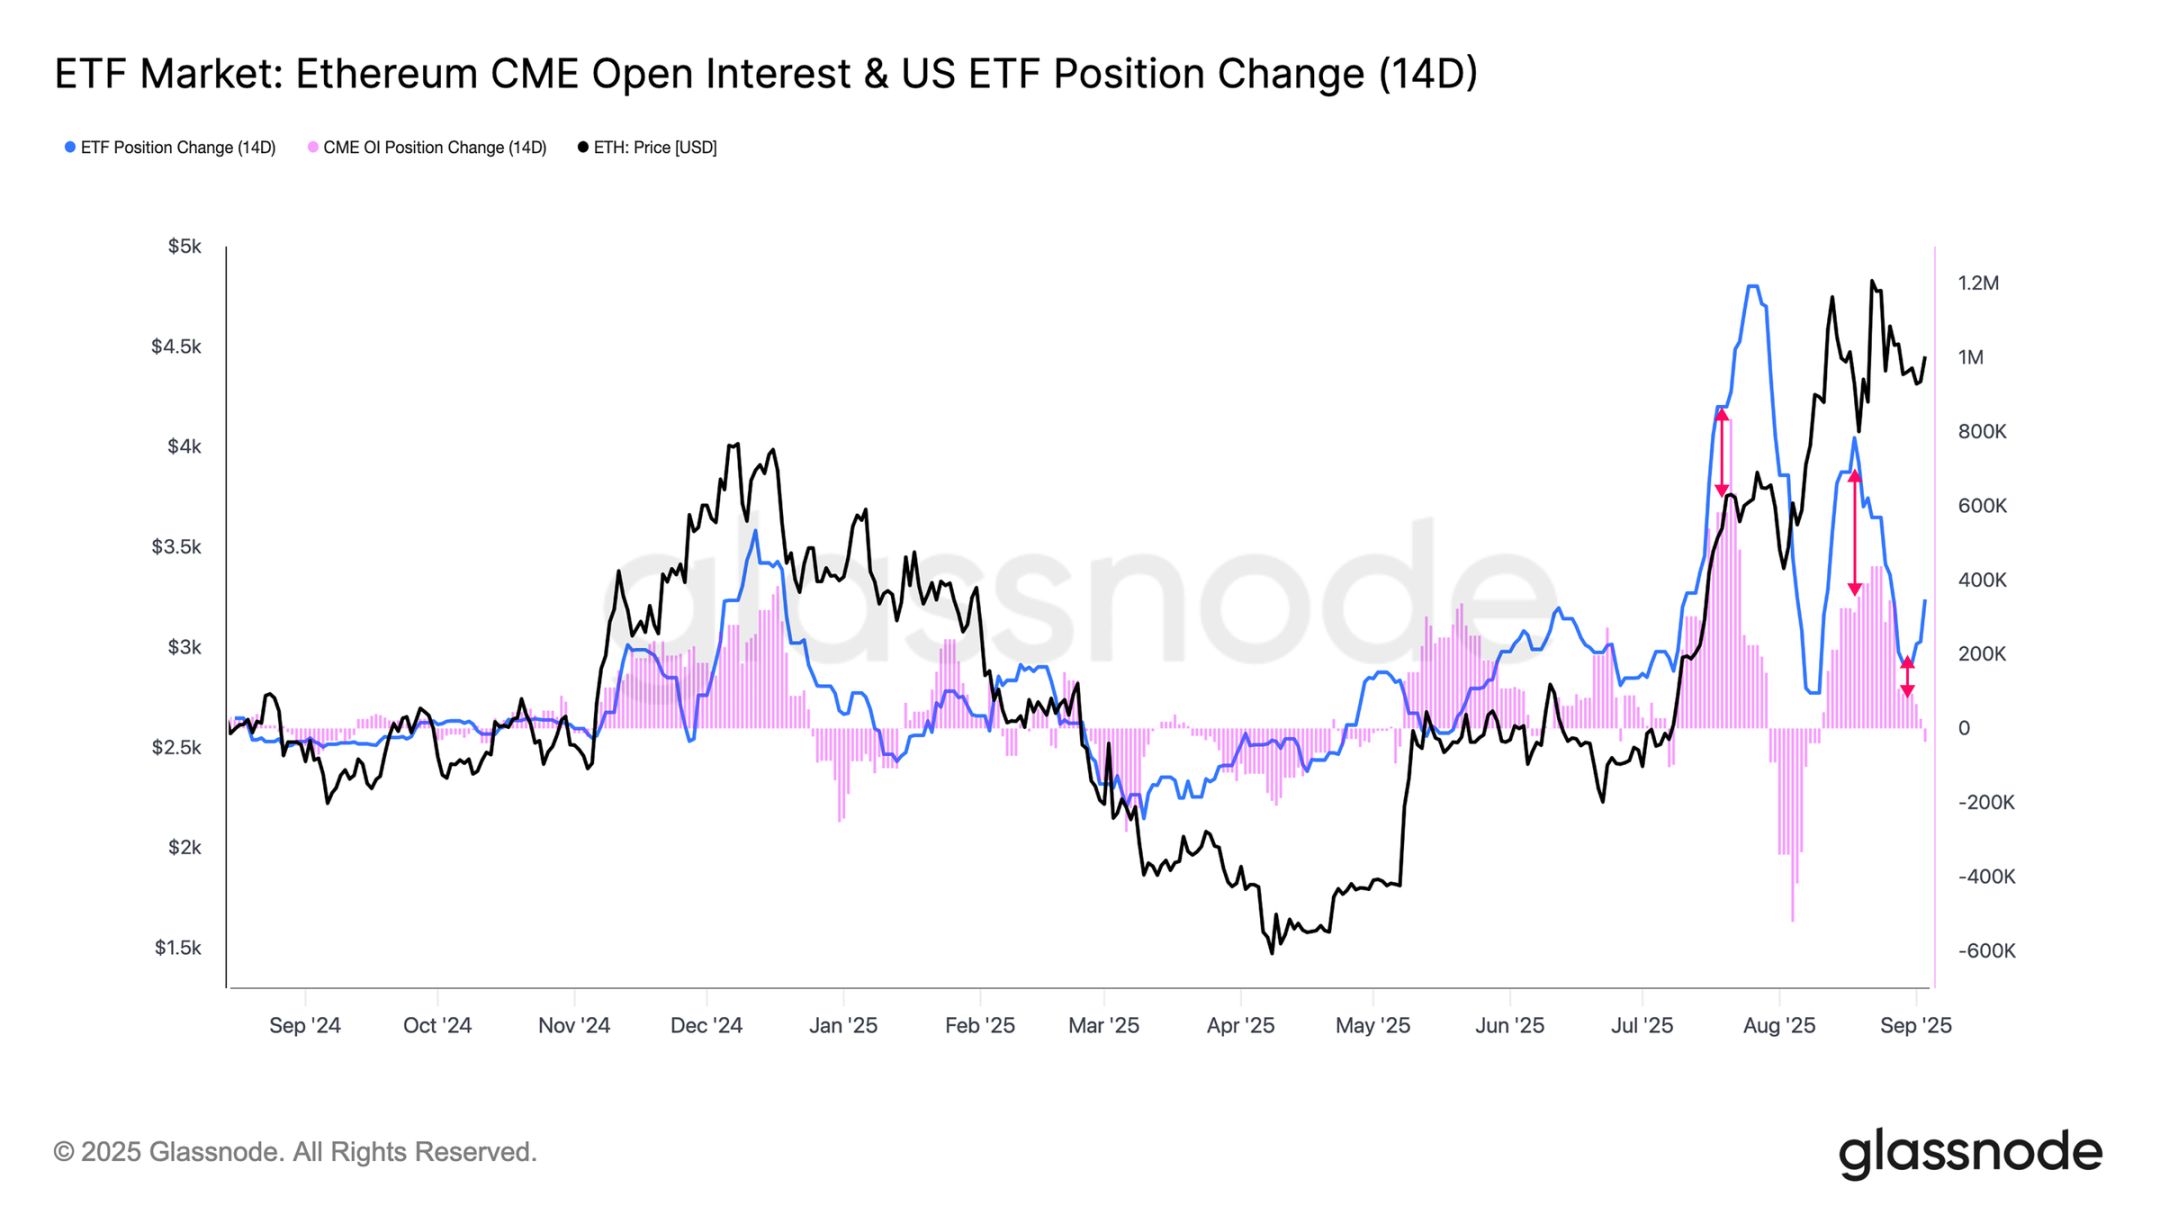
Ethereum ETF Market and CME Open Interest Chart
Conclusion
Bitcoin is currently trading near $112,000, consolidating within the $104,000 - $116,000 range. On-chain signals show that the status of short-term holders remains fragile: although the profitability ratio has rebounded from recent lows, it is not yet strong enough to confirm a renewed uptrend. Regaining $114,000 - $116,000 will bring all short-term holders back to profitability, reinforcing the bull market logic; conversely, falling below $104,000 could trigger a repeat of the previous "post-all-time-high exhaustion" pattern, testing the $93,000 - $95,000 range.
Off-chain indicators also reflect uncertainty: futures funding rates remain neutral, but if demand weakens further, there is a risk of decline; ETF inflows, which previously drove the rally, have slowed significantly. Structurally, Bitcoin ETF flows mainly reflect directional demand, while Ethereum is more of a mix of "spot-futures arbitrage" and spot demand.
Disclaimer: The content of this article solely reflects the author's opinion and does not represent the platform in any capacity. This article is not intended to serve as a reference for making investment decisions.
You may also like
Cobie: Long-term trading
Crypto Twitter doesn't want to hear "get rich in ten years" stories. But that might actually be the only truly viable way.

The central bank sets a major tone on stablecoins for the first time—where will the market go from here?
This statement will not directly affect the Hong Kong stablecoin market, but it will have an indirect impact, as mainland institutions will enter the Hong Kong stablecoin market more cautiously and low-key.

Charlie Munger's Final Years: Bold Investments at 99, Supporting Young Neighbors to Build a Real Estate Empire
A few days before his death, Munger asked his family to leave the hospital room so he could make one last call to Buffett. The two legendary partners then bid their final farewell.

Stacks Nakamoto Upgrade
STX has never missed out on market speculation surrounding the BTC ecosystem, but previous hype was more like "castles in the air" without a solid foundation. After the Nakamoto upgrade, Stacks will provide the market with higher expectations through improved performance and sBTC.
