Ethereum price outlook is at a crossroads: OBV forms a head-and-shoulders pattern near 12.25M suggesting distribution risk, while a MACD bullish crossover and an ascending triangle with $4,800 resistance point to a potential breakout if momentum holds.
-
OBV head-and-shoulders with neckline near 12.25M — break risks bearish continuation.
-
Ascending triangle with $4,800 as the key horizontal resistance for a bullish breakout.
-
MACD crossover and positive histogram signal renewed upside, with projections toward $18,000–$20,000 if momentum sustains.
Ethereum price outlook: OBV shows potential distribution near 12.25M while MACD signals bullish momentum — watch $4,800 for a decisive breakout.
What is Ethereum’s price outlook?
Ethereum price outlook is mixed: on-balance volume (OBV) shows a head-and-shoulders formation that could signal distribution if the 12.25M neckline breaks, while a MACD crossover and an ascending triangle with $4,800 resistance point to renewed bullish continuation if momentum holds.
How does OBV indicate bearish pressure?
OBV tracks cumulative buying and selling pressure. Recent readings rose from roughly 11M to above 12.25M before forming a left shoulder (~12.7M), a head (~13M) and a right shoulder (~12.75M). A decisive drop below the rising neckline at 12.25M would indicate distribution and weaken accumulation signals.
OBV ranged between 9M–11M from May to July, showing limited accumulation. The late-July surge above 12.25M marked heavy buying, but the head-and-shoulders topology now raises caution for bulls.
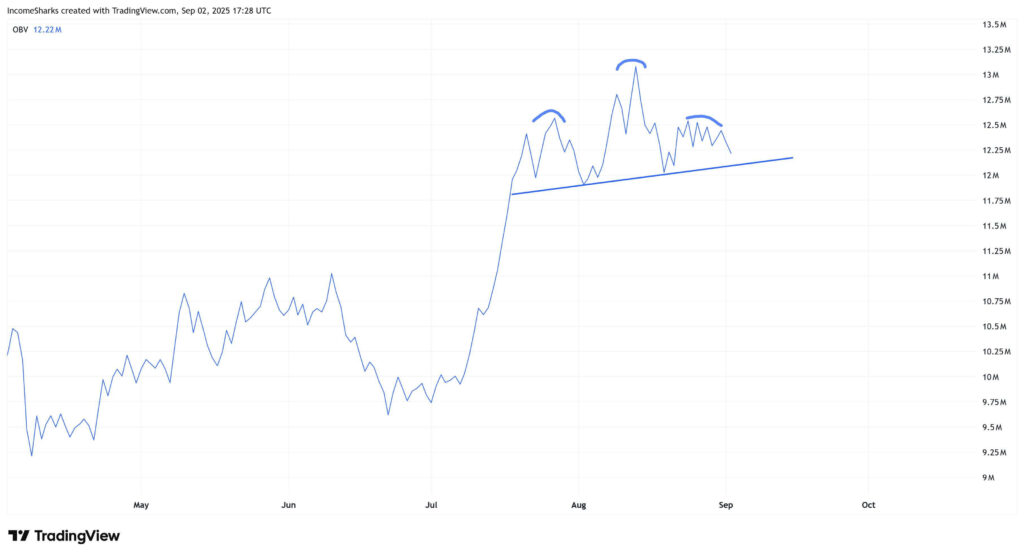
Ethereum price chart, Source: IncomeSharks on X
How does price structure influence the outlook?
Price is consolidating within an ascending triangle with a horizontal resistance near $4,800. The rising trendline has contained price action for months, creating tighter ranges. A confirmed daily close above $4,800 would favor bullish continuation and invalidate near-term downside scenarios tied to OBV failure.
Historically, $4,800 acted as strong resistance during the 2021 cycle, making it a high-conviction level for traders watching breakouts versus false moves.
How does MACD affect bullish probability?
MACD recently formed a bullish crossover and the histogram turned positive, aligning with setups seen in prior major rallies. Analyst Merlijn The Trader notes the crossover resembles late-2020 conditions that preceded large percentage gains, though past performance does not guarantee future results.
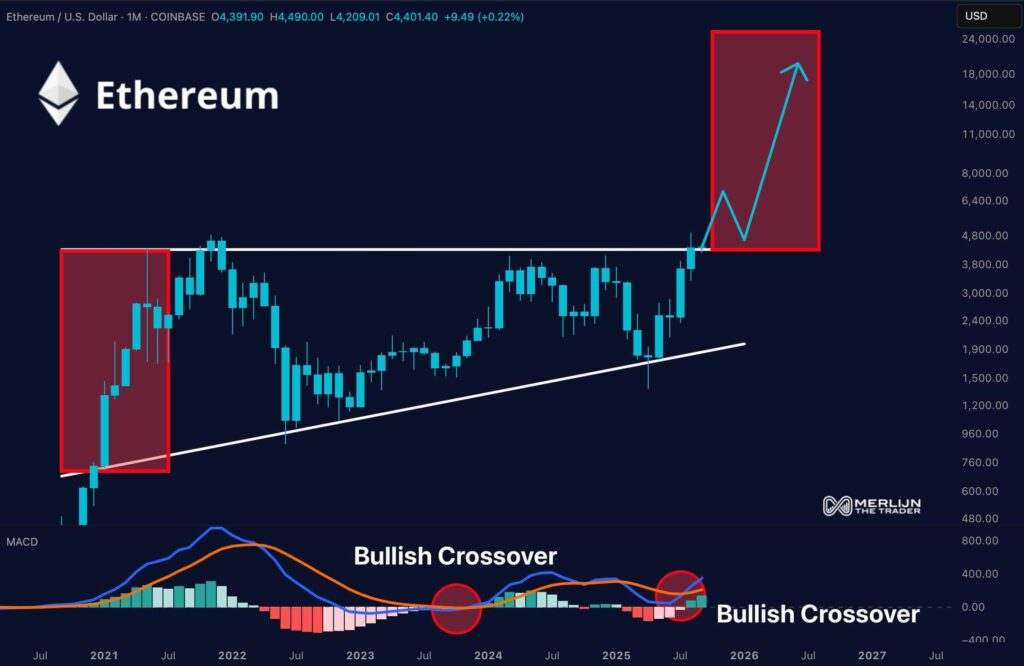
ETH/USD 1-month price chart, Source: Merlijn The Trader on X
The positive histogram suggests increasing momentum; if price retests and clears $4,800, projections show potential extension toward $18,000–$20,000 in an aggressive momentum scenario. Market confirmation and risk management remain essential before assuming trend continuation.
How should traders interpret these signals?
- Monitor OBV: a close below 12.25M increases bearish odds.
- Watch price structure: daily close above $4,800 supports bullish continuation.
- Confirm MACD: sustained positive histogram and MACD line above signal line add conviction.
Indicator Comparison
| OBV | Head-and-shoulders forming | 12.25M (neckline) | Break → distribution; Recovery → invalidates pattern |
| Price Structure | Ascending triangle | $4,800 (resistance) | Break → bullish continuation |
| MACD | Bullish crossover | Histogram positive | Momentum favors upside if sustained |
Frequently Asked Questions
What exact OBV level signals distribution?
A decisive close below 12.25M on OBV would signal distribution and raise the probability of a bearish continuation in Ethereum’s short-term outlook.
How likely is a breakout above $4,800?
Probability increases if price posts a confirmed daily close above $4,800 with MACD histogram staying positive and OBV recovering above 12.75M; without these confirmations, false breakouts remain possible.
Key Takeaways
- Mixed signals: OBV shows a head-and-shoulders while MACD and price structure lean bullish.
- Key levels: 12.25M (OBV neckline) and $4,800 (price resistance) will determine near-term direction.
- Risk management: Traders should wait for confirmation via price closes and indicator alignment before increasing exposure.
Conclusion
This analysis shows a decisive phase for Ethereum’s price outlook: accumulation indicators and momentum conflict near critical levels. Monitor OBV at 12.25M and price action around $4,800 for confirmation. COINOTAG will continue to report updates as on-chain and technical data evolve.