
Bitcoin News Today: Bitcoin's $112K Crossroads: Capitulation or Catalyst?
- Bitcoin (BTC-USD) rebounds near $108,800 amid a critical test of $112K support, with a double-top pattern forming below $124K resistance. - Whale-driven spoofing and liquidity shifts triggered $350M in 24-hour liquidations, heightening volatility risks between $112K and $124K. - Macroeconomic uncertainty, including 2.9% YoY PCE inflation and 87% odds of a September Fed rate cut, complicates near-term price direction. - On-chain metrics show a neutral MVRV ratio (39%) and -0.60% P/L margin, indicating lim
Bitcoin Eyes Breakout as Price Rebounds From Channel Bottom Toward $116K
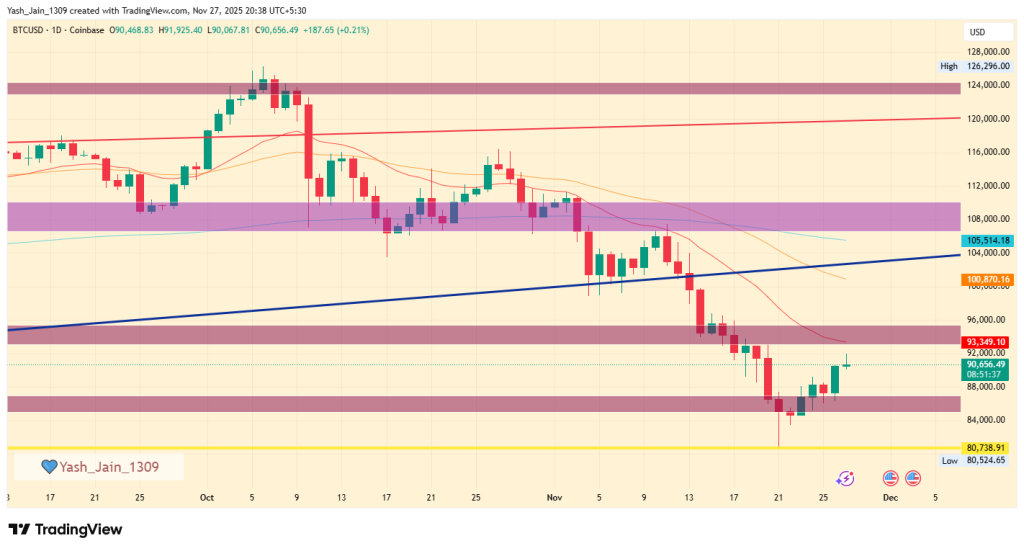
Bitcoin (BTC-USD) has shown renewed signs of potential upward movement after trading near $108,800 amid a critical test of support levels and a volatile market environment shaped by whale activity and macroeconomic uncertainty. A double-top pattern, formed just below the $124,000 resistance level, has become a focal point for traders, with the $112,000 level emerging as a key battleground. A decisive drop below this threshold would confirm bearish momentum and potentially push the price toward $100,000, with further support expected near $96,000, where earlier consolidation occurred in June. Conversely, a rebound above $112,000 and a retest of the $115,700–$118,000 range could invalidate the bearish formation and open the door for a stronger rally.
The market has been influenced by aggressive whale activity, including spoofing strategies and liquidity shifts, which have led to rapid selloffs and significant long-term liquidations. Over $350 million in positions were liquidated within a 24-hour window, contributing to the recent pullback in price. These patterns, part of a recurring cycle of consolidation, capitulation, and breakout, highlight the challenges faced by shorter-term traders and underscore the high volatility risk embedded in the current market structure. Additionally, the thin liquidity profile between $112K and $124K increases the potential for sharp price swings in either direction.
Macro conditions further complicate the outlook for Bitcoin . The U.S. Personal Consumption Expenditures (PCE) inflation index rose 0.3% month-over-month and 2.9% year-over-year, surpassing the Federal Reserve’s 2% target and tightening financial conditions. However, traders have priced in an 87% probability of a rate cut in September, creating a tug-of-war between easing monetary policy and lingering inflationary risks. While historically weak performance in the month of September remains a concern, the recent ruling that most Trump-era tariffs are illegal has introduced a degree of uncertainty. A reduction in global economic pressure may benefit risk assets like Bitcoin, but the near-term impact remains mixed.
On-chain analytics provide additional insight into the current market dynamics. The realized price for short-term holders is at $112,200, and Bitcoin trading below this level suggests a shift in seller advantage. Meanwhile, the Profit/Loss Margin at -0.60% remains well above the historical capitulation threshold of -12%, indicating that panic selling is not yet widespread. The Market Value to Realized Value (MVRV) ratio has cooled to 39%, down from extreme levels above 70–90%, placing Bitcoin in a neutral zone between euphoric profit-taking and deep losses. Such readings historically precede consolidation phases, which can lay the groundwork for the next trend.
Despite near-term technical weakness, Bitcoin’s broader structure reflects sustained institutional demand and ETF inflows, with billions of dollars flowing into BTC-linked products in August. Corporate adoption, energy-sector developments, and hedge-fund accumulation all support a longer-term bullish thesis. However, the absence of a classic capitulation reset remains a point of debate among traders, who are watching for macro catalysts such as Fed policy decisions and global liquidity conditions to determine the next major price direction.
Disclaimer: The content of this article solely reflects the author's opinion and does not represent the platform in any capacity. This article is not intended to serve as a reference for making investment decisions.
You may also like
KAS Price Jumps 66%: Can Momentum Push Kaspa Toward December’s Bigger Targets?
VIRTUAL Price Jumps 17% as Falling Wedge Breakout Signals December Upside
Pi Network News: Can the CiDi Games Partnership Push Pi Beyond $1?
Charles Hoskinson Reveals When Altcoins Like ADA, XRP and ETH Will Hit New All-Time Highs