Bitget App
Trade smarter
Buy cryptoMarketsTradeFuturesEarnWeb3SquareMore
Trade
Spot
Buy and sell crypto with ease
Margin
Amplify your capital and maximize fund efficiency
Onchain
Going Onchain, without going Onchain!
Convert
Zero fees, no slippage
Explore
Launchhub
Gain the edge early and start winning
Copy
Copy elite trader with one click
Bots
Simple, fast, and reliable AI trading bot
Trade
USDT-M Futures
Futures settled in USDT
USDC-M Futures
Futures settled in USDC
Coin-M Futures
Futures settled in cryptocurrencies
Explore
Futures guide
A beginner-to-advanced journey in futures trading
Futures promotions
Generous rewards await
Overview
A variety of products to grow your assets
Simple Earn
Deposit and withdraw anytime to earn flexible returns with zero risk
On-chain Earn
Earn profits daily without risking principal
Structured Earn
Robust financial innovation to navigate market swings
VIP and Wealth Management
Premium services for smart wealth management
Loans
Flexible borrowing with high fund security
Bonk (BONK) To Bounce Back? Key Harmonic Pattern Hints Potential Reversal

Bonk (BONK) To Bounce Back? Key Harmonic Pattern Hints Potential Reversal

CoinsProbeCoinsProbe2025/08/30 22:35
By:Nilesh Hembade

Date: Sat, Aug 30, 2025 | 05:30 AM GMT

The cryptocurrency market has once again entered choppy waters as Ethereum (ETH) slipped to $4,350 from its recent high of $4,954, marking a 7% weekly decline. The pullback has pressured major memecoins , including Solana-based Bonk (BONK).

However, BONK showed relative strength today with a 5% intraday jump, trimming its weekly losses to just 3%. More importantly, the price chart is signaling a harmonic pattern setup that could pave the way for a potential bounceback.

Bonk (BONK) To Bounce Back? Key Harmonic Pattern Hints Potential Reversal image 0 Source: Coinmarketcap

Harmonic Pattern Taking Shape

On the daily chart, BONK appears to be forming a Bearish ABCD harmonic pattern. Despite its bearish name, this pattern often involves a strong bullish CD-leg rally before the token approaches its Potential Reversal Zone (PRZ).

The structure kicked off with a rally from Point A near $0.00001142 up to Point B, followed by a retracement to Point C around $0.00001956, where buyers stepped in near the 200-day moving average (MA). Since then, BONK has shown resilience, climbing back to around $0.00002260, suggesting the CD leg may now be in motion.
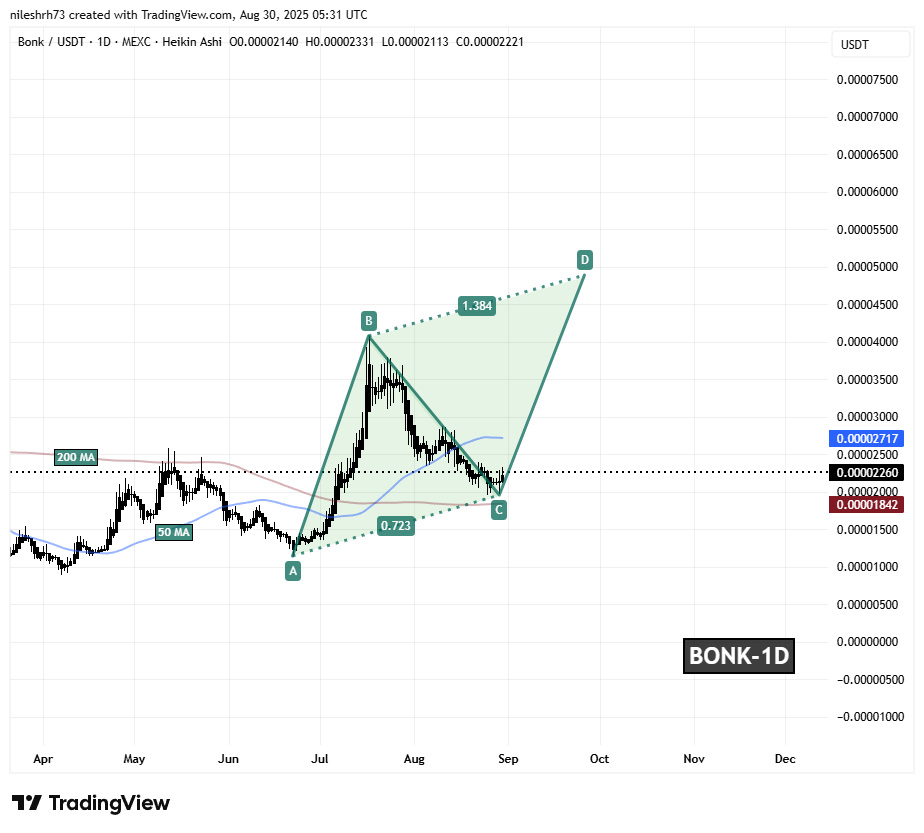
Bonk (BONK) To Bounce Back? Key Harmonic Pattern Hints Potential Reversal image 1 Bonk (BONK) Daily Chart/Coinsprobe (Source: Tradingview)

Critically, BONK is approaching its 50-day MA resistance at $0.00002717. A decisive breakout above this zone could validate the harmonic setup and trigger fresh momentum buying.

What’s Next for BONK?

If bulls manage to push BONK above the 50-day MA, the token could rally toward the 1.38 Fibonacci PRZ at $0.00004890, implying a potential upside of over 116% from current levels.

On the flip side, if BONK loses ground and closes below the 200-day MA support near $0.00001842, the harmonic structure could be invalidated, opening the door to further downside pressure.

0

Disclaimer: The content of this article solely reflects the author's opinion and does not represent the platform in any capacity. This article is not intended to serve as a reference for making investment decisions.

PoolX: Earn new token airdrops
Lock your assets and earn 10%+ APR
Lock now!

You may also like

Solana News Today: Solana's 150ms Finality Revolution: Could It Outrace Ethereum?

- Solana's validator community nears approval of Alpenglow upgrade, slashing block finality to 150ms via Votor and Rotor components. - Upgrade enables 107,540 TPS (vs. Ethereum's 15-45 TPS) and introduces decentralized economic incentives to reduce centralization risks. - 99% voter support with 33% quorum met, positioning Solana to challenge Ethereum in DeFi, gaming, and institutional finance sectors. - Critics warn VAT model may favor large validators, but network's 20+20 resilience model and $8.6B DeFi T

ainvest2025/09/01 02:33
Solana News Today: Solana's 150ms Finality Revolution: Could It Outrace Ethereum?

VANA -116.86% in 24 Hours Amid Sharp Decline in Volatility and Liquidity

- VANA’s 24-hour price drop of 116.86% reflects severe market pressures and liquidity decline. - Analysts attribute the decline to reduced liquidity and shifting investor sentiment toward established assets. - Technical indicators (RSI, MACD) remain bearish, with no stabilizing forces in the ecosystem. - A backtesting strategy evaluates RSI/MACD signals to predict trend continuation or reversal. - Prolonged bearish momentum highlights structural weaknesses in VANA’s market resilience.

ainvest2025/09/01 02:33
VANA -116.86% in 24 Hours Amid Sharp Decline in Volatility and Liquidity

COW -6255.05% in 1 Year Amid Sharp Short- and Mid-Term Price Declines

- COW's price plummeted 127.26% in 24 hours, 6255.05% annually, marking extreme bearish momentum. - Technical indicators show COW trading below key moving averages with RSI in oversold territory, lacking reversal signals. - Analysts warn of continued downward pressure, noting no near-term support levels to halt the decline. - Backtesting strategies suggest adapting to bearish bias using RSI divergence and bearish crossovers for shorting opportunities.

ainvest2025/09/01 02:33
COW -6255.05% in 1 Year Amid Sharp Short- and Mid-Term Price Declines

Bitcoin's 'Red September' Risk: Whale Sell-Offs and Market Vulnerability

- Bitcoin's "Red September" pattern sees average 3.77% monthly declines since 2013, driven by seasonal rebalancing and Fed policy uncertainty. - A $2.7B whale selloff in August 2025 triggered a $100B market crash, highlighting large holders' outsized influence on liquidity. - Institutional profit-taking reached $3.5B in September 2025, with synchronized selling across all wallet groups signaling a maturing market. - Growing institutional adoption (ETF inflows, record futures open interest) has reduced corr

ainvest2025/09/01 02:30
Bitcoin's 'Red September' Risk: Whale Sell-Offs and Market Vulnerability