Shell (SHEL) at Critical Consolidation Point: Is a Breakout to $74.00 a Buy Signal?
- Shell (SHEL) faces a critical $74.00 resistance level after a 5.08% monthly price recovery, with a potential 5.95% upside to $76.71 if broken. - Key support at $72.40 and mixed volume trends highlight the stock's tight balance between bullish momentum and bearish risks. - Technical indicators show conflicting signals: positive moving averages and MACD versus a bearish pivot top and weak volume confirmation. - A breakout above $74.00 could trigger a retest of $76.71, while a breakdown below $72.40 risks i
Shell (SHEL) has entered a pivotal phase in its technical trajectory, marked by a 5.08% price recovery over the past month as of August 30, 2025 [3]. This consolidation period, defined by fluctuating volume and mixed momentum indicators, presents both opportunities and risks for investors. A critical question looms: Can SHEL overcome its immediate resistance at $74.00 to confirm a bullish breakout, or will it falter, triggering a deeper correction?
Support/Resistance Structure: A Tug-of-War for Control
The stock’s current support levels at $72.40 and $73.54 act as psychological floors, while resistance clusters at $73.93 and $74.00 represent key hurdles [2]. A breakout above $74.00 would validate the 5.95% projected rise over the next three months, aligning with the average analyst price target of $76.71 [1]. Conversely, a breakdown below $72.40 could trigger a sell-off, as volume trends suggest waning buying pressure [1]. The 1.05% daily volatility range of +/- $0.93 further underscores the tight balance between buyers and sellers [1].
Volume Trends: A Mixed Signal
While SHEL’s recent 0.0676% dip on August 29, 2025, was accompanied by a 261,000-share drop in volume, this decline is viewed as a positive sign, as volume typically follows price action [1]. However, the absence of a surge in volume during the 5.08% monthly recovery raises questions about the sustainability of the rally. Traders should monitor whether volume increases on a breakout above $74.00, which would confirm institutional participation.
Technical Momentum: Buy Signals Amid Caution
Short-term moving averages (5-day and 50-day) remain above the 200-day average, signaling a “Buy” signal [1]. The 14-day RSI at 51.43 suggests neutrality, while the MACD of 0.110 reinforces a bullish bias [3]. Yet, a pivot top formed on August 28, 2025, has cast a shadow over the near-term outlook, with the stock falling 0.0676% since [1]. This duality—buy signals versus bearish pivot points—highlights the stock’s precarious position.
Breakout Potential and Risks
A successful breakout above $74.00 would likely trigger a retest of the $76.71 price target, offering a 3.78% upside [1]. However, a failed attempt could see the stock retrace to $72.40, where a bounce might reignite the rally. The 90% probability of SHEL trading between $74.57 and $78.40 by late November 2025 [1] adds a layer of optimism , but investors must remain wary of a breakdown below $72.40, which could invalidate the bullish case.
Strategic Takeaway
SHEL’s consolidation phase is a high-stakes test of its technical resilience. While the 5.08% recovery and buy signals from moving averages and MACD suggest a favorable risk-reward profile, the lack of volume confirmation and the looming pivot top necessitate caution. Positioning for a breakout above $74.00 with a stop-loss below $72.40 could balance aggression with risk management.
Disclaimer: The content of this article solely reflects the author's opinion and does not represent the platform in any capacity. This article is not intended to serve as a reference for making investment decisions.
You may also like
Mars Morning News | Ethereum Fusaka upgrade officially activated; ETH surpasses $3,200
The Ethereum Fusaka upgrade has been activated, enhancing L2 transaction capabilities and reducing fees; BlackRock predicts accelerated institutional adoption of cryptocurrencies; cryptocurrency ETF inflows have reached a 7-week high; Trump nominates crypto-friendly regulatory officials; Malaysia cracks down on illegal Bitcoin mining. Summary generated by Mars AI. The accuracy and completeness of this summary are still undergoing iterative updates.

Do you think stop-losses can save you? Taleb exposes the biggest misconception: all risks are packed into a single blow-up point.
Nassim Nicholas Taleb's latest paper, "Trading With a Stop," challenges traditional views on stop-loss orders, arguing that stop-losses do not reduce risk but instead compress and concentrate risk into fragile breaking points, altering market behavior patterns. Summary generated by Mars AI. The accuracy and completeness of this summary are still being iteratively improved by the Mars AI model.

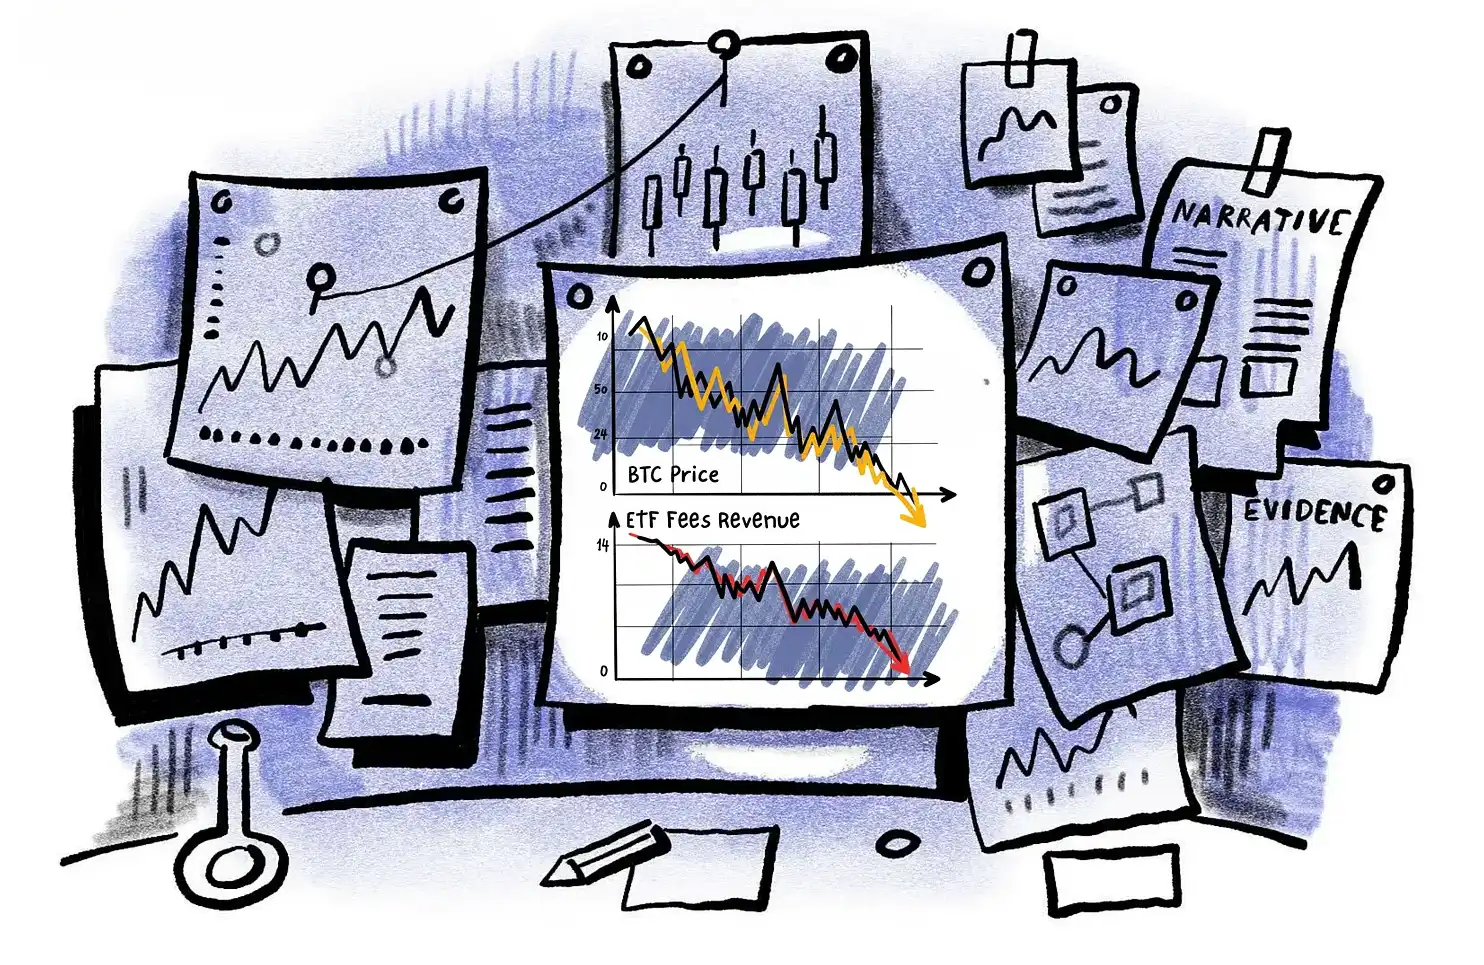
With capital outflows from crypto ETFs, can issuers like BlackRock still make good profits?
BlackRock's crypto ETF fee revenue has dropped by 38%, and its ETF business is struggling to escape the cyclical curse of the market.

Incubator MEETLabs today launched the large-scale 3D fishing blockchain game "DeFishing". As the first blockchain game on the GamingFi platform, it implements a dual-token P2E system with the IDOL token and the platform token GFT.
MEETLabs is an innovative lab focused on blockchain technology and the cryptocurrency sector, and also serves as the incubator for MEET48.
