Pi Coin Price Might Record Another All-Time Low As Key Indicators Turn Bearish

Pi Coin has corrected nearly 1% in the past day and over 6% in a week. With Chaikin Money Flow slipping, bull bear power stalling, and a hidden bearish RSI divergence emerging, the token risks fresh lows unless bulls step in.
Pi Coin price has slipped nearly 1% in the past 24 hours and is down 6.5% over the past week, underperforming the broader market.
While most tokens tend to stage short-lived rebounds during corrections, technical and on-chain signals suggest PI’s downtrend is far from over.
Buyers Fail to Regain Control as Selling Pressure Persists
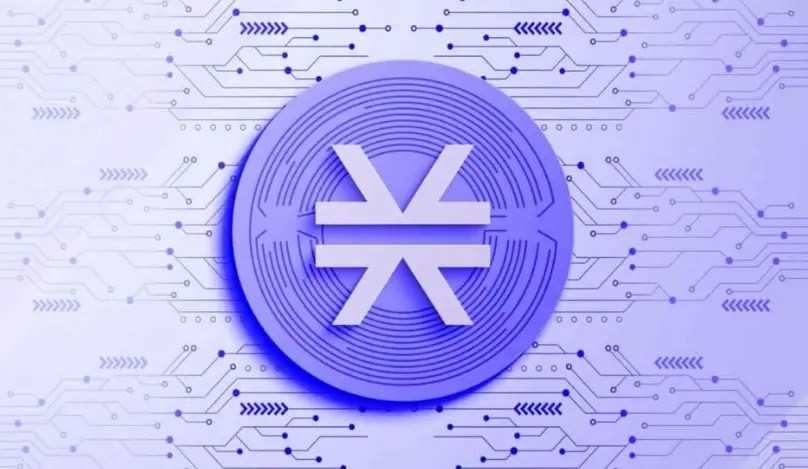
The Chaikin Money Flow (CMF), which tracks capital inflows and outflows, briefly moved higher earlier in August, hinting at rising demand. But the latest reading has dropped back below zero, confirming that selling pressure still outweighs capital inflows.
For PI, this shift suggests buyers attempted to regain control but failed to sustain it.
 Pi Coin Inflows Dropping Under Zero:
TradingView
Pi Coin Inflows Dropping Under Zero:
TradingView
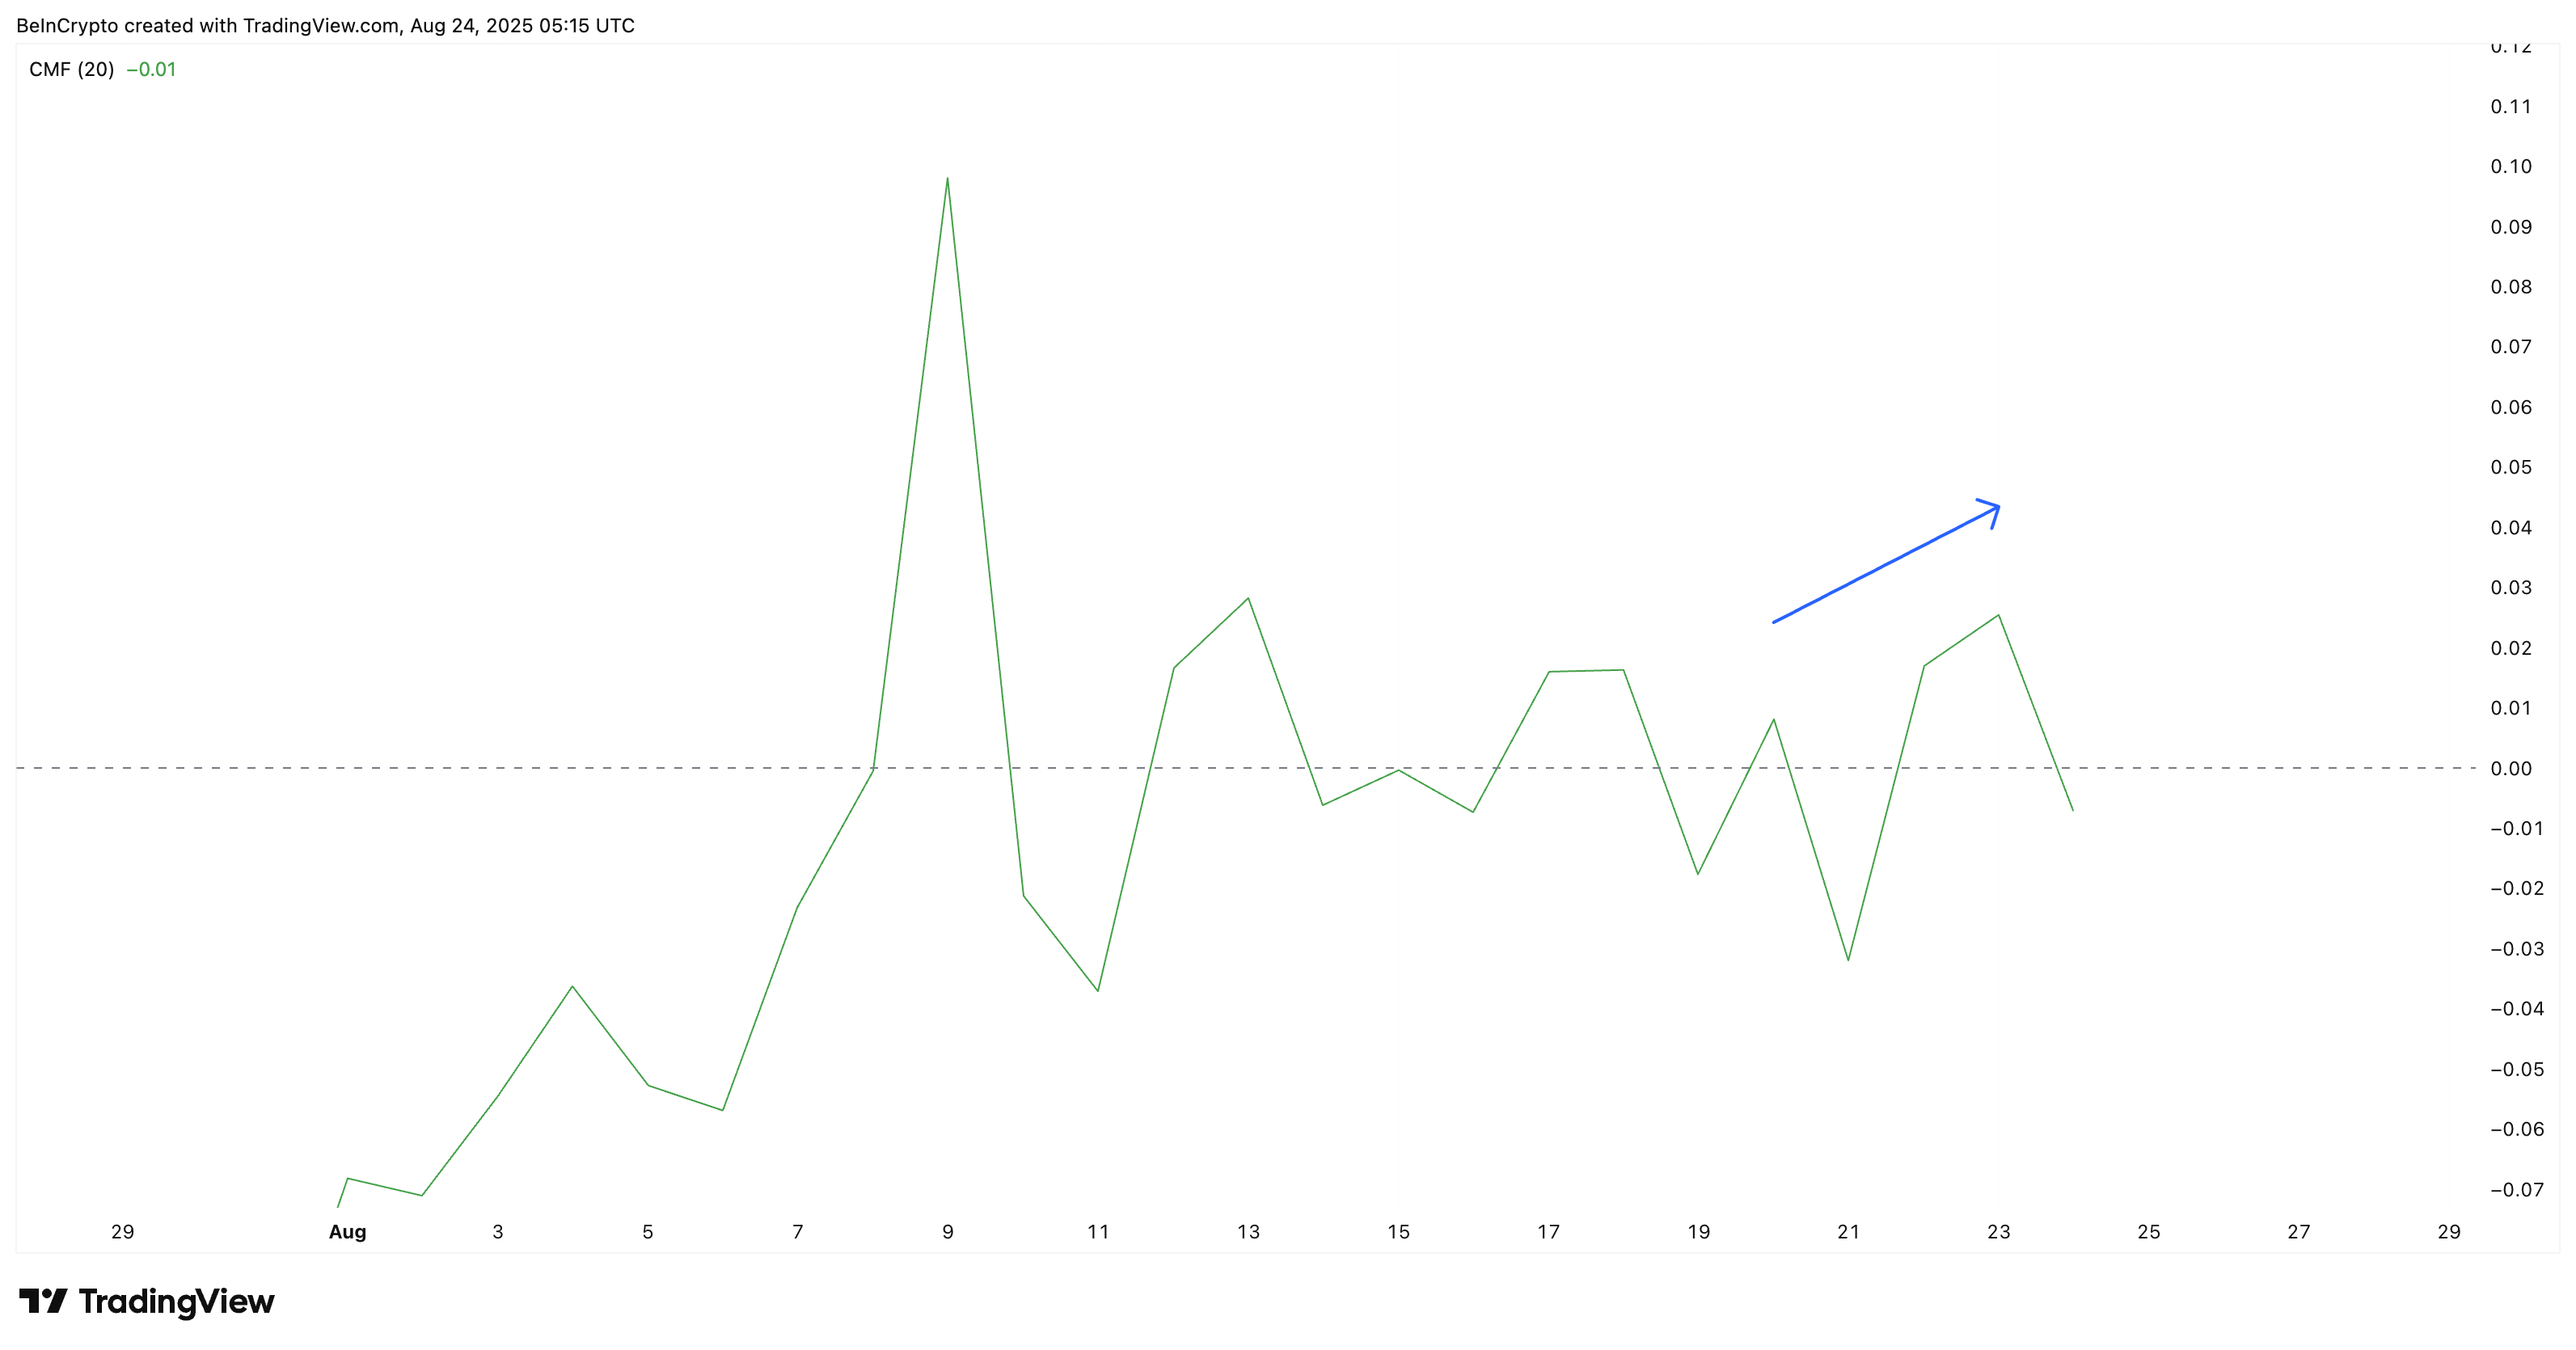
The Bull Bear Power (BBP) reinforces the bearish picture. It’s an indicator that gauges whether buyers (bulls) or sellers (bears) control the market.
While the indicator shows that bearish strength has eased slightly, the last two sessions have remained flat. This suggests that bulls attempted a push but failed to overpower sellers.
 Pi Coin Bears Firmly In Control:
TradingView
Pi Coin Bears Firmly In Control:
TradingView
When paired with CMF’s negative reading, the data suggests that selling pressure is still firmly in control despite buyers trying to undo the bearish momentum.
Want more token insights like this? Sign up for Editor Harsh Notariya’s Daily Crypto Newsletter
Hidden Divergence Confirms Bearish Bias As Key PI Price Levels Come In Focus
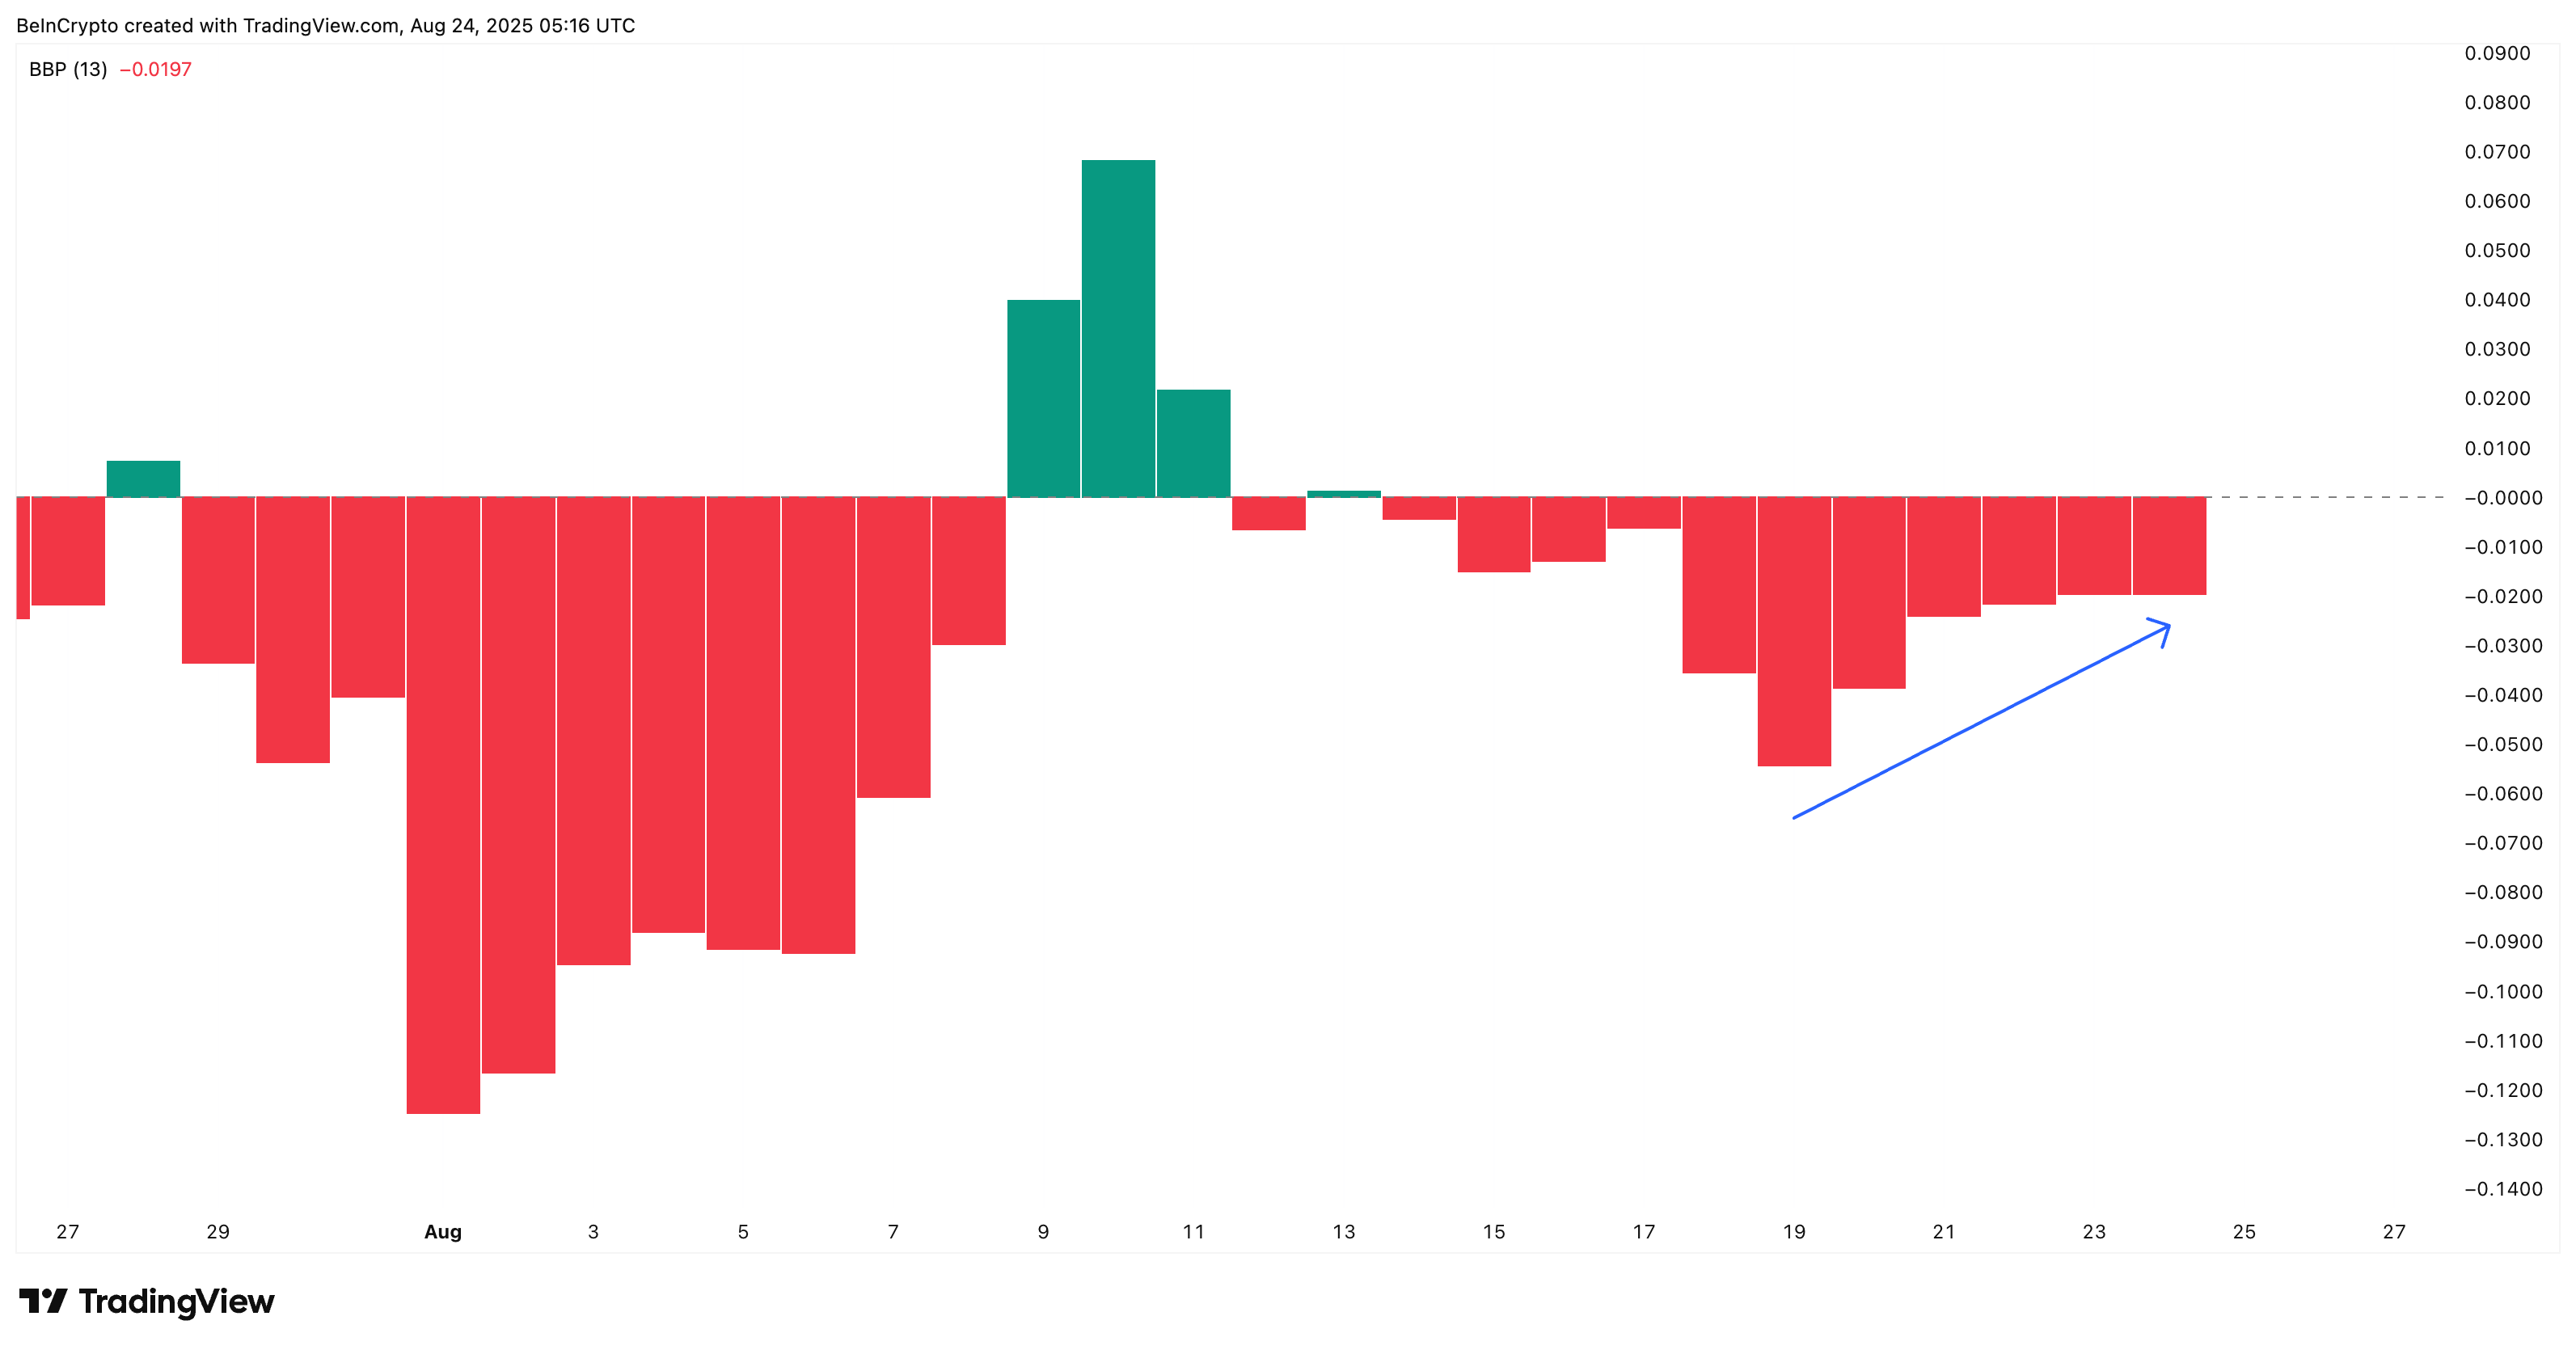
The weakness seen in CMF and BBP is echoed by momentum signals. The Relative Strength Index (RSI) has formed a hidden bearish divergence.
This means while PI’s price chart shows lower highs, the RSI posted higher highs near the mid-40s. This disconnect indicates momentum isn’t translating into upward price action, reinforcing the bearish bias.
The Relative Strength Index (RSI) measures the speed and strength of price moves, showing whether an asset is overbought or oversold. A hidden bearish divergence occurs when the price makes lower highs while the RSI makes higher highs.
This signals that even though momentum seems stronger, sellers still control the trend, and the downtrend is likely to continue.
 Pi Coin Price Analysis:
TradingView
Pi Coin Price Analysis:
TradingView
This kind of hidden bearish divergence emphasises the continuation of the downtrend for the Pi Coin price. The pattern flashing on the daily chart (longer timeframe) might be the key reason why a new Pi Coin price low is imminent.
Currently trading near $0.359, the PI price faces strong support at $0.350. A breakdown below this level could accelerate losses toward $0.339 and $0.322, with fresh all-time lows likely if $0.322 is breached.
On the upside, bulls would need to reclaim $0.377 and then $0.408 to reverse the structure; a move that looks unlikely unless inflows return decisively.
Disclaimer: The content of this article solely reflects the author's opinion and does not represent the platform in any capacity. This article is not intended to serve as a reference for making investment decisions.
You may also like
Cobie: Long-term trading
Crypto Twitter doesn't want to hear "get rich in ten years" stories. But that might actually be the only truly viable way.
The central bank sets a major tone on stablecoins for the first time—where will the market go from here?
This statement will not directly affect the Hong Kong stablecoin market, but it will have an indirect impact, as mainland institutions will enter the Hong Kong stablecoin market more cautiously and low-key.

Charlie Munger's Final Years: Bold Investments at 99, Supporting Young Neighbors to Build a Real Estate Empire
A few days before his death, Munger asked his family to leave the hospital room so he could make one last call to Buffett. The two legendary partners then bid their final farewell.

Stacks Nakamoto Upgrade
STX has never missed out on market speculation surrounding the BTC ecosystem, but previous hype was more like "castles in the air" without a solid foundation. After the Nakamoto upgrade, Stacks will provide the market with higher expectations through improved performance and sBTC.