SHIB price is modestly bullish after a 1.62% 24‑hour gain, breaking hourly resistance near $0.00001253 and testing $0.00001264. If daily close holds above that level, short-term targets lie at $0.000013–$0.00001350, with sideways risk between $0.000012–$0.000014. Data from CoinMarketCap and TradingView support the view.
-
Bullish momentum: SHIB broke hourly resistance and is testing $0.00001264 with potential to reach $0.000013–$0.00001350.
-
Short-term range: Expect consolidation between $0.000012 and $0.000014 unless daily close confirms a breakout.
-
Market data: SHIB rose 1.62% in 24h and trades at $0.00001278 at press time (CoinMarketCap, TradingView reference).
SHIB price climbs 1.62% as bulls test $0.00001264 resistance; SHIB/USD updates, short-term targets to $0.000013–$0.00001350, and key trading levels — read now.
Published: 2025-08-22 | Updated: 2025-08-22 | Author: COINOTAG
The end of the week is bullish for most of the coins, according to CoinMarketCap.
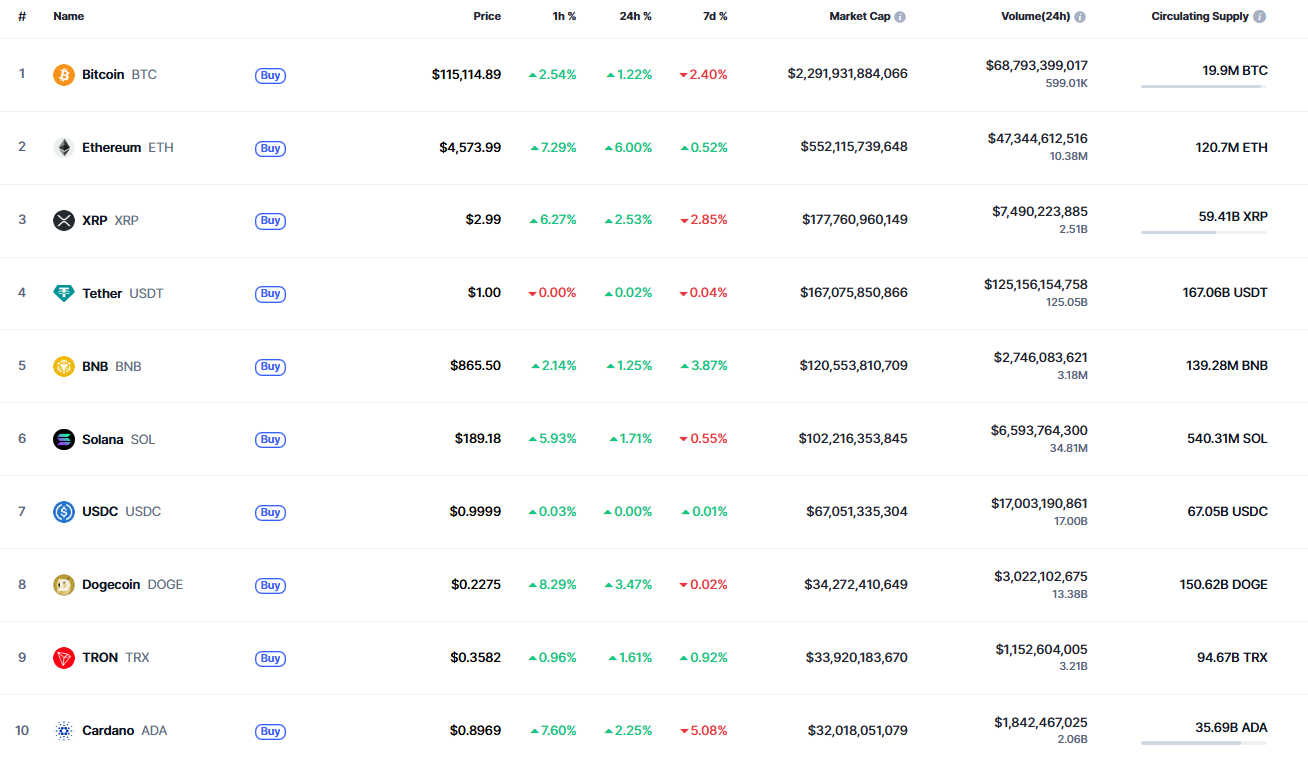
Top coins by CoinMarketCap
What is the current SHIB price outlook?
SHIB price shows a short-term bullish bias after a 1.62% gain in 24 hours and an hourly resistance break near $0.00001253. Bulls must secure a daily close at or above $0.00001264 to support moves toward $0.000013–$0.00001350; failure to hold may keep SHIB in a $0.000012–$0.000014 range.
How did SHIB reach this level and what technical signals matter?
Hourly charts show a clear breach of the local resistance at $0.00001253. Volume on intraday candles increased modestly during the breakout, supporting the move. Traders should watch the daily candle close and the immediate support at $0.000012 to gauge conviction. Coinotag analysis highlights the importance of $0.00001264 as the next confirmation level.
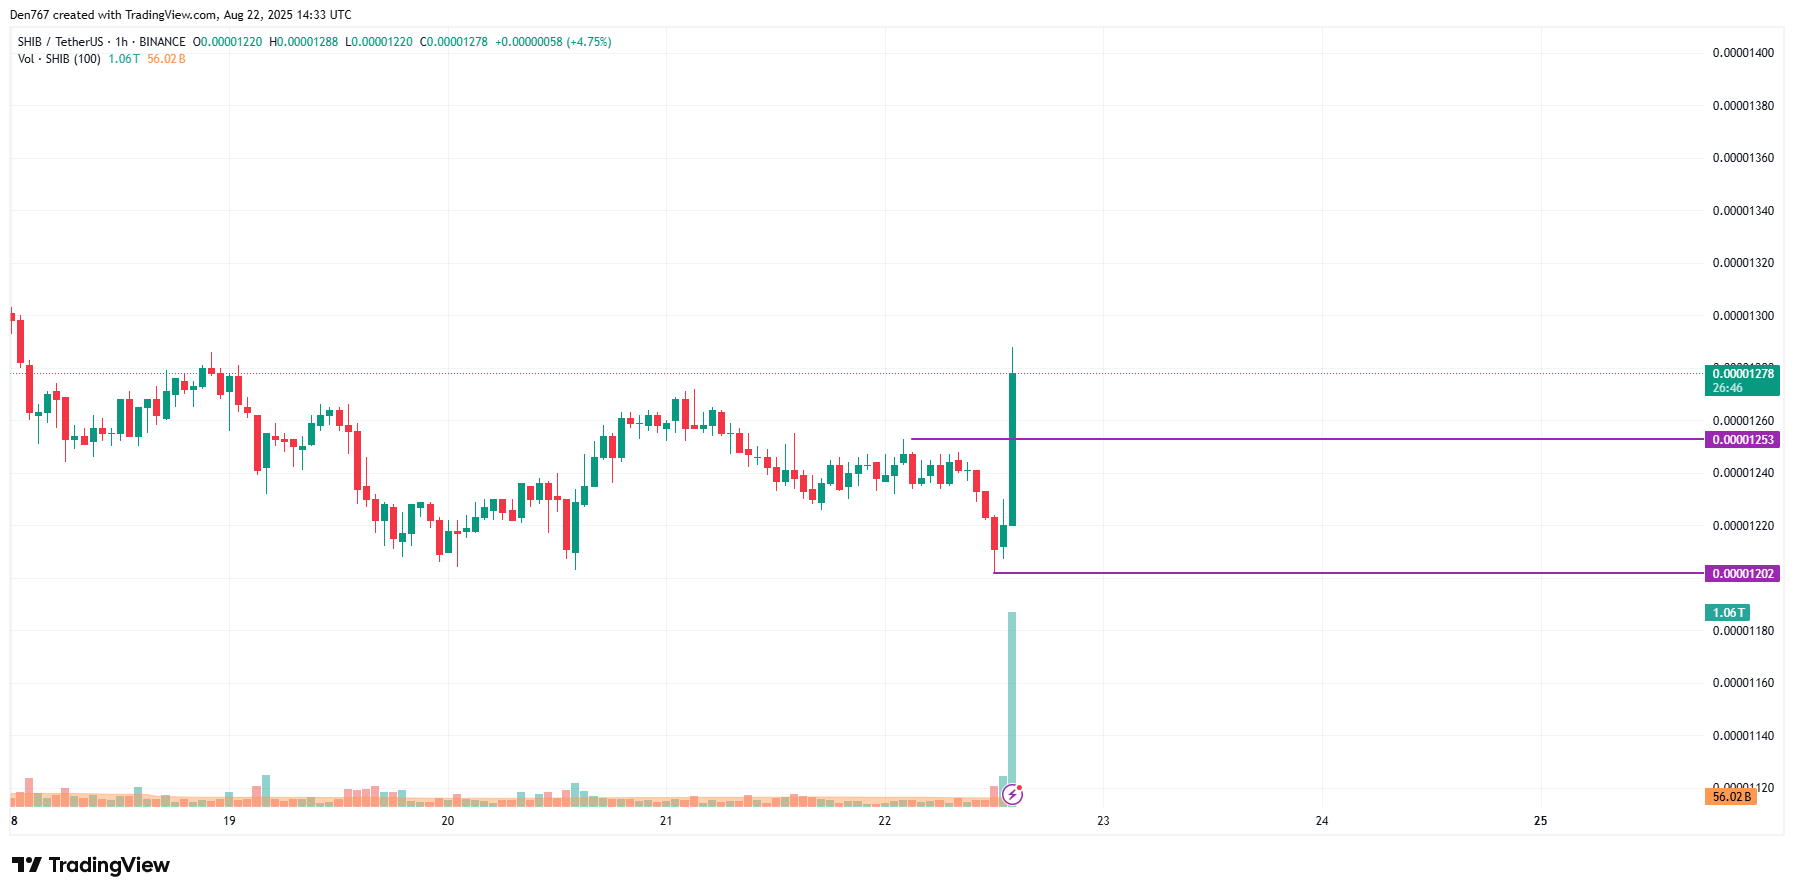
Image by TradingView
On the hourly chart, the price of SHIB has broken the local resistance of $0.00001253. If bulls can hold the gained initiative and the daily bar closes nearby or above, the growth may continue to the $0.000013 area tomorrow.
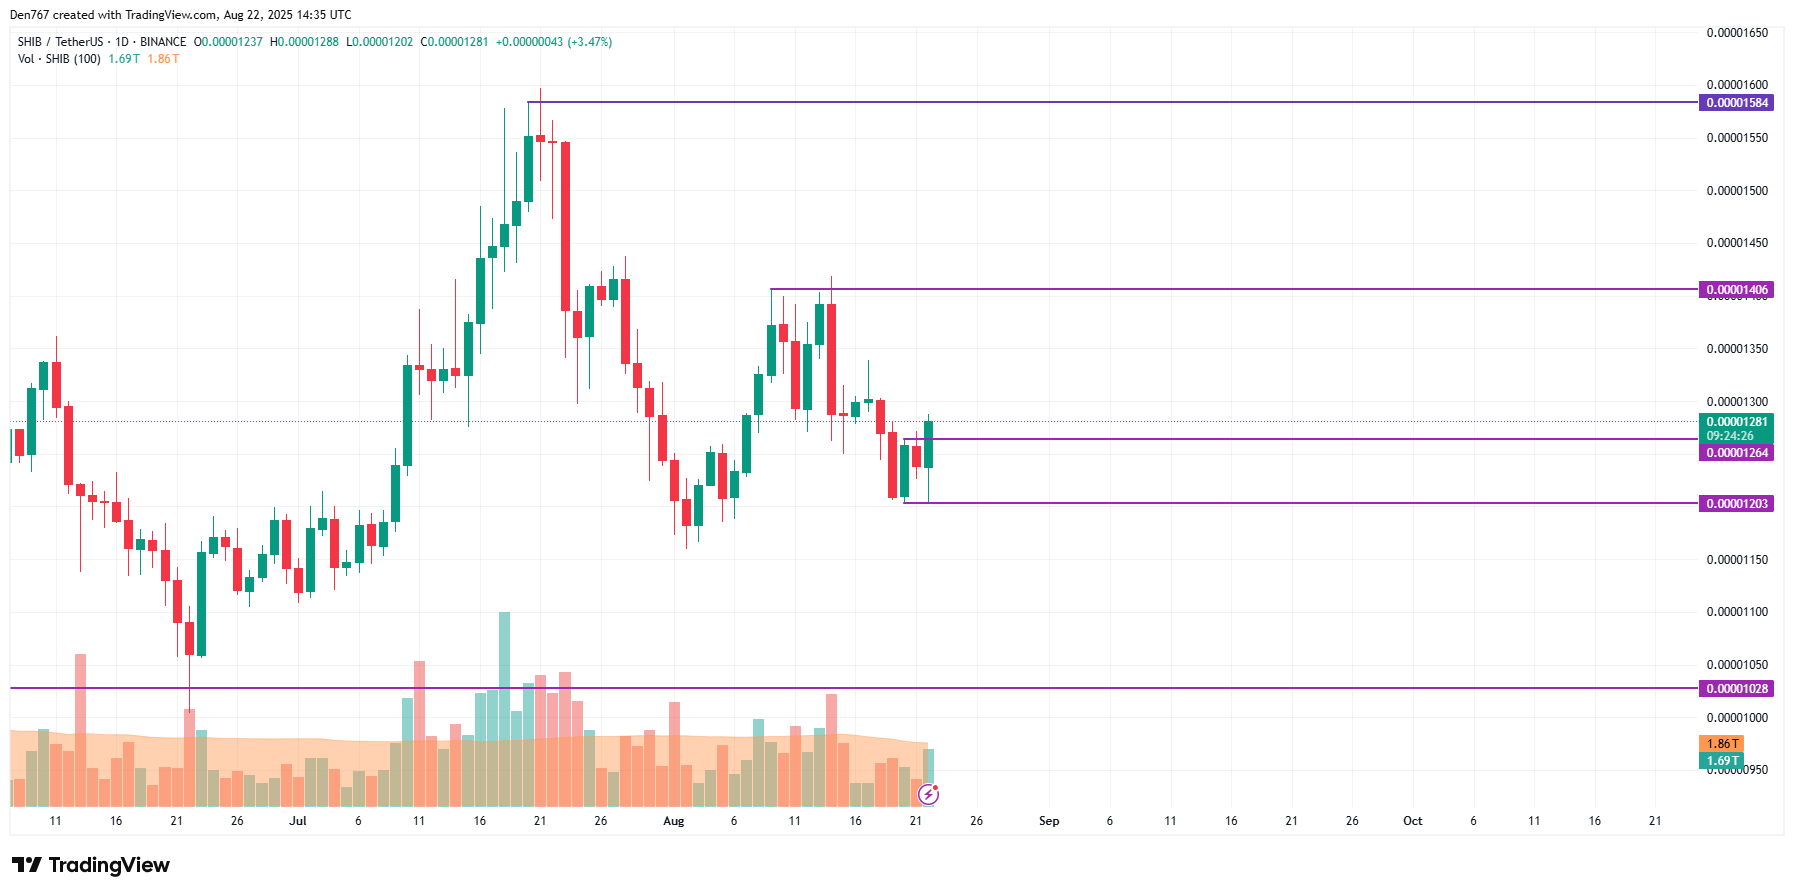
Image by TradingView
From a longer-term perspective, midterm indicators show no clear dominance by either side. SHIB remains some distance from major multi-month levels, so a period of sideways trading around $0.000012–$0.000014 is plausible if momentum fades.
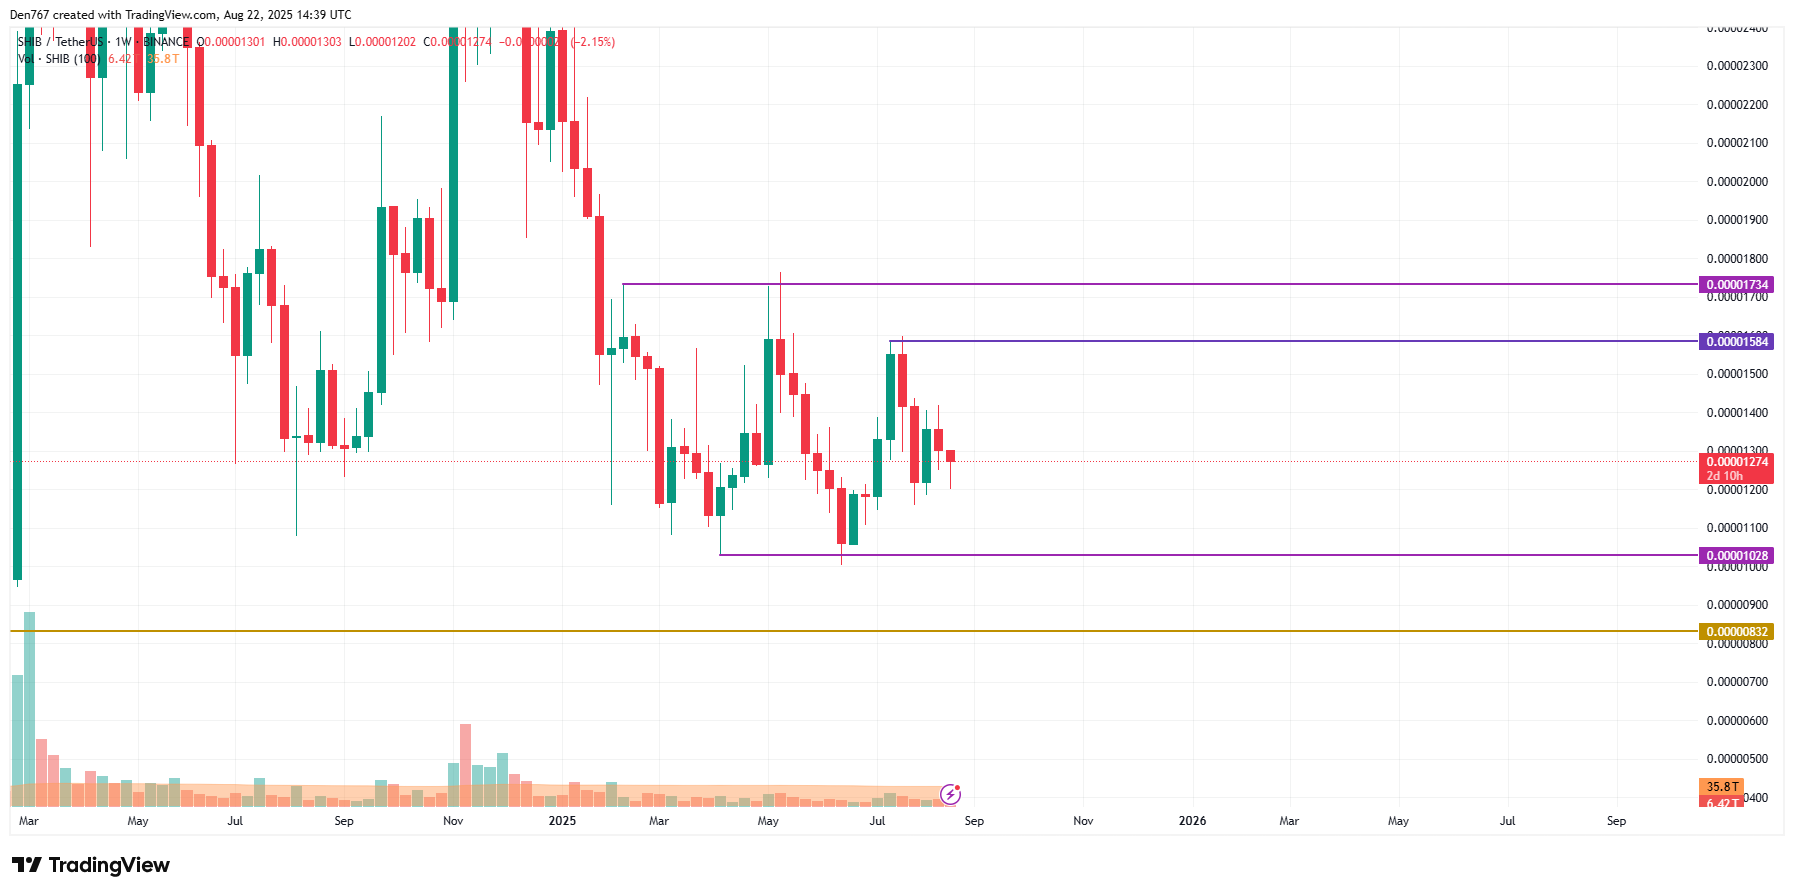
Image by TradingView
SHIB is trading at $0.00001278 at press time. This price reflects a modest intraday recovery compared with key hourly resistance levels and aligns with broader market strength reported on CoinMarketCap.
Frequently Asked Questions
What are the immediate targets for SHIB/USD?
Immediate targets for SHIB/USD are $0.000013 and a secondary target at $0.00001350, provided the daily close confirms support above $0.00001264. Otherwise, expect consolidation between $0.000012 and $0.000014.
How should traders manage risk on SHIB now?
Use tight position sizing and set stops below $0.000012 for short-term long trades. Monitor daily closes and intraday volume for confirmation. Adjust risk if price falls below the $0.000012 support area.
Key Takeaways
- Bullish breakout: SHIB has broken hourly resistance near $0.00001253 and is testing $0.00001264.
- Targets: Short-term upside targets are $0.000013 and $0.00001350 if daily close holds.
- Risk management: Sideways risk between $0.000012–$0.000014; use stops and position sizing accordingly.
Conclusion
This COINOTAG analysis shows a modest short-term bullish case for SHIB price after a 1.62% 24‑hour rise and an hourly resistance break. Traders should watch the $0.00001264 daily close for confirmation and manage risk around $0.000012. For continued updates, monitor CoinMarketCap data and TradingView charts as the market evolves.
| 24h change | +1.62% |
| Current price | $0.00001278 |
| Immediate resistance | $0.00001264 / $0.000013 |
| Support | $0.000012 |
| Short-term range | $0.000012–$0.000014 |