XLM’s Grim Price Outlook Faces One Unlikely Chance of Recovery

XLM’s short-term bullish hopes have dimmed after a bearish EMA crossover and pennant breakdown. But a heavily short-biased liquidation setup might be the one unlikely source of upside, if the broader market triggers a squeeze.
Stellar’s recent breakout is quickly fading, with XLM down over 6% in the past week and wiping out its short-term momentum.
Despite a 41% gain over three months, trends suggest sellers are regaining control. Moreover, hopes for a rebound hinge on a fragile, unlikely market imbalance.
EMA Crossover Flashes a Clear Warning, Bearish Power Builds
On the 4-hour chart, the XLM price has now fallen below all four EMAs – the 20, 50, 100, and 200-period exponential moving averages. Most notably, a bearish EMA crossover has just formed, where the 50 EMA (orange line) has dropped below the 100 EMA (sky blue line).
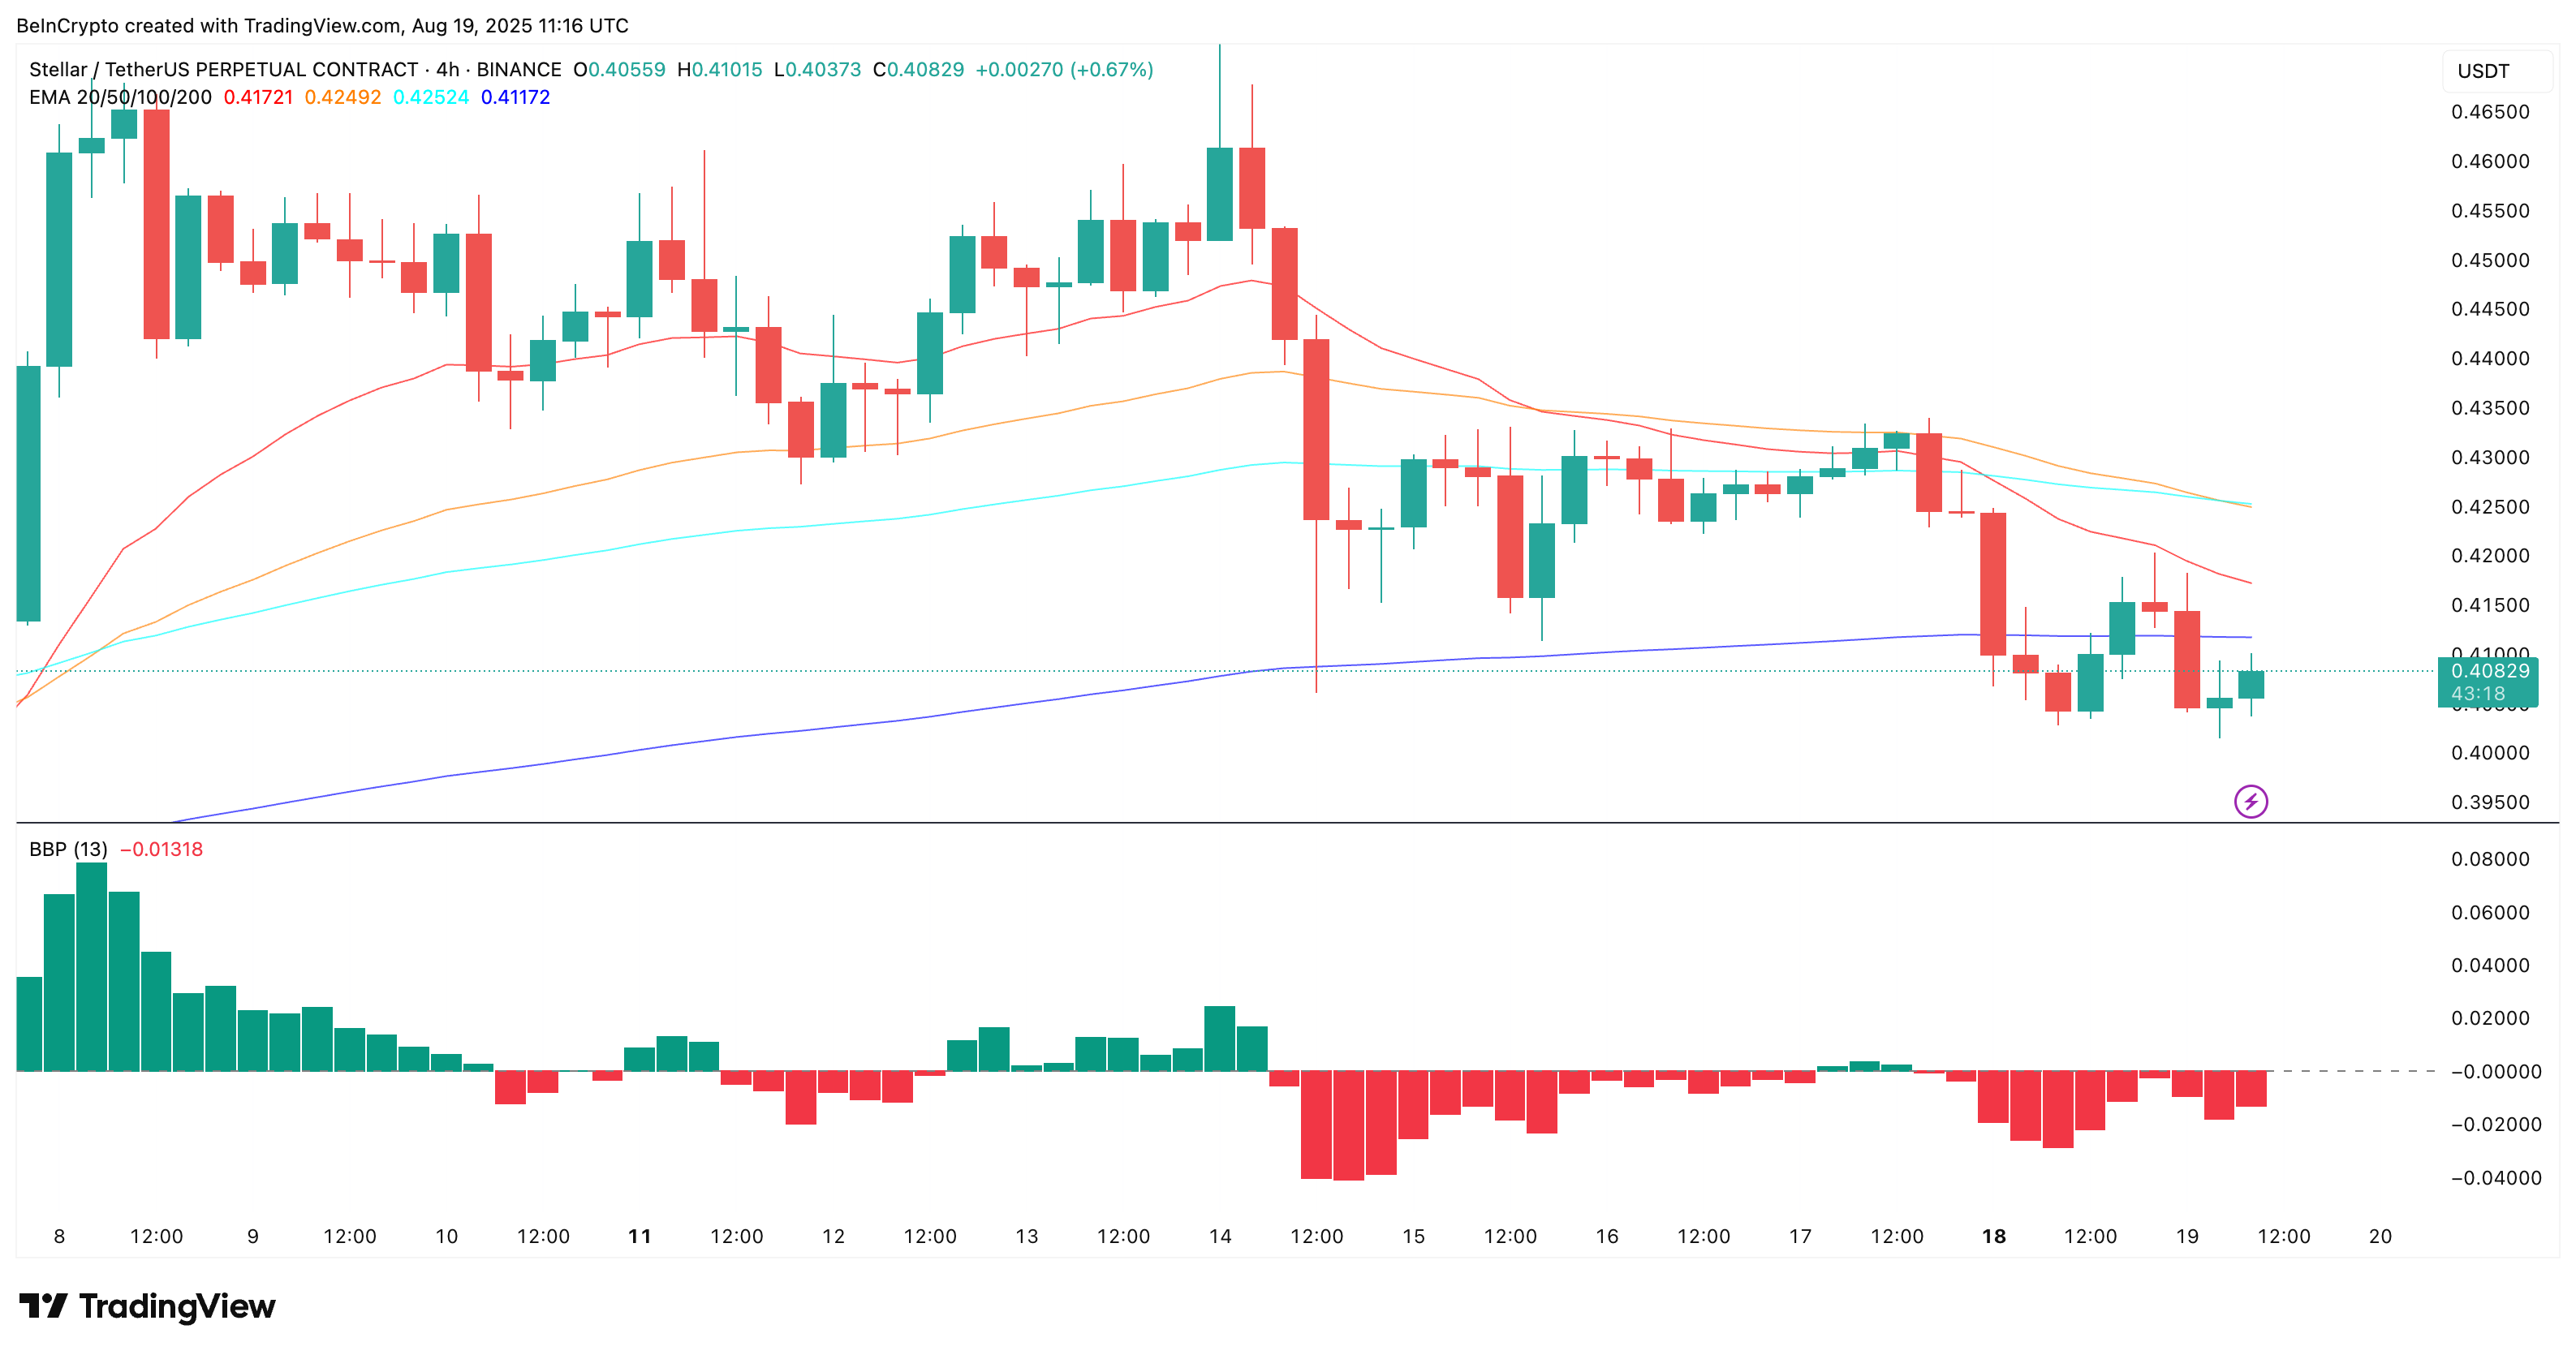 XLM price and bearish crossover:
TradingView
XLM price and bearish crossover:
TradingView
This kind of crossover, also termed the “Death Cross,” is infamous for triggering sharp corrections.
An Exponential Moving Average (EMA) gives more weight to recent price data to better capture momentum. When a shorter-term EMA crosses below a longer-term EMA, it’s seen as a bearish signal, suggesting that recent prices are declining faster than longer-term trends.
When shorter-term averages like the 50 EMA dip under longer-term ones like the 100 EMA, it’s often seen as a momentum flip, where buyers lose control and sellers start dominating. But that’s not all.
The same chart also shows deep “reds” in the Bull-Bear Power (BBP) indicator. This metric compares recent highs and lows to a trend-following average to gauge buying or selling dominance. XLM’s BBP is now in negative territory, confirming that bears have taken control of the short-term price structure.
So far, the price action shows weakness. But that’s only half the story.
Liquidation Map Shows Shorts Dominating, And That’s the Only Hope
On Bitget, XLM has seen nearly $75.82 million in short liquidations and close to $20 million in long liquidations over the past 7 days — highlighting a heavy bearish bias in trader positioning.
Right now, that’s the only bullish angle in XLM’s setup. If broader market momentum lifts the price even slightly, shorts may begin getting squeezed, causing forced liquidations and pushing prices higher.
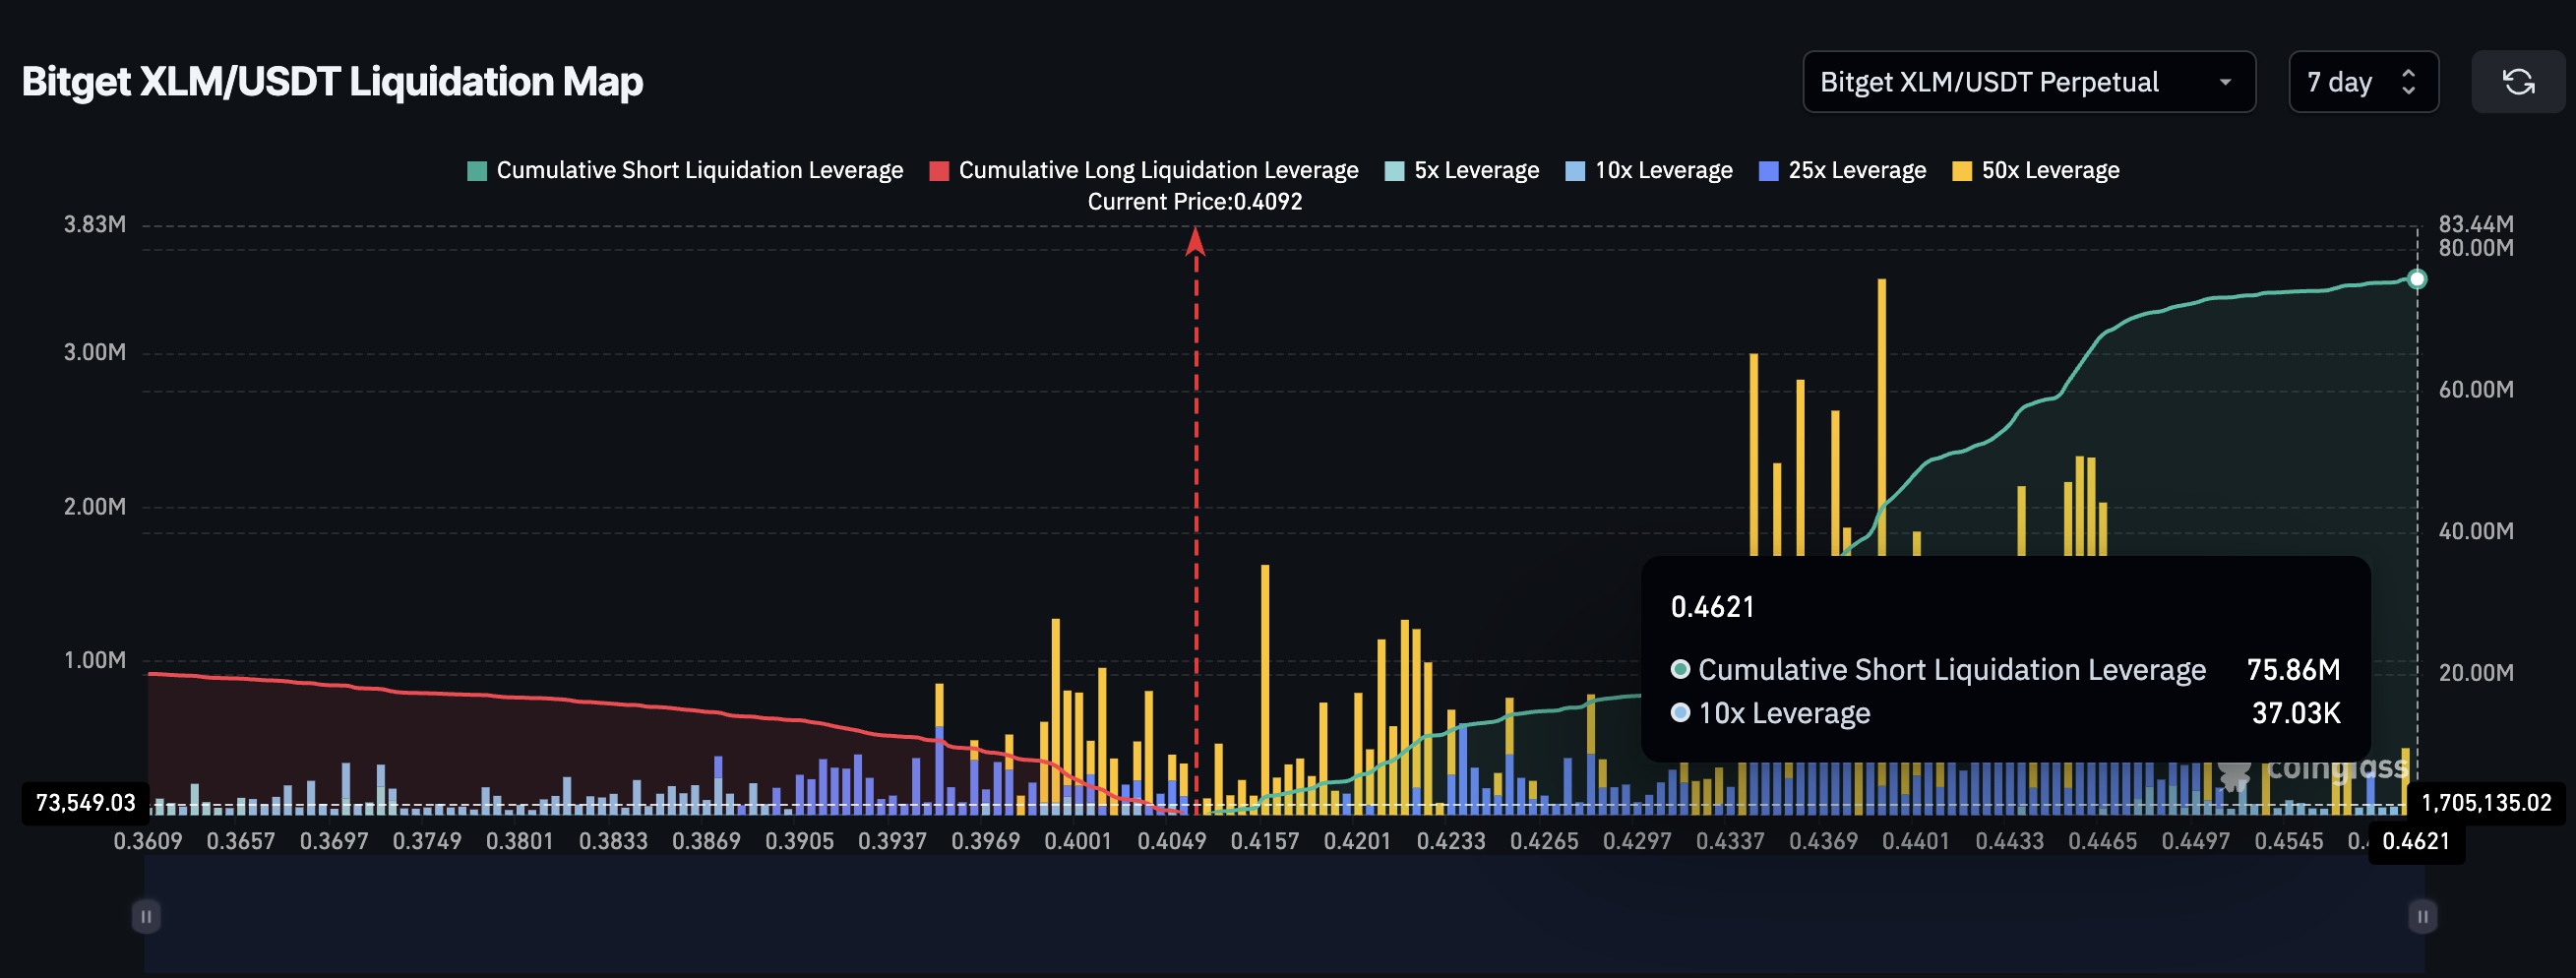 XLM liquidation map:
Coinglass
XLM liquidation map:
Coinglass
A short squeeze happens when too many traders bet on a price drop (open shorts), but instead the price moves up, forcing them to buy back in a hurry. This panic buying drives prices even higher, often suddenly.
XLM Price Pattern Breaks Down, But Critical Levels Remain in Sight
XLM has clearly broken down from its recent pennant formation on the daily chart. The immediate support level now sits at $0.40. If this breaks cleanly, the bearish crossover and BBP pressure could drive a move towards $0.36 in the coming sessions.
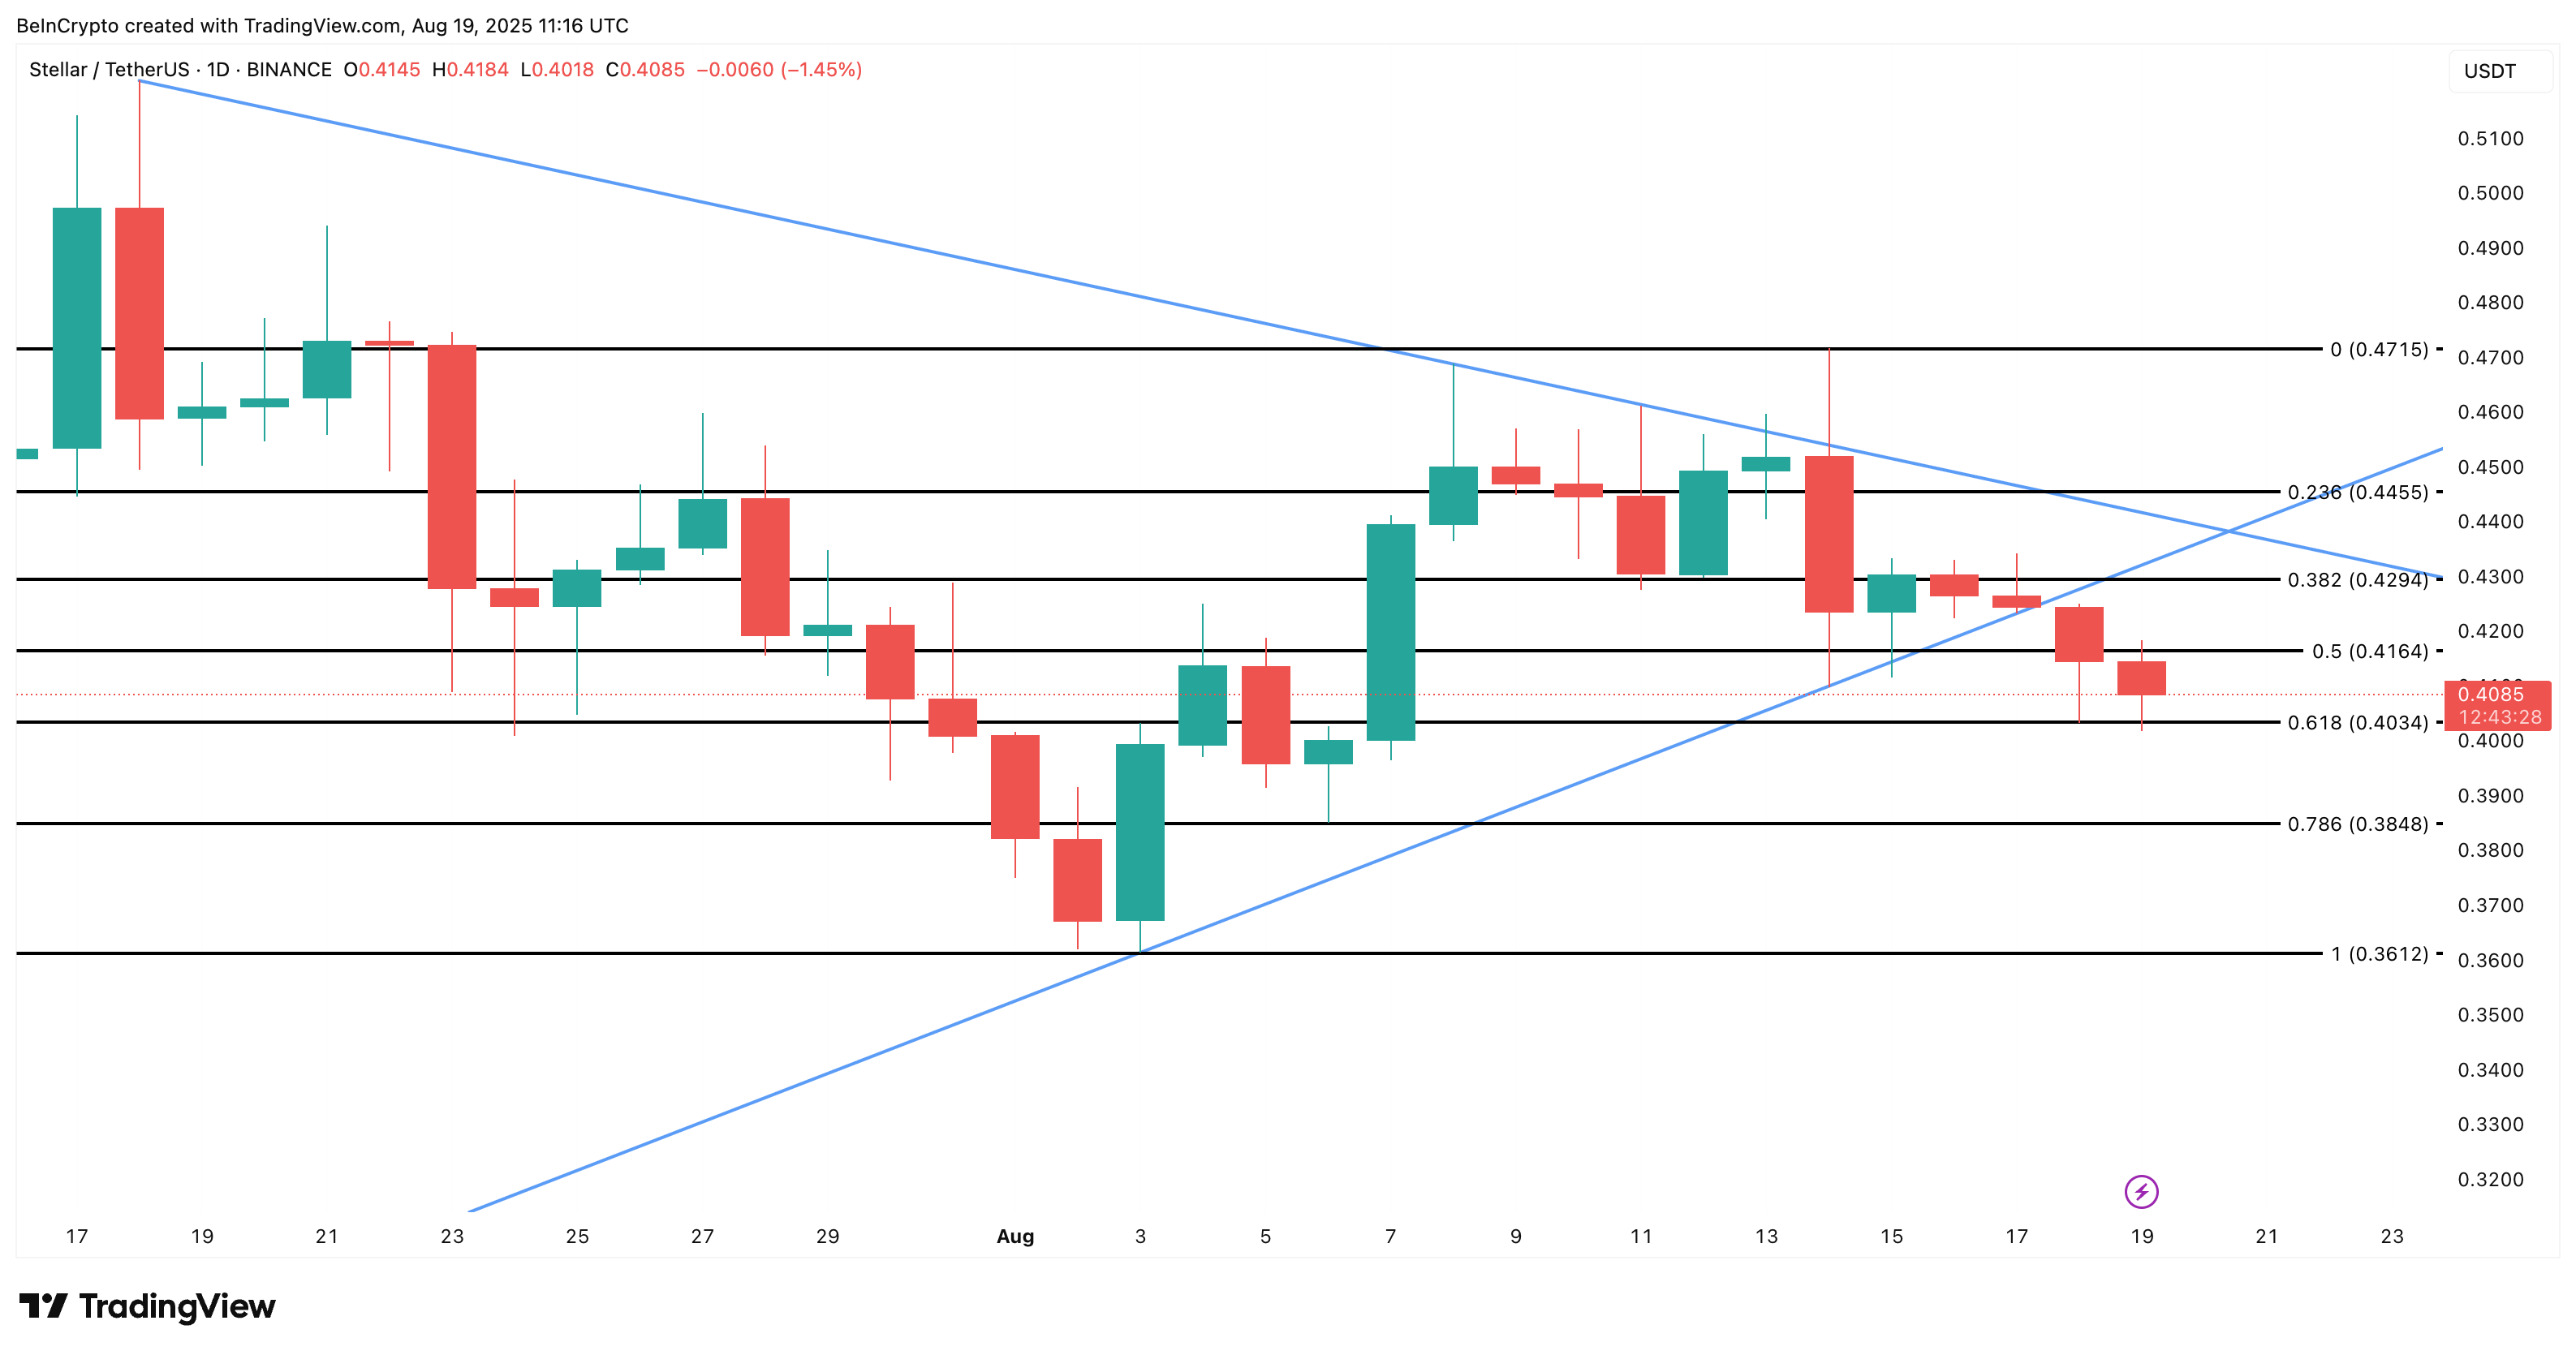 XLM price analysis:
TradingView
XLM price analysis:
TradingView
However, if a short squeeze does kick in, and XLM manages to reclaim the $0.42 to $0.44 zone, the near-term bearish structure would be invalidated. This would flip short-term sentiment and possibly trigger aggressive buys.
Until that happens, though, the bears remain firmly in control, with only one unusual imbalance offering any reason to hope.
Disclaimer: The content of this article solely reflects the author's opinion and does not represent the platform in any capacity. This article is not intended to serve as a reference for making investment decisions.
You may also like
Canton: The Web3 financial infrastructure truly used by Wall Street
Is the institutional narrative behind Canton becoming impossible to hide?

From Bitcoin to Zcash: Why Privacy is Considered the "Last Thousandfold Opportunity" in Crypto
Among the three core issues faced at the inception of Bitcoin, the privacy sector has become the only remaining area with the potential for asymmetric returns.

$1.3 billion paper loss! Tom Lee's Ethereum gamble collapses under market pressure
Bitmine's market capitalization to net asset value ratio has plummeted from 5.6 in July to 1.2, with its stock price down 70% from its peak.

Bitcoin May Face "The Last Drop": The Real Scenario of Liquidity Squeeze Is Unfolding
Bitcoin may be in the "final drop" stage of this correction. At the intersection where fiscal spending resumes and the next interest rate cut cycle begins, a new liquidity cycle will also be restarted.