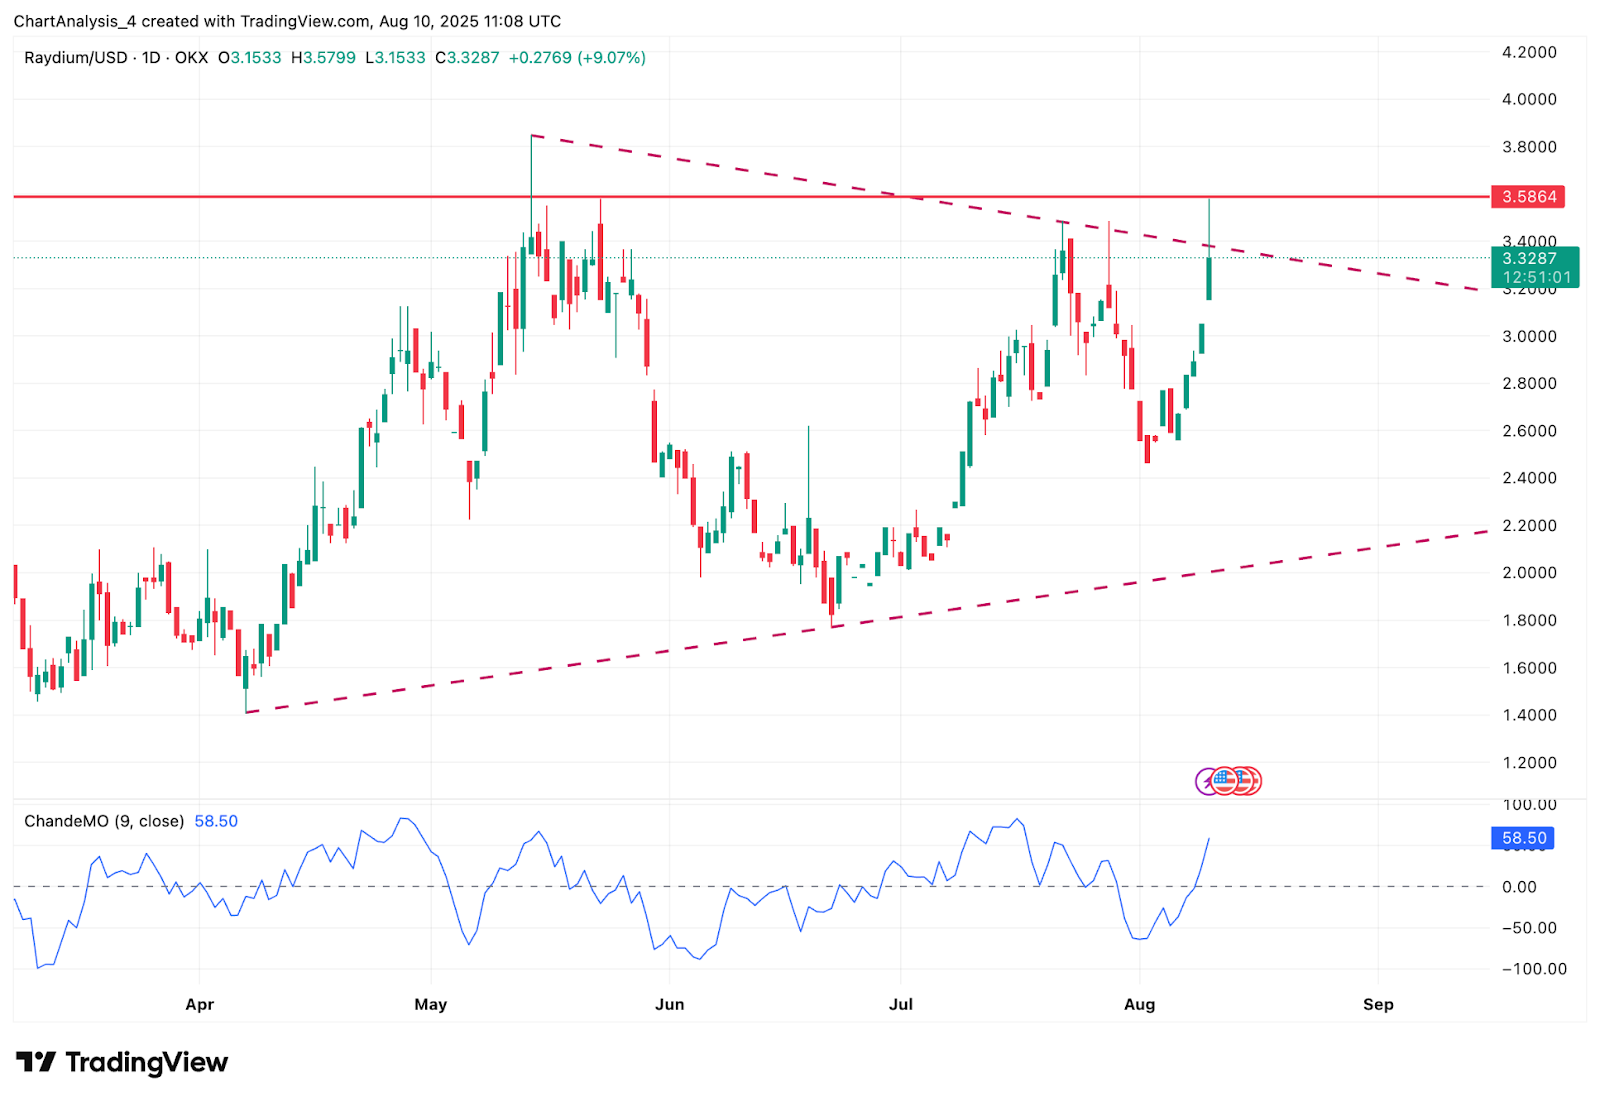
RAY price today is trading at $3.3287 after a sharp rally from last week’s low near $2.56. The move has brought price to the upper boundary of a long-term descending triangle pattern visible on the daily chart, with immediate resistance between $3.40 and $3.58. The rally has also carried price above the 0.236 Fibonacci retracement on the weekly chart at $2.9244, shifting the higher timeframe bias in favor of buyers. The next 24 hours will hinge on whether bulls can sustain momentum through $3.40 and challenge the $3.858 Fibonacci 0.382 level.
What’s Happening With Raydium’s Price
 RAY price dynamics (Source: TradingView)
On the daily timeframe, RAY has rebounded aggressively from the $2.56 low and is now testing the descending trendline that has capped rallies since April. The Chande Momentum Oscillator reads 58.50, confirming strong upward momentum.
 RAY price dynamics (Source: TradingView)
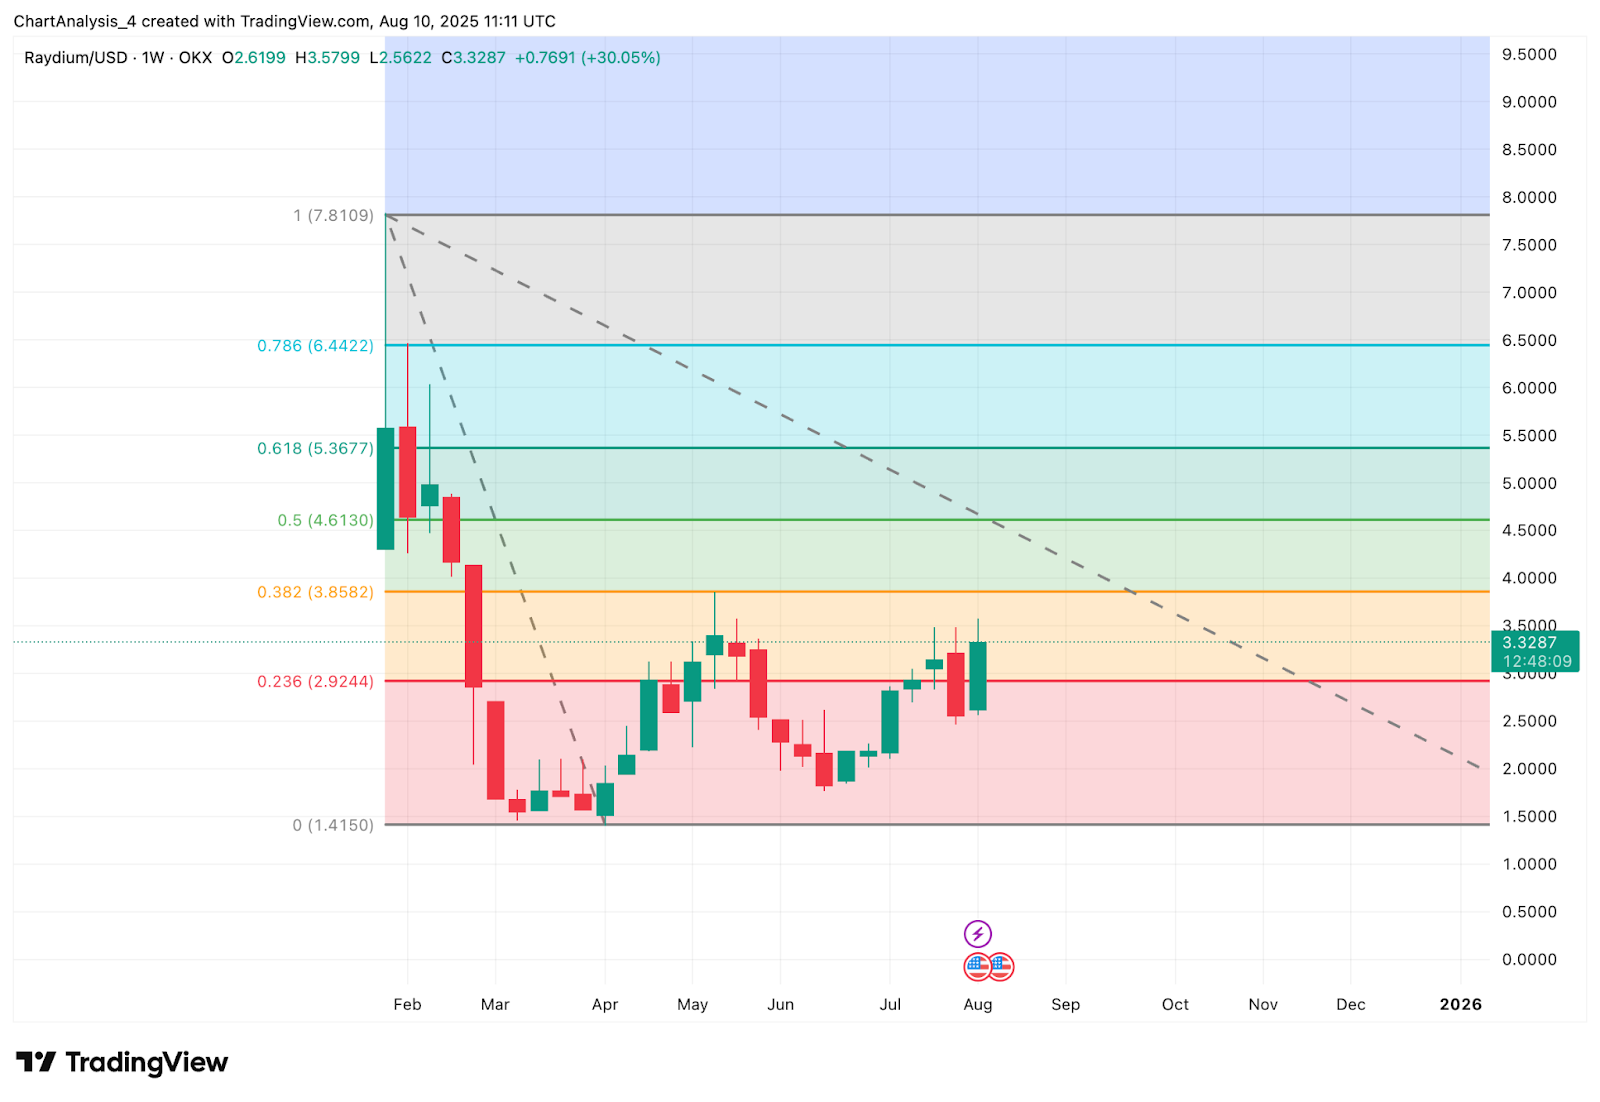
The weekly Fibonacci structure shows RAY above the 0.236 retracement at $2.9244, with the 0.382 retracement at $3.858 as the next major upside level. Clearing $3.858 would expose the 0.5 retracement at $4.6130.
Why Is The Raydium Price Going Up Today
 RAY price dynamics (Source: TradingView)
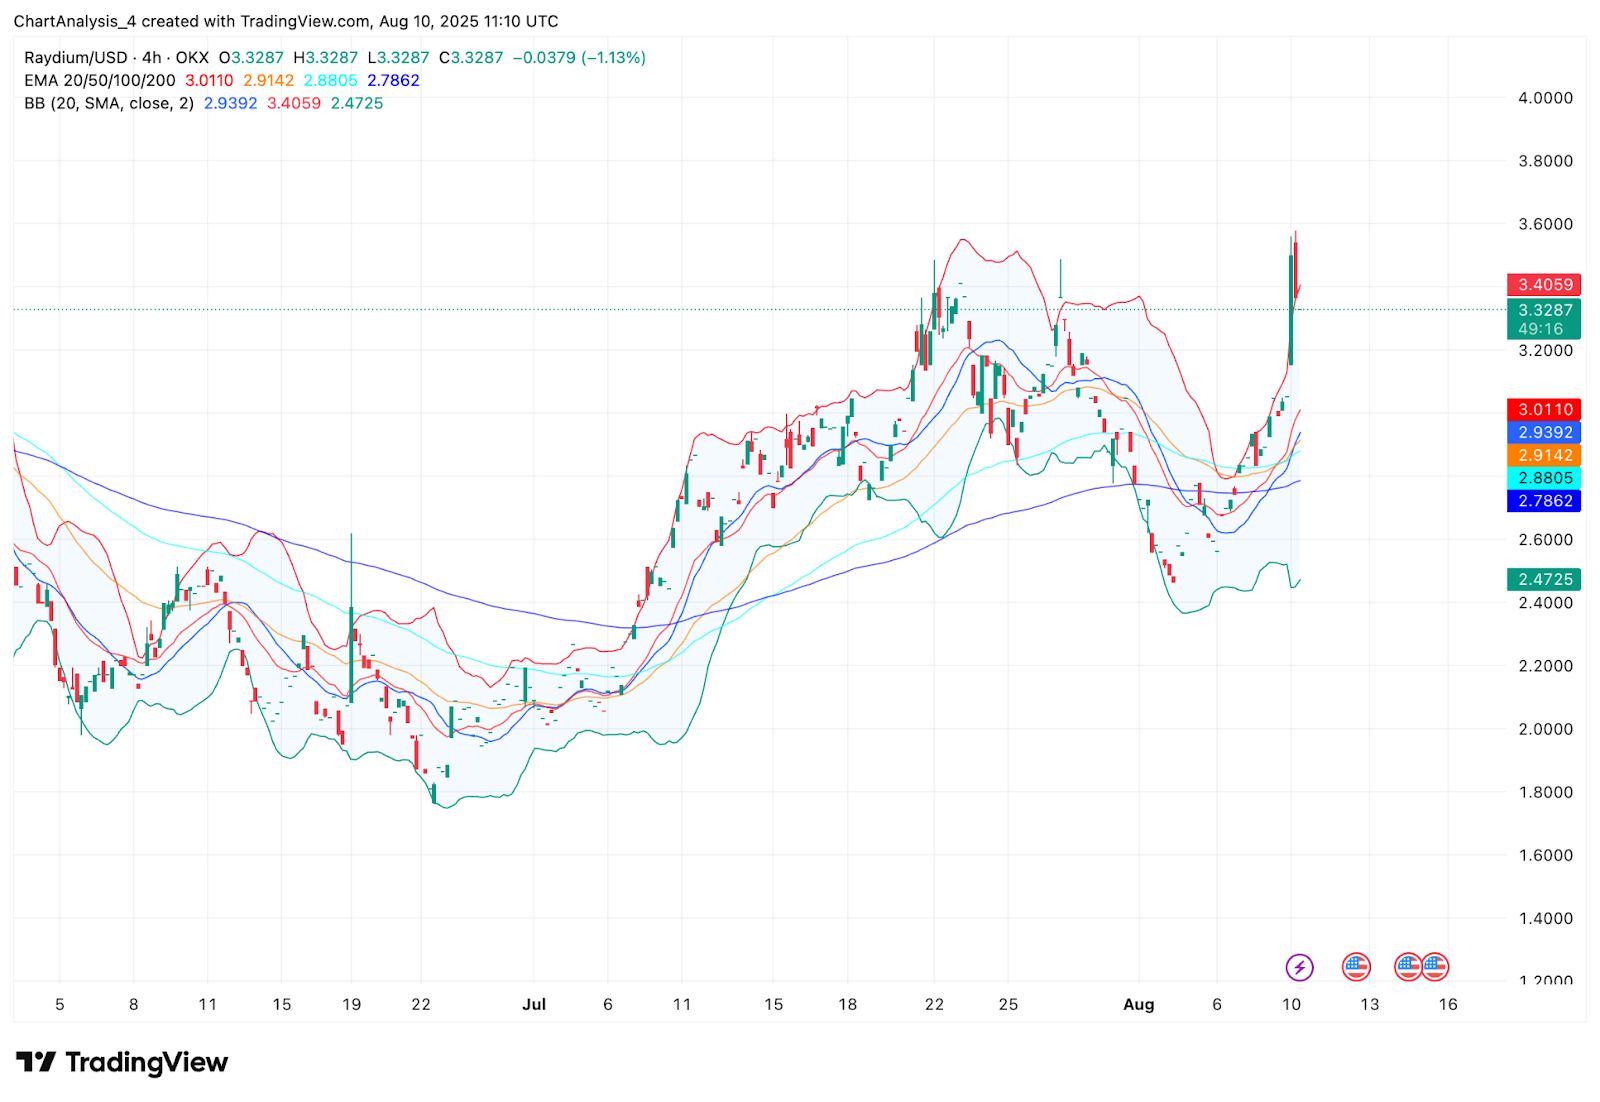
The 4-hour chart shows price trading near the upper Bollinger Band at $3.4059 after breaking through the EMA20 at $3.0110, EMA50 at $2.9142, EMA100 at $2.8805, and EMA200 at $2.7862, all of which now form a stacked bullish base below.
The rally is driven by a combination of technical breakout momentum and strong market flows. The breakout above $3.0110, $2.9392, and $2.4725 Bollinger Band midlines confirms that volatility expansion is in favor of buyers.
 RAY price dynamics (Source: TradingView)
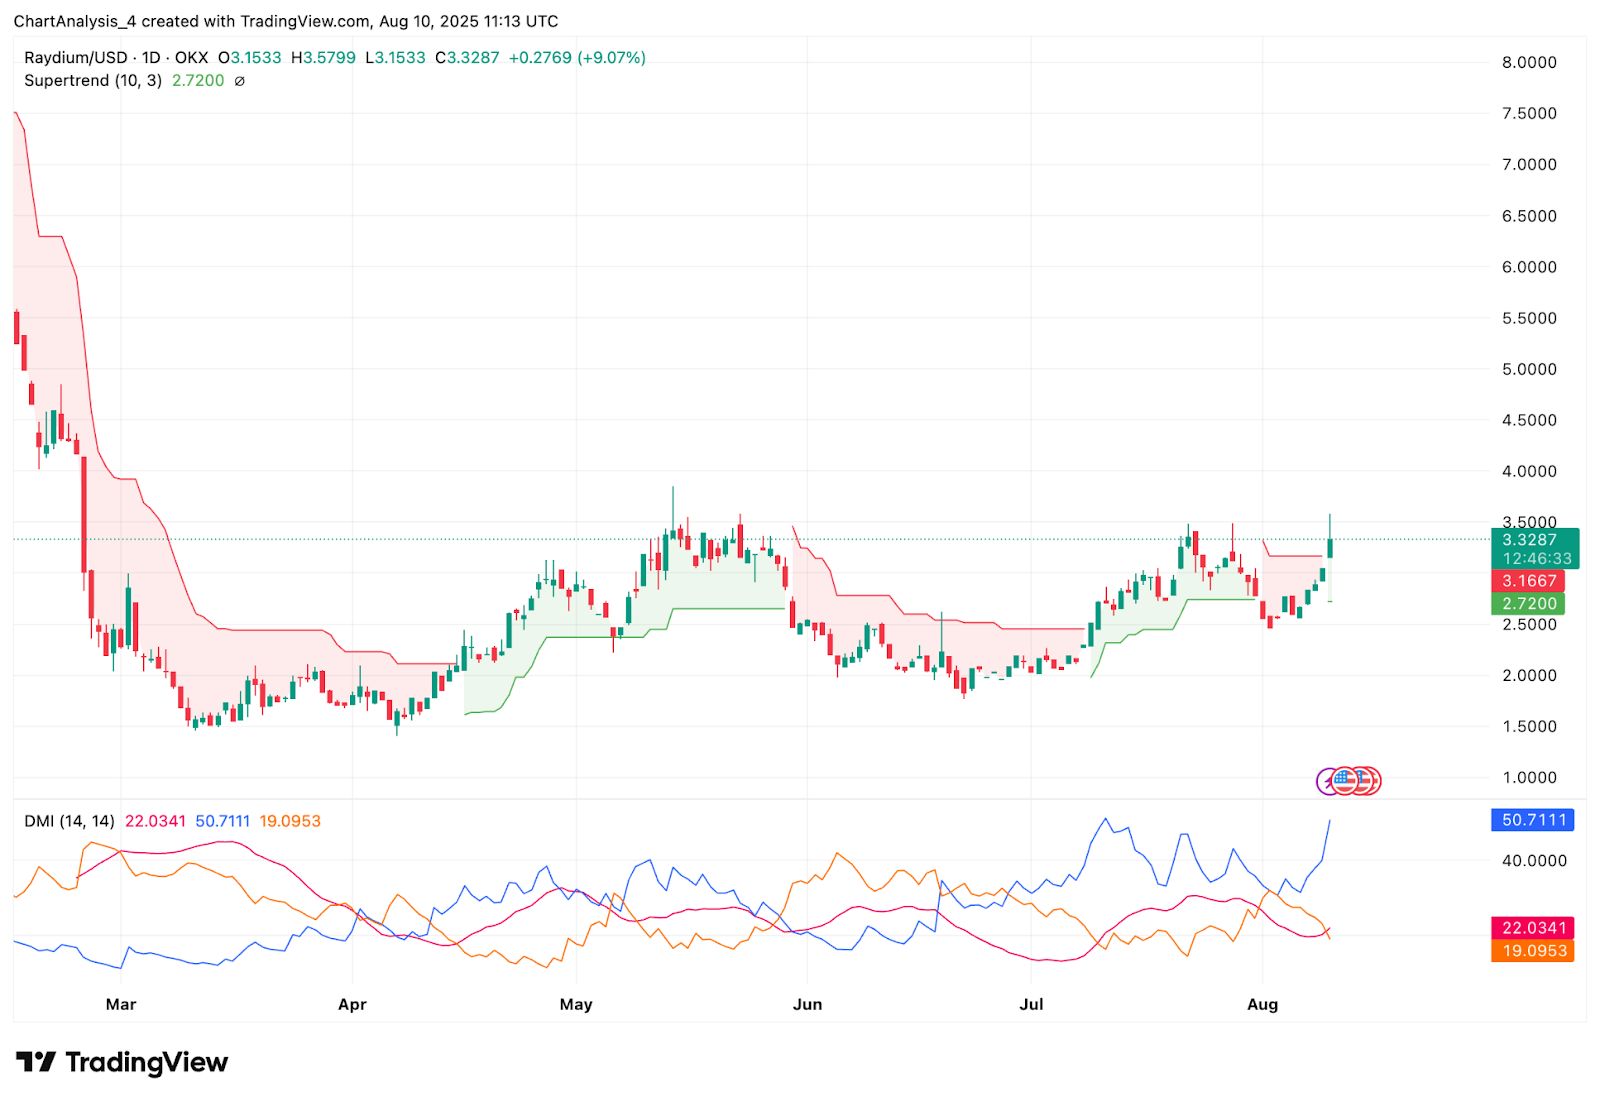
On the downside, the 1D Supertrend is bullish above $2.7200, which aligns closely with prior breakout levels. The DMI readings show +DI at 50.71 well above -DI at 19.09, with ADX at 22.03, indicating that trend strength is accelerating.
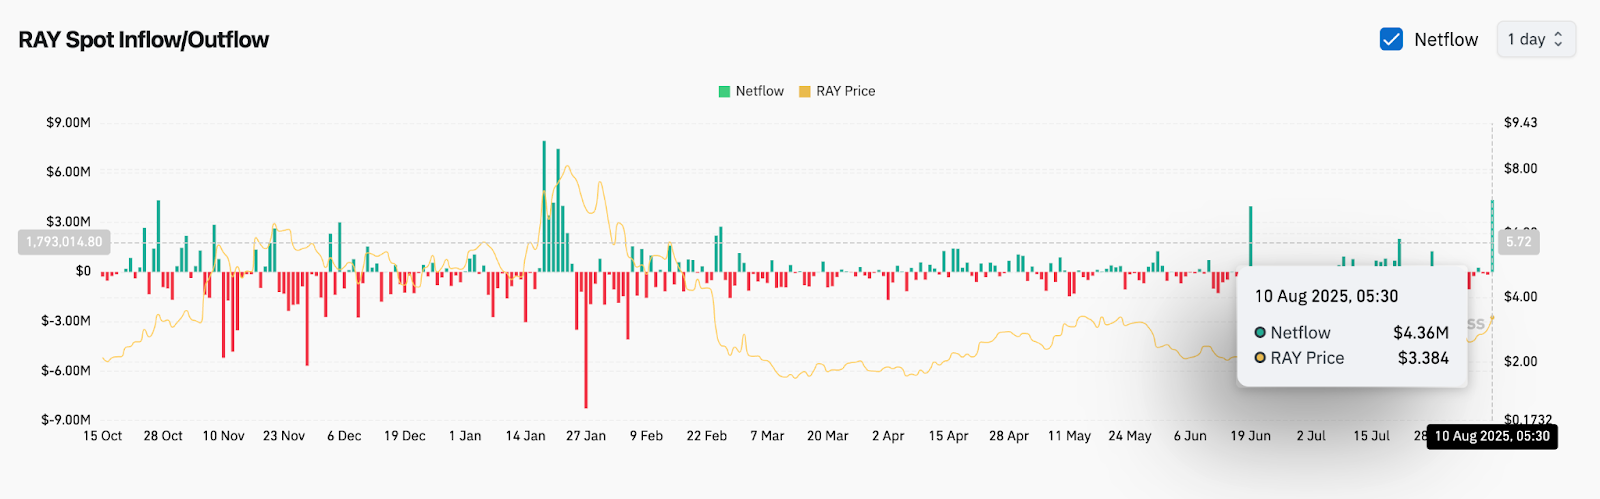 RAY Spot Inflow/Outflow (Source: Coinglass)
Spot inflows of $4.36M on August 10 highlight significant accumulation interest, supporting the sustainability of the breakout attempt. Net inflows in the millions suggest that institutional or large-lot traders are positioning for higher levels, making the current rally fundamentally supported by capital movement as well as chart structure.
Indicator-Based Intraday Focus
 RAY price dynamics (Source: TradingView)
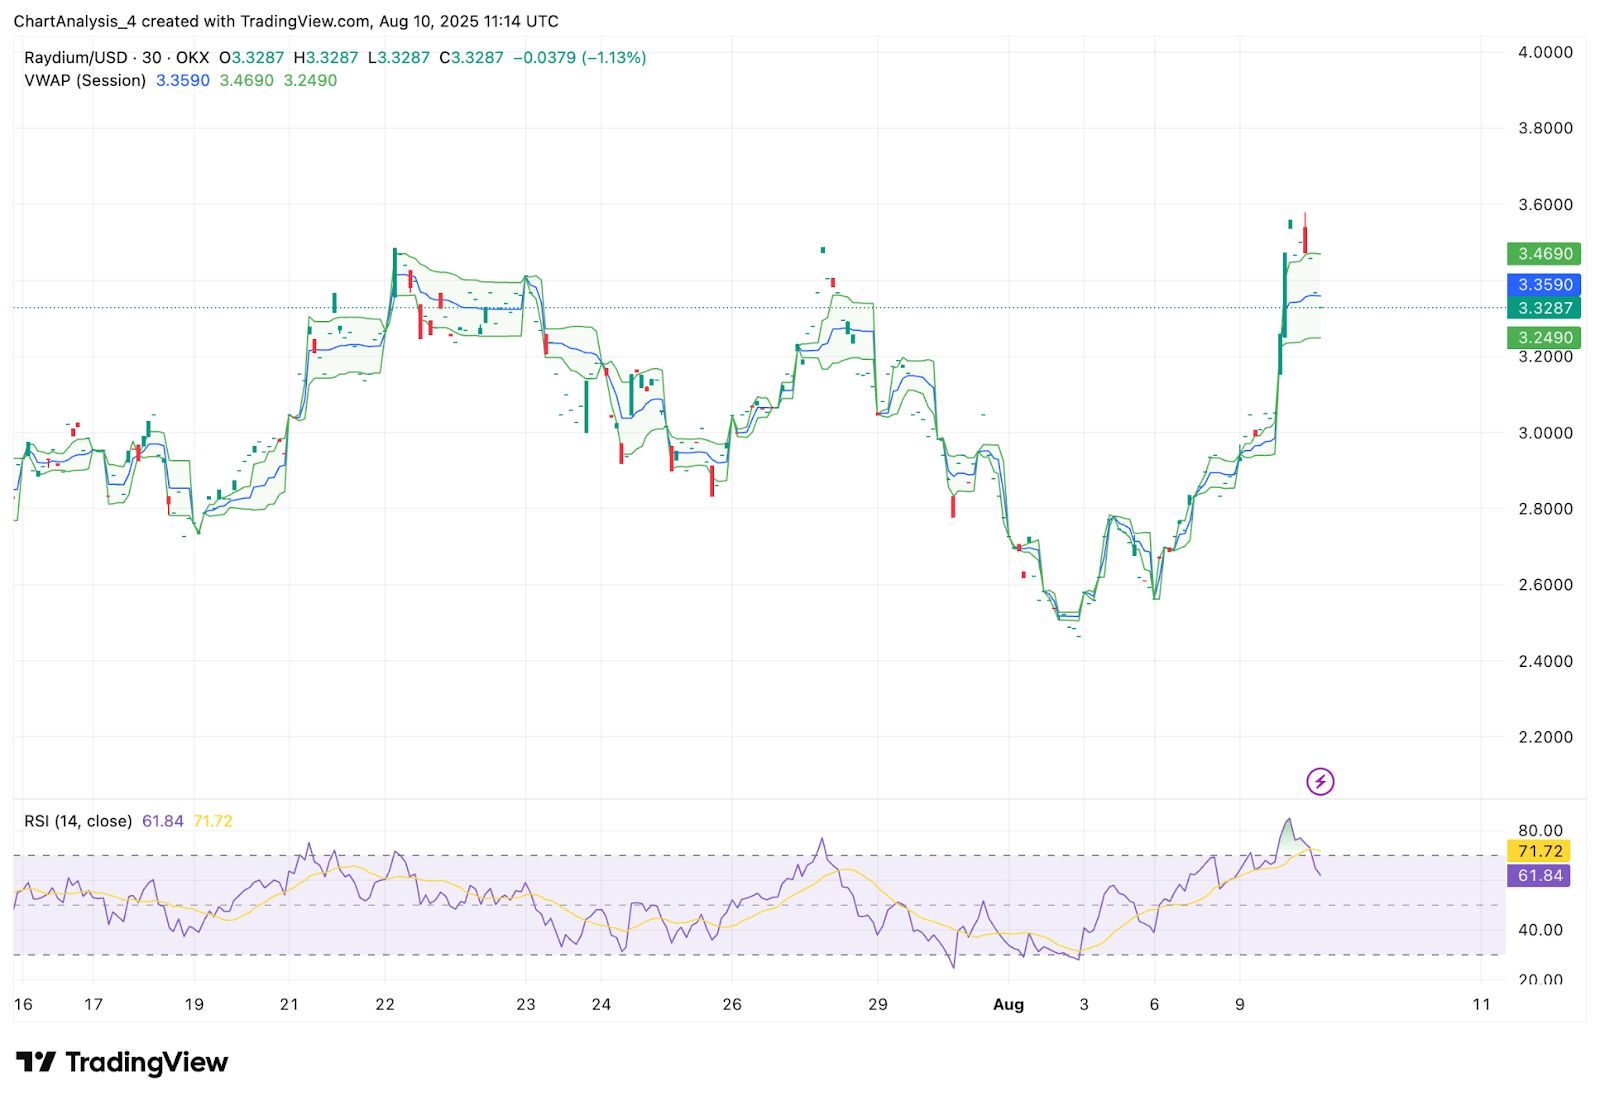
Intraday action is concentrated around the VWAP at $3.3590, which will be key for determining whether RAY can immediately retest $3.40 and attempt a breakout. The Bollinger Band upper line on the 4-hour chart at $3.4059 remains the nearest resistance, and clearing it with volume would confirm continuation toward $3.4690 and beyond.
RSI on the 30-minute chart is easing from overbought levels, offering potential for renewed momentum if price holds above the EMA20 at $3.0110 on the 4-hour chart. The Supertrend remains bullish at $2.7200, maintaining the intraday trend bias as long as this level holds.
RAY Price Prediction: Short-Term Outlook (24h)
In the bullish scenario, a sustained break above $3.4059 would set the stage for a run toward $3.4690, followed by $3.858 at the weekly Fibonacci 0.382 level. Surpassing $3.858 would put the $4.6130 level in play, but the immediate hurdle remains $3.40–$3.41. This outlook remains valid while price holds above the EMA20 on the 4-hour chart at $3.0110 and the VWAP at $3.3590.
In the bearish scenario, rejection at $3.40 and a drop below VWAP at $3.3590 would shift focus back toward $3.1667, followed by $2.9392 at the 4-hour Bollinger Band midline. A break beneath the Supertrend at $2.7200 would neutralize the current bullish structure and open downside targets at $2.4725. Given the strong trend readings and high inflows, the confidence level for a bullish continuation is medium-high, provided resistance at $3.40 is cleared on volume.
Raydium Price Forecast Table: August 11, 2025
| Indicator/Zone | Level / Signal |
| Current Price | $3.3287 |
| Resistance 1 | $3.4059 |
| Resistance 2 | $3.8580 |
| Support 1 | $3.1667 |
| Support 2 | $2.7200 |
| EMA20 / EMA50 (4H) | $3.0110 / $2.9142 |
| EMA100 / EMA200 (4H) | $2.8805 / $2.7862 |
| RSI (30-min / 4H) | 61.84 / Over 60 |
| Supertrend (1D) | Bullish above $2.7200 |
| VWAP (30-min) | $3.3590 |
| Liquidity zones | $3.858 / $2.4725 |