Bitcoin Price Regains Strength – Can the Rebound Turn Explosive?

Bitcoin price is recovering from the $112,000 support zone. BTC is rising and might attempt to clear the $115,500 resistance zone to gain bullish momentum.
- Bitcoin started a decent upward move from the $112,000 zone.
- The price is trading above $114,000 and the 100 hourly Simple moving average.
- There is a bullish trend line forming with support at $114,600 on the hourly chart of the BTC/USD pair (data feed from Kraken).
- The pair might start another increase if it clears the $115,500 resistance zone.
Bitcoin Price Eyes Upside Break
Bitcoin price started a downward move from the $118,000 zone. BTC declined below the $115,000 and $113,500 support levels to enter a short-term bearish zone.
The price tested the $112,000 zone. A base was formed and the price is now attempting to recover. There was a move above the $113,500 and $114,200 levels. The price surpassed the 23.6% Fib retracement level of the downward move from the $118,918 swing high to the $112,000 low.
Bitcoin is now trading above $114,200 and the 100 hourly Simple moving average. There is also a bullish trend line forming with support at $114,600 on the hourly chart of the BTC/USD pair.
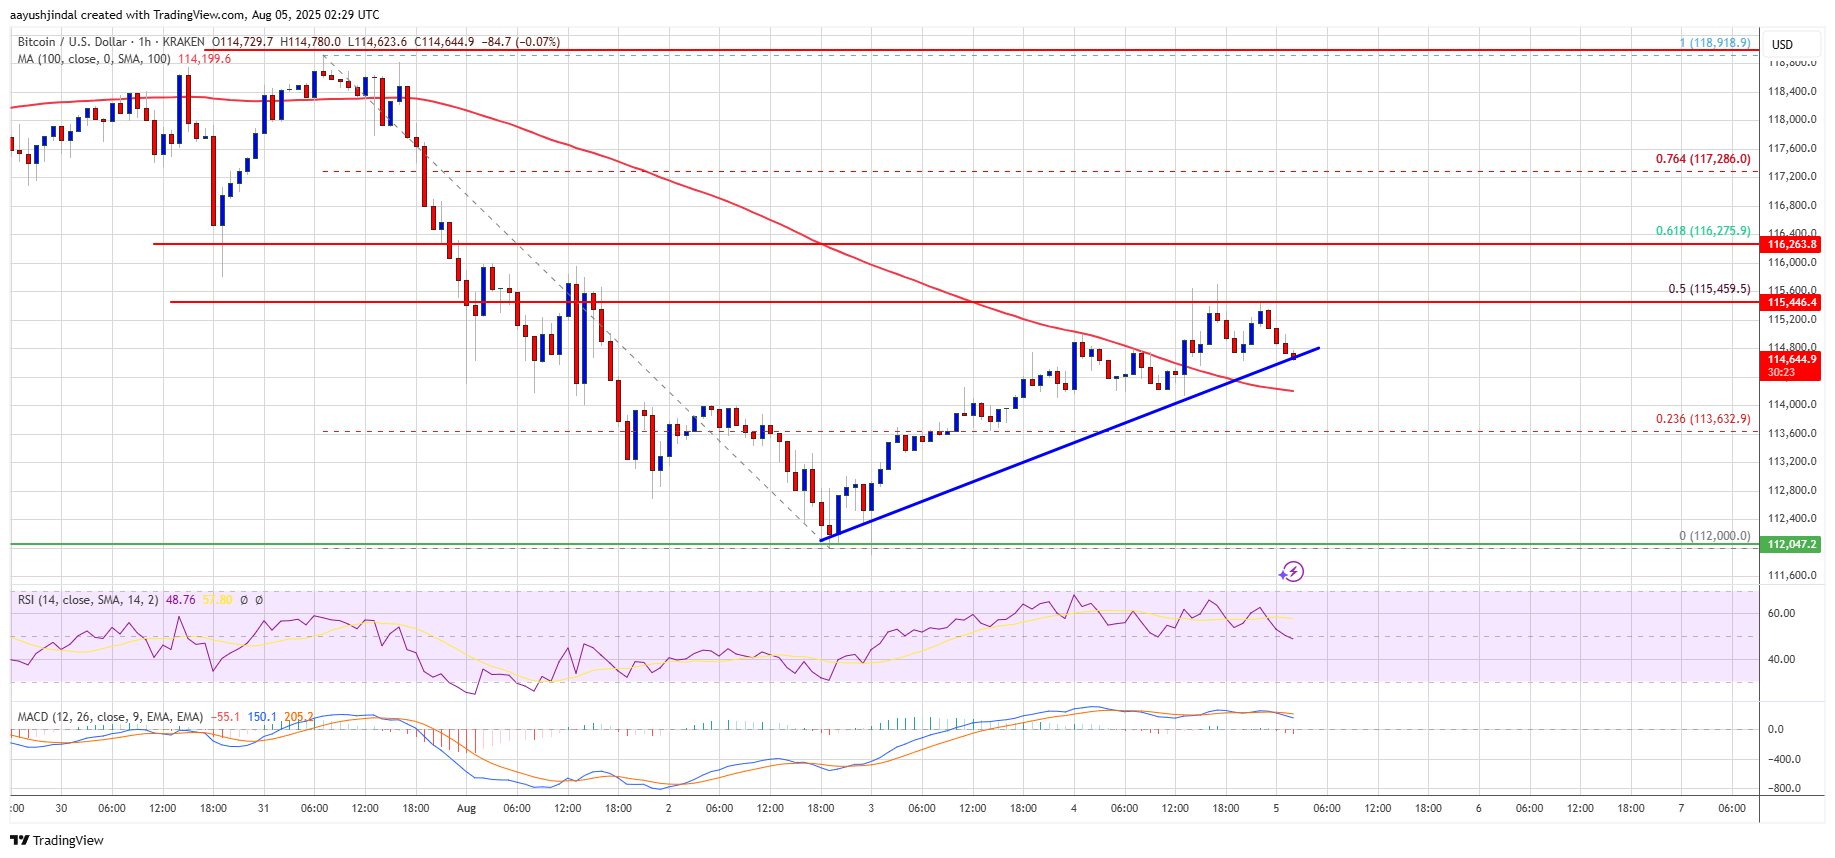
Immediate resistance on the upside is near the $115,500 level. It is close to the 50% Fib retracement level of the downward move from the $118,918 swing high to the $112,000 low. The first key resistance is near the $116,250 level. The next resistance could be $116,800. A close above the $116,800 resistance might send the price further higher. In the stated case, the price could rise and test the $118,500 resistance level. Any more gains might send the price toward the $120,500 level. The main target could be $121,200.
Another Decline In BTC?
If Bitcoin fails to rise above the $115,500 resistance zone, it could start another decline. Immediate support is near the $114,600 level. The first major support is near the $113,500 level.
The next support is now near the $112,000 zone. Any more losses might send the price toward the $110,500 support in the near term. The main support sits at $108,500, below which BTC might continue to move down.
Technical indicators:
Hourly MACD – The MACD is now gaining pace in the bullish zone.
Hourly RSI (Relative Strength Index) – The RSI for BTC/USD is now above the 50 level.
Major Support Levels – $114,600, followed by $113,500.
Major Resistance Levels – $115,500 and $116,800.
Disclaimer: The content of this article solely reflects the author's opinion and does not represent the platform in any capacity. This article is not intended to serve as a reference for making investment decisions.
You may also like

Polymarket: The Rise of Cryptocurrency Prediction Markets

Can Bitcoin start a Christmas rally after returning to $90,000?

Vitalik's 256 ETH Donation: A Strategic Turning Point for the Privacy Communication Sector