Date: Wed, July 30, 2025 | 05:15 AM GMT
The broader cryptocurrency market is currently undergoing a healthy pullback after Ethereum (ETH) touched its multi-year resistance around $3,940 before easing back to $3,775. This temporary cooling has weighed on altcoins , including Ethena (ENA), which is down 6% on the day—cutting into its 30 day gains, now trimmed to 109%.
But a deeper look at ENA’s price action reveals a potentially powerful setup. If history is any guide, this emerging fractal pattern could be signaling a bullish reversal.
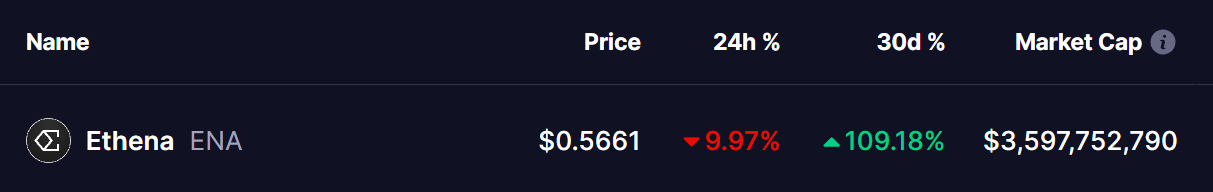 Source: Coinmarketcap
Fractal Setup Hints at a Bullish Reversal
On the daily chart, ENA is exhibiting signs of a repeat performance of its 2024 breakout structure. Back then, ENA printed a classic double-bottom reversal pattern. The move was initiated by a falling wedge breakout, followed by a bullish reclaim of the 200-day moving average. After a brief consolidation in the blue resistance zone, the token exploded nearly 89% to the upside in just a few weeks.
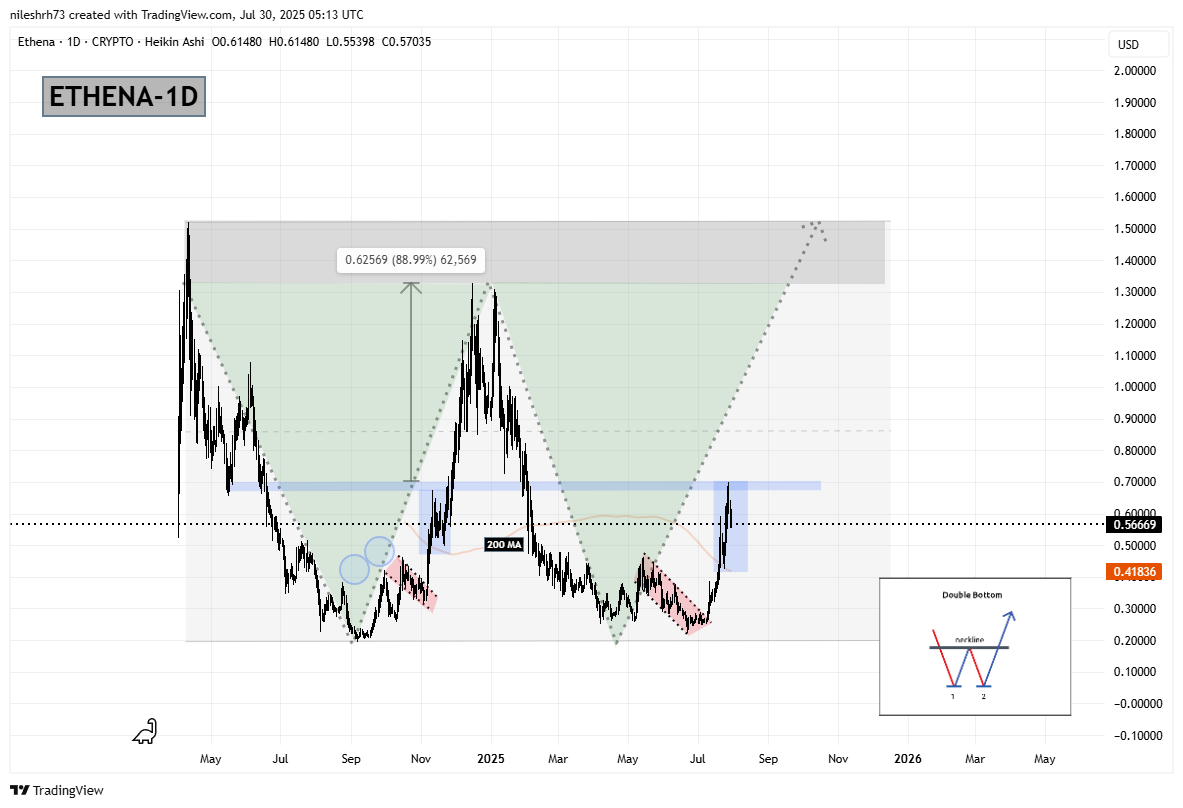 Ethena (ENA) Daily Chart/Coinsprobe (Source: Tradingview)
Fast forward to now, and ENA seems to be following a strikingly similar path.
It has again formed a rounded V-shaped bottom and broken out of a downward wedge. It is currently retesting the same 200-day moving average zone, with price consolidating just under the blue horizontal resistance — nearly identical to the prior breakout structure.
What’s Next for ENA?
If ENA can break decisively above the $0.70 region (marked in blue), it would confirm the neckline breakout of this double-bottom fractal. Should the pattern continue to unfold like the 2024 move, ENA could be on track to test its former resistance near $1.33 — representing nearly 90% upside from current prices.
However, the fractal also suggests that a short-term correction may still occur before the breakout. A healthy retest above the 200-day moving average would not invalidate the setup but rather align with the rhythm of the previous cycle.
Disclaimer: This article is for informational purposes only and does not constitute financial advice. Always do your own research before making any investment decisions in the crypto market.